1
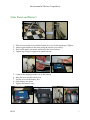
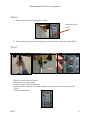
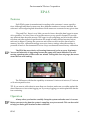
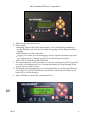
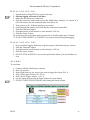
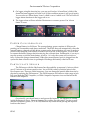
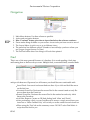
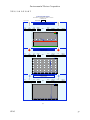
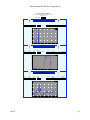
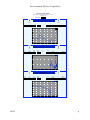
Environmental Devices Corporation
EPAS Manual
Environmental Perimeter Air Station
V. 3
For Window/PC and MacOS
EPAS 1
Environmental Devices Corporation
TABLE OF CONTENTS
Setup
4
Introduction
4
Tripod
5
Solar Panel and Battery
7
Alarm
8
Wind
8
EPAS
9
Peripheral Sensors (optional)
9
Computer
9
Specifications
9
Insta"ation
9
EPAS
10
Features
10
Operation
10
Datalo#ing On
12
Datalo#ing Off
12
Alarms
12
Power Consideration
13
Particulate Sensor
13
Calibration
14
Reprogram Lo#er
15
Software
CONNECTING TO HazScanner
15
15
Upload Data
16
View Current Data
16
Alarms
17
Advanced
18
VIEWING DATA
View Uploaded Data
EPAS 18
18
2
Environmental Devices Corporation
Reports
20
Navigation
21
Find
21
Troubleshooting
22
Having trouble connecting
22
Creating a report
22
Power Off
22
Quick Start Sheet
23
Insta" So%ware
23
Start EPAS
23
Specifications
24
EPAS Overview
24
Carbon Monoxide (CO)
25
Carbon Dioxide (CO2)
26
Nitric Oxide (NO)
27
Nitrogen Dioxide (NO2)
28
Ozone (o3)
29
Particulates
30
Relative Humidity
30
Sulfur Dioxide (SO2)
31
Temperature
31
VOC’s
32
Wind Direction
33
Wind Speed
34
Air Velocity
35
Atomic Radiation
35
ELF
35
Light Intensity
35
Sound
35
Sample Reports
36
Data Export
36
Sensor report
39
Cover
42
Average period Report
43
Contact
EPAS 44
3
Environmental Devices Corporation
SETUP
Introduction
The portable HAZSCANNER™ EPAS wireless environmental perimeter air station is
easily deployed as an ambient air quality monitor to measure and document critical U.S.
EPA criteria pollutants including nitrogen dioxide, sulfur dioxide, ozone, carbon dioxide,
particulates, VOCs, and more. The EPAS provides direct readings in real time with datalogging capabilities. Build your own station to provide up to 14 simultaneous critical air measurements in one battery-operated instrument. The HazScanner™ EPAS Monitoring System
has been designed to provide accurate data through a simple, intuitive user interface. This
manual will facilitate your ability to collect data with a minimum of effort. To analyze the
data refer to the software manual. Don’t read manuals? Take a quick look at the Quick Start
Sheet to get you up to speed quickly.
1. Wind (speed/direction)
2. High gain antenna (optional)
3. HazScanner EPAS
Internal Gas Sensors
•CO •SO2 •VOC •CO2
•NO2 •O3 •CH4
•special sensors available
4. Peripheral Monitors (optional)
•Sound •Rain
•Atomic Radiation
•Solar Irradiance
Each HazScanner system is manufactured according to the customer’s sensor specifications. Although individual systems may have different numbers of sensors attached, the
software is self-configuring and determines which sensors are connected at any given time.
NOTE: For data from any given sensor to be collected by the system, the sensor
must be either connected and turned on before starting the HazScanner system, or
you must press the sense button on the display panel. You cannot connect and new
sensors while data logging.
The logger is self-configuring and all relevant calibration data and other technical
specifications are stored in battery-backed memory before each unit is shipped. Turning the
system on and off has no effect on this data stored in memory; however, calibration settings
are reset to factory settings when the machine is powered off and on. Environmental De-
EPAS 4
Environmental Devices Corporation
vices Corp. recommends annual factory calibration. The system is self zeroing.
Several of the sensors, most notably the ELF meter air flow and light meter and the
atomic radiation detector, can be disconnected and used independently of the HazScanner
system. Of course, without being connected, these sensors will only display data on their
built-in LCD displays; no data is stored in memory for later retrieval. The hand-held meters
are normally mounted on tripod holders. Place holders in position before connecting the
signal cable to the sensor and HazScanner. To disassemble, repeat these steps in the reverse
order. These meters are turned on using their own switch and are powered by 9V replaceable batteries. See meter instructions for further information.
Tripod
Always select a level area with no obstructions overhead.
1.Loosen Lower Mast bolts and unfold Tripod legs. 2.Extend fully and tighten on lower mast pole.
3.Attach and anchor the feet of the tripod with provided anchors (spikes or screws).
4.Insert Mast (if needed)
5.Loosen upper mast nut.
6.Attach wind sensors and set the wind direction ‘North’ mark to north (see below).
7.Insert or raise mast and adjust height and tighten nut (keeping the wind sensor orientation). Beware of wires and other obstructions.
8.Insert pin to lock mast.
EPAS 5
Environmental Devices Corporation
9.Attach battery shelf (if needed).
10.Attach lower solar panel bracket (see below).
11.Attach alarm (see below)
12.Loosen Handle clamp and adjust peripherals holder to desired height and tighten.
13.Note: All screws, nuts & bolts and handle must be tightened & secure before use.
To prevent damage to Equipment.
14.Attach any peripheral sensors.
15.Attach the EPAS.
Backup battery (Optional )
use a cinder block or other
weight if you do not have
the backup battery.
Lower solar panel bracket
16.Connect all wires, including power, peripherals and wind to EPAS
EPAS 6
Environmental Devices Corporation
Solar Panel and Battery
1.
2.
3.
4.
If the lower bracket is not attached attach it to two of the tripod legs. Tighten.
Attach upper bracket to the mast using the clamps. Leave snug.
Pull out the panel and attach with bolt to the lower bracket.
Tighten top clamp on upper solar panel bracket.
5.
6.
7.
8.
9.
Connect the coupling on the wire to the battery.
Place the wire into the battery box.
Put the cover on the battery box.
Slide battery into place.
Tighten the battery strap. EPAS 7
Environmental Devices Corporation
Alarm
1. Attach alarm to the mast using the clamps. Attach alarm cable
to panel
2. Line up notch on top of alarm plug to top of panel outlet on the side of the EPAS. Wind
1.Remove wind sensor from case.
2.Place sensor on top of mast. 3.Attach to mast with provided pin. 4.Line up notch on top of wind sensor plug to top of panel outlet on the side of the
EPAS.
5.Push on and tighten.
EPAS 8
Environmental Devices Corporation
EPAS
1. Turn EPAS on if it is not on. It should be started at least 15 minutes before collecting
data. Also turning it off resets alarms, limits and spans.
2. Scroll through the display and check sensors.
3. Make sure the Wind Status is on if the wind sensors are connected.
Peripheral Sensors (optional)
• Air Velocity Meter
• Atomic Radiation Meter • ELF Meter • Light Intensity Meter • Sound Level Meter • Solar Irradiance
• Precipitation (Rain)
• Heat Stress (wet bulb/dry bulb/temp)
Computer
S P E C I F I C AT I O N S
•
•
•
•
•
•
Windows XP, or Mac OS X 10.1 or higher.
Hard disk with at least 10MB (megabytes) of free disk space
10MB of RAM (memory)
PC Only: 1 available COMM port (port used for connecting a serial device)
Mac Only: Serial port to USB converter
Serial to USB adapter
I N S TA L L AT I O N
• Copy the contents of the CD to your Applications Folder
• Make a copy of the folder ‘Uploads’ and put it on your desktop
• Make sure your serial to USB adapter is installed and working
EPAS 9
Environmental Devices Corporation
EPAS
Features
Each EPAS system is manufactured according to the customer’s sensor specifications. Although individual systems may have different numbers of sensors attached, the
software is self-configuring and determines which sensors are connected at any given time.
‘Plug and Play’, there is very little you need to know about the data logger in terms
of its operation. You won’t have to set up the sensors on any specific channels or provide
any technical data about the sensors. The logger is self-configuring and all relevant calibration data and other technical specifications are stored in battery-backed memory before
each unit is shipped. Turning the system on and off has no effect on this data stored in
memory; however, calibration settings are reset to factory settings when the machine is
powered off and on. Environmental Devices Corp. recommends annual factory calibration.
The EPAS has an exclusive self-zeroing feature and cycles on every 30 minutes.
You can tell when this is happening because the pump will sound different. The selfzeroing operation takes a little under one minute. During this clean air purge, the sensor
stores the last valid reading.
The PM sensor with has the capability to measure 1.0 micron 4.0 micron, 2.5 micron
or 10 micron particle sizes.
TIP: If you want to collect data in more than one location, make sure you either upload the
data in between or leave data logging on. If you stop logging you must upload the data before continuing.
Operation
Always select you location carefully. Setup the system and make sure it is secure.
Before you start to log data the system is sampling every ten seconds. This can be useful
to help you find a good location for data collection.
EPAS 10
Environmental Devices Corporation
1. Make sure the main power is on.
2. Status Lights:
• Sampling: blinks as the EPAS takes samples - if it is not blinking something is
wrong. It blinks every 6-10 seconds when not logging and less frequently when
logging.
• Disk: blinks as it writes to the disk.
• Logging: is on when you are datalogging. Always upload data before you start a
new logging session. Turning logging ON will erase all previous data.
• Power: is on when the system is powered.
3. The scroll buttons(3): scroll up or down to view the current sensor data. If you hold
one of the scroll buttons down for 5 seconds the display will loop through all the
sensors until you push it again.
4. Pushing the function button gives you commands that you can have the EPAS execute. (Log ON, Log OFF, Wind Status, Alarm Reset, Alarm Status) Push the scroll
button (3) to view each option.
5. Enter: Push this to execute the command selected.
EPAS 11
Environmental Devices Corporation
D ATA L O G G I N G O N
1.
2.
3.
4.
5.
6.
7.
8.
9.
10.
11.
Upload data from the EPAS if you have not done.
Starting logging will erase all old data.
Make sure all sensors are connected.
Push the ‘Function’ button and scroll to the ‘Wind Status’ function. 1 is on and ‘0’ is
off. If the sensors are not connected make sure this is off.
Turn system on 20 - 30 before starting your session.
Scroll through the display and verify that the values look reasonable.
Push the ‘Function’ button.
If needed use the scroll buttons to select function ‘LOG on’.
Push the ‘Enter’ button.
Scroll down the screen that reads record count. It should update after 1 minute.
DO NOT DISCONNECT or CONNECT any sensors after starting datalogging.
D ATA L O G G I N G O F F
1.
2.
3.
4.
5.
If you are done logging. Before moving the system or disconnecting any sensors.
Push the ‘Function’ button.
If needed use the scroll buttons to select function ‘LOG on’.
Push the ‘Enter’ button.
DO NOT STOP LOGGING if you cannot upload data before you start another session.
ALARMS
To set alarms:
1.
2.
3.
4.
5.
6.
7.
Connect with the HazScanner software.
Push ‘Set Alarms’.
Enter High limits for any sensor you want to trigger the alarm. (No. 1)
Push ‘Turn Logger Alarms On’. (No. 2)
Push ‘Set All Logger Alarms’. ( No. 3)
See the Alarm section of the Software chapter for more details.
DO NOT TURN THE SYSTEM OFF after setting the limits/alarms.
EPAS 12
Environmental Devices Corporation
8. On logger using the function key, you can scroll and set ‘Alarm Reset’ which if the
alarm has been triggered will turn it off. (if the condition returns it will go off again).
You can also set ‘Alarm Status’ from 1 which is on to 0 which is off. This will turn all
logger alarm functions in the logger off or on.
9. The logger alarm will turn off after 30 minutes to conserve power. Use ‘Alarm
Status’ to reset.
P OW E R C O N S I D E R AT I O N
Charge Battery for 24 Hours. The average battery power run time is 20 hours depending on concentration and alarm conditions. The EPAS shuts off automatically when the
internal battery voltage level falls below a preset value, data collection will cease in order to
preserve data integrity. Data already collected will be saved. If this happens, you will need
to connect the battery charger before retrieving the collected data. Furthermore, if you try to
turn the system on and the main battery is below ~9.6 volts, the system will not turn on
fully. Connect the charger immediately. When the external battery pack is plugged into the
system the data collection time is quadrupled. Recharge this battery when not in use.
P A RT I C U L AT E S E N S O R
The PM sensor with the HazScanner has the capability to measure 1.0 micron 4.0 micron 2.5 micron or 10 micron particle sizes. You will find a small cylindrical piece in the
Haz-Scanner case. These are called impactors. You can change the particle detection size by
physically replacing the PM impactor . The PM10 impactor will detect a wider range of particle sizes than the PM2.5 impactor, or PM-4.0 impactor. Impactor sizes are labeled on the
bottom of the Impactor.
Occasionally, you should remove and grease the impactor. The impactor is located
inside the Impactor sleeve . Remove Impactor by pushing up with pencil. Use just a small
amount of Impactor grease. (P/N IG-105) Remove any excess before placing the impactor
back into the sensor.
EPAS 13
Environmental Devices Corporation
C A L I B R AT I O N
To calibrate the sensors:
• Turn logger pump off.
• Remove brass screw and put calibration barb in. Connect zero air or cal gas.
• Ozone sensor is located on the right side above the connectors.
• Connect to the HazScanner when not data logging.
• Create a New Header.
• Go to the ViewLoggerSensorOne layout.
• Use the button next to the sensor to zero (1) or Span (2).
• Always zero or set low point first.
• When you select ‘Span’ a sensor you can set the 'Low point' or 'High point' for calibration. (figure 1 #1) When you select the low point, the sensor spans are adjusted to keep
the slope of the calibration curve the same. When you set the high point, the slope is
readjusted to the new reference. Always set the low point first when doing a full calibration.
• Wait 5 minutes or more until the sensor value stabilizes (3).
• Enter the value of your calibration gas in the dialog field (figure 2 #1) . Push set span.
• The current sensor value will appear in the current field (3). It can take 30 seconds for
the the sensor to stabilize.
• Do not turn the system off, it will reset to factory spans.
• To make your new span permanent reprogram logger and select the new span options.
figure 1
EPAS figure 2
14
Environmental Devices Corporation
REPROGRAM LOGGER
From the Advanced layout select ‘Reprogram HazScanner’. This will make any calibration
spans that you have made permanent. It cannot be undone. (see Advanced chapter below)
SOFTWARE
From the Main Screen you can either connect to the HazScanner or View Old Data,
which views,generates and print reports. While connected you should not open old
data. See chapter Quick Start Sheet for installation of the software (pg. 23).
CONNECTING TO HazScanner
To connect:
1. Turn the EPAS on and connect the serial cable or USB to serial adapter to the RS-232
port on the left side panel of the EPAS.
2. Your USB to serial adapter needs to be connected before starting your software.
3. Make sure the correct Port is selected on the Preferences Screen.
4. Connect the HazScanner to your computer.
5. Press the Connect button
6. You will be asked if want to use the the “current Header” or “create a new header”.
(the first time through you have to create a new header)
7. A new header should be created if you have turned logging off since the last upload.
(Otherwise the data in the file will not have a time gap) If you are not logging and
there is no new data in the HazScanner you can use old header or you want to append the new data to the last upload. Under the view data section you will be told
how to make reports from multiple headers.
8. Once connected there are three main functions: Upload Data, View Current Data
(which includes setting and receiving alarms, and zeroing sensors), and Advanced.
EPAS 15
Environmental Devices Corporation
U P L OA D D ATA
1.Push the Upload Data button
2.Review and finish filling out the Header Data.
3.It is important to fill out the header info so you can recognize and find the data later.
4.Push the blue Continue button.
V I E W C U R R E N T D ATA
Push the View Current Data button
If you are currently datalogging this will upload existing data. If you have a lot of
data in the HazScanner, Upload the data before viewing.
This screen will display the current values, average and maximum. You can set and
view limits here by typing into the Hi Limit or Lo Limit fields. The background of a sensor
will turn red if it has exceeded a High Limit limit. It will stay red even if the value goes
down until you press the Alarm Reset button.
If you click on an individual sensor it will take you to a screen that will a more detailed data summary and graph of that sensor. The information displayed here is all the
data for the current header only.
EPAS 16
Environmental Devices Corporation
If you are not logging on this screen you can Zero or Span a sensor by selecting the
button. If you are setting both a zero and a span. Do the zero first then the span. The zero
function does not change the slope of the input/output ratio. The Span does. Use zero gas
to zero sensors. After setting the zeroes and spans do not turn the system off. It will reset to
factory settings. DO NOT DO UNLESS YOU ARE SURE. (see calibration chapter)
The
print button here is more designed for the report but you can print the current
group (the button prints ALL sensors). To print an individual sensor from the layout menu
go to the LoggerSensorsViewPrint layout first and then select print from the menu and choose
‘Current record’ to print just 1 graph.
ALARMS
There are 2 types of alarms. They are both based on the Hi limit or Lo limit fields on
the View Sensor screens. The software alarm; if a limit is set and exceeded the background
color of the sensor changes from blue to red. It remains red until you push the ‘Reset Alarm’
button on that sensor and it creates a line in the Sensor Alarm list at the top of the screen.
Adding or changing a limit here does not send it to the logger. You must go to the ‘Set
Alarm’ screen and send the new limit(s) to the logger.
Logger Alarm. If you want to set the alarms in the logger:
1.
2.
3.
4.
Push the ‘Set Alarm’ button.
Push Button 4: ‘Clear all limits’ and enter what you want the new limits to be.
Review the limits and change any that need to be changed.
Button 3: ‘Set All Logger Alarms’ will reset all the limits in the logger to reflect the
limits here. Button 5: ‘Set Logger Alarm’ will just set the limit for the selected sensor.
5. Button 1: Turns the master switch either on or off. Off will disable the logger alarm.
6. Button 2: ‘Clear Logger Alarm’ will turn off the current alarm in the logger. but still
If another instance occurs the alarm will go off. If could happen right away.
EPAS 17
Environmental Devices Corporation
A D VA N C E D
Use the screen to troubleshoot the system with Tech support. It is used to directly
send commands to the HazScanner.
If you have zeroed or set new spans on your sensors. 'Reprogram HazScanner' this
will overwrite the factory setting and make it possible to turn the system off and have the
new spans. If the spans in the Span List are the same as the beginning of the Program then
the system is up to date. It is best to not use this and reset the zeros and spans before starting a new session and leaving the factory settings for the default.
VIEWING DATA
V I E W U P L OA D E D D ATA
Disconnect, if you are connected to the HazScanner
Option 1: (Best choice)
• Push the View Old Data button
• This will take you to a list of Headers (all data is associated with a header)
• Press Select next to the data you want to view and create reports.
• Press View Header to view or edit the header. This is the text that will export with the
data and print with a report. You can edit it here. The sensor table sometimes needs
tabs added or deleted to make things line up. To delete place cursor to the right of the
tab and delete. To add a tab, you need to hold down the ‘Alt’ key and then push tab.
(Just a tab takes you to the field)
EPAS 18
Environmental Devices Corporation
Option 2:
• Select Data from the menu at the top
• Push the Find icon.
• You can then enter dates 1/1/2001..3/1/2001
• You can enter a known header #
• You can them Perform Find, Constrain Found Set, or Extend Found Set.
• If you enter data in 2 fields when you do a find it acts as an “and” statement.
• entering 1/1/2001..3/1/2001 in the date field and 63 in the header field will only find
records from header 63 during that time period.
• You can use the New Request button and the find will act as a “or” find
• you enter 1/1/2001..3/1/2001 in the date field
• Push the New Request button and add 63 in the header field and the find will include
all records either during 1/1/2001..3/1/2001 OR made with header 63
• Finds can be useful to group multiple uploads together for 1 report but usually option
1 will give all the data from 1 dataset.
From the Data window you can push the Export Data button, this will export a tab delimited
data file with a full header. You can print this or import the data into Excel (delimited data
option) and start on the row with the sensor names.
EPAS 19
Environmental Devices Corporation
REPORTS
• Select Report from the menu bar.
• You can select an Average period for your report from the drop down list in the Report
Ave field.
• Then Push one of the buttons Sort, Daily Report, Average Report.
• The Less Detail will now show the summary detail.
• Export Data does the same thing as in the Data window.
• Export Ave will export the summary based on the Report Ave period. If you want to
export a daily average select 24 hours for your average period.
The Sensor Report button (on the More Detail layout) will take you to a graphic report with a
graph of each sensor with min, max and other information all based on the original data.
This will not change by changing the average period. You can add limits here and leave the
report and return to generate a report that gives % above high limits and below low limits.
EPAS 20
Environmental Devices Corporation
Navigation
1.
2.
3.
4.
5.
6.
Main Menu buttons. Use these whenever possible.
Action and navigation buttons
Blue “Continue” button gives time to input data before the software continues.
Zoom makes things fit better on your screen. Arrows take you from record to record.
The Layout Menu. A quick way to go to different views.
The status bar has different options. Number of records helps you know where you
are (Logger, Logger Sensors, or Data)
7. The Preview button show how things will look when printed.
Find
This is one of the most powerful features of a database. It is worth spending a little time
and learning how to find records you want. Multiple finds, constrained finds, extended finds
and special characters (Operators) are all features you should become comfortable with.
• Saved Finds. Your saved and recent finds are here. If you click and hold the arrow
on the find icon.
• Constrain Found Set. Performs the current Find in the current found set only. Removes them from the Found set
• Extend Found Set. Performs the current Find in the omitted records only. Adds
them to the Found set
• Add New Request. Creates an OR find, finding both ‘Allan’ and ‘David’.
• After performing a find, you use Omit Record to remove a single record from your
found set or ‘Show Omitted Only’ will switch you to the omitted records found set.
• When using the ‘Find’ tab on the summary screen. DO NOT select Find Mode. A
script does the find for you.
EPAS 21
Environmental Devices Corporation
TROUBLESHOOTING
H AV I N G
TROUBLE CONNECTING
1.Are both computer and Haz-Scanner system turned on?
2.Is the communications cable securely fastened to both devices?
3.Have you installed the necessary software if you are using a serial to USB adaptor on
either a Macintosh or a PC?
4.Did you have the USB to Serial plugged in before you started the software?
5.Have you tried restarting the Haz-Scanner and/or rebooted the computer?
6.Go to the Advanced screen and send ‘D’ and see if the date comes back.
C R E AT I N G
A REPORT
1.Make sure you are not connected to the logger.
2.Check the Header ID in the Header list layout and make sure there is data for it and
that it is correct header that you want to view. You can also do a find in the data window to find the dataset you want.
3.Make sure you have sorted the data using the ‘Sort’ button or the menu.
POWER OFF
If logging has stopped and the indicators are off, you have probably drained the battery
such that logging has been disabled. Place the power switch in the ‘Off’ position and immediately connect the charger to the system. Wait 45 minutes before trying to connect with
the charger connected.
EPAS 22
Environmental Devices Corporation
QUICK START SHEET
Start by collecting a small amount of data and then generating a report. If you are having
problems, please contact technical support personnel who will be happy to get you up to
speed. E-mail [email protected].
I N S T A L L S O F T WA R E
Step 1: Copy the contents of the CD to your Applications Folder
Step 2: Make a copy of the folder ‘Uploads’ and put it on your desktop
Step 3: Make sure your serial to USB adapter is installed and working
Note: Always make sure your USB to serial adapter is connected before launching the
HazScanner software. Otherwise the port will not be available.
START EPAS
Step 1: Battery must be fully charged. (LED=Green) and System turned on at least 15 minutes prior to use. Connect to battery charger if necessary
Step 2: To view sensor data on EPAS display, press up and down arrows to scroll through
sensor list. Scroll through and see if values are as expected. Restart or check connections if
needed.
Step 3: To view sensor data on EPAS display, press up and down arrows to scroll through
sensor list. Scroll through and see if values are as expected. Restart or check connections if
needed.
Step 4: To collect data, execute “logging on” function from display panel by pressing function button and then press enter button. This will erase all previous data. Upload old data if
wanted. Do not select “Log On” if you have data you want and have not uploaded.
Step 5: When done execute “logging off” function from display panel by pressing function
button and then enter button OR by computer using serial cable and HazComm software.
Step 6: To upload data connect to computer and using the HazComm software select “Upload Data”
Step 7: To generate graphs and reports by computer refer to Hazcomm manual.
Note: If you are connected to a computer and software use the commands from the software, DO NOT PUSH BUTTONS ON THE EPAS SCREEN.
EPAS 23
!"#$%&'(%)*+,-.,+/00"1+,..2
Environmental Devices Corporation
NER EPAS
!"#$%$&&'()*"#+),$)-.%'/$#",$-$#'0"#'1-.-"+)
SPECIFICATIONS
Performance Profile
EPAS O
The HAZ-SCANNER EPAS is optimized for ambient air quality
applications; custom calibration for specific ranges or applications
V E R V Iis E
W upon request. Build the station you need for your
available
application.
!*&+18
9*2+.8*7*&,:#1&'*&,82,61&$;2&<*
!"#$%&'("$)*++
,-!./+/)0*1#2
!"#$%&'("$)*+,-.+/01#"#)2+$
'!,-!#(.(((!/012+!-3!(4('!,-!#((!2012+
=6<3,$!'2,,*86&<
>28,6'/*$!6?*$;2&<*
(4'!,-!'((!/2
>28,6'/*$!6?*$$
'!/2.!#4*!/2.!-3!$4(!/2!5)3(%)*'$+6!
9*2+.8*7*&,
'(!/2!-3!789!50('*4'54+6
31("$%()+4#5"0%&+61781'09*+,346*2+++,-!./+/)0*1#2
>%@$ABC(D$*EF
(!,-!'((!::2!50('*4'54+6
6"#:10+;%1<%9)
,-!./+/)0*1#2
G@%;
(!,-!*(((!::2!5)3(%)*'$+6
=1<%&+>"*)*+,-()&$#1&?)7%&"(2++ ,-!./+/)0*1#*2
3453"#670+87079%2)
(!,-!'((!::2!5)3(%)*'$+6
#HIJ9*,32&*
(!,-!'((;!<-=4!5)3(%)*'$+6
:;2#7&"#670*
(!,-!*(!::2!5)3(%)*'$+6+031&%78+9'0+(831+:;1*+
)5415%*96
GKL5<%$#7=)0+>%79%2)
(!,-!*(((!::>!5(!,-!*!::26!5)3(%)*'$+6
KLJKMN<*&
(!,-!*(;!<-=4!5)3(%)*'$+6
KOJK?1&*
(!,-!'(((!::>!5(!,-!'!::26!5)3(%)*'$+6
!KL5?'(1'#+>%79%2)
(!,-!*(((!::>!5(!,-!*!::26!5)3(%)*'$+6
4$?)#+!"#"7)$)#*
,-!./+@)$)#*2
;26&$-2.<*$$
(!,-!*!?@ABCD!5)3(%)*'$+6
@A)"$)2B+$%CC%0=+6'&D)$E
F)GC)#"$'#)
%$!,-!'$(!E!5%#(!,-!F(!G6!50('*4'54+6
H)("$%I)+:'G%2%$;+@H:E
(!,-!'((;!50('*4'54+6
?7("#+/##"2%"0&)
(!,-!'''!HI,,D!:C3!DJKI3C!2C,C3!5H12#6!5)3(%)*'$+6
?7'02+"02+<7%*)
+(!,-!'+*!LCA?>C=D!5LM6!5)3(%)*'$+6
J$7G%&+H"2%"$%70
'!,-!'&.&&&!A-K@,D!:C3!2?@K,C!5A:26!-3!(4(('!,-!!
'((!2?=?NIL1B3!5)3(%)*'$+6
KLM+H"2%"$%70
'!,-!#((!2?==?0IKDD!52O6!5)3(%)*'$+6
N%02+?C))2O>%#)&$%70
(!,-!'#*!2:B1*!,-!+**!LC03CCD!50('*4'54+6
P2817*,86'$>8*++.8*
#)!,-!+'!?@ABCD!P0!5)3(%)*'$+6
>)P+!7%0$+F)GC)#"$'#)
%$"4#!,-!'##!E!5%$$!,-!*(!G6
N)$+Q'(6+F)GC)#"$'#)
+4#!,-!'##E!5%'F!,-!*(!G6!5)3(%)*'$6)*1+<1(15+6
BCD+C!>@+0;):*+:%(;+)3(%)*'$+0)$'5+3'*1$0
ation
ER EPAS wireless environmental perimeter air
em. Contact SKC to build your own station.
$,.*$0)(1-.$234&5/
*+$+'$+1.$!"#$2343+.($5-&&-6+7$-6($8.+)&6$9':3*7;$
':.$:3-/3:3+7$-6($+1.$/)7.&>,$.?*:),3=.$&.4.(7@$A'$
2343+.($5-&&-6+7$-6($8.+)&6$9':3*7;$B'$+'$1++%CDD
6+7@-,%@
:JR5?3J<<KH+K!J?+/0*$#'G)0$+?C)&%S&"$%70*
>%*C(";
QGR!3CI=!,?2C
4C)#"$%70
$%SCT!D:=IDB%:3--U!2C2>3I@C!DH?,AB
>14*8
'#%<!V?WP!>I,,C3T
4C)#"$%0=+F%G)
'(!B3D!5D,I@LI3L!>I,,C3T6.!A-@,?@K-KD!5XG6.!!
-:,?-@I=!D-=I3!:I@C=D
>%*C(";+8)"*'#)G)0$*
WIY.!W?@.!7ZX.!87[Q
H)&7#2%0=+F%G)
'!DCA!,-!#'!HCCSD
?"GC(%0=+H"$)
'!DCA.!'!2?@.!'(!2?@.!'!B3.!IL\KD,I>=C
@2,2$!,182<*
+F.(((!LI,I!:-?@,D
?"GC(%0=+!'GC
'4(!,-!+4(!Q12?@
>%=%$"(+4'$C'$
N8%#+#!59G6.!N8%$#+!5WIA6
!10,428*
9G!-3!WIA?@,-DB
@67*&+61&+$$
F!Y!'$!Y!'(!?@!5'*4#!Y!+*4F!Y!#*4$!A26
@P)"$A)#5C#771+&"*)E
)*6<3,
'#!=>D!5*4$!S06
4C)#"$%0=+F)GC)#"$'#)
%$!,-!'$(!E!5%#(!,-!F(!G6
?$7#"=)+F)GC)#"$'#)
%$(!,-!'$(!E!5%$(!,-!F(!G6
:'G%2%$;
&*;!@-@%A-@LC@D?@0!5KDC!?@=C,!BCI,C36
N%#)()**+H"2%7+872)G
&((!WP]!5^4846.!)F)!WP]!5[K3-6!K:!,-!!
'(!W?=CD!5)3(%)*'$+6
J'9%(%"#;+J0"(7=+/0C'$
(!,-!#4*!<RG!5'!ABI@@C=!U-3!I=,C3@I,?_C!2C,C36
!"#$%&'(!"#$%&$'%&"('!!!!!!!"#$)*+,!"'$%&&#%#")(!!!!!!!"#$-./0$#12+,!#)'%)*&%)(*(!!!!!!!"#$!1.,3!$+$%+*#%"'$&
444(+5'6&'('17
EPAS 24
&&6078+.7'9&1:07.;.7'3.*+
Environmental Devices Corporation
All dimensions in millimetres (± 0.1 mm)
Top View
Bottom View
Side View
C A R B O N M(AOthree
NO
I D Eis available
( CO)on request, coded CO-DF)
pinX
version
PERFORMANCE Sensitivity
Response time
Zero current
Resolution
Range
Linearity
Overgas limit
nA/ppm in 400ppm CO
30 to 48
< 25
t90 (s) from zero to 400ppm CO % 22°C
ppm equivalent in zero air
<±3
RMS noise (ppm equivalent)
< 1.5
ppm limit of performance warranty
1,000
ppm CO error at full scale, linear at zero and 400ppm CO
± 40
maximum ppm for stable response to gas pulse
2,000
LIFETIME
ppm equivalent change/year in lab air
% change/year in lab air, monthly test
months until 80% original signal (24 month warranted)
Zero drift
Sensitivity drift
Operating life
ENVIRONMENTAL Sensitivity @ -20°C % (output @ -20°C/output @ 20°C) @ 400ppm CO
Sensitivity @ 50°C % (output @ 50°C/output @ 20°C) @ 400ppm CO
Zero @ -20°C
ppm equivalent change from20°C
Zero @ 50°C
ppm equivalent change from 20°C
CROSS
SENSITIVITY
Filter capacity
H2S sensitivity
NO2 sensitivity
Cl2 sensitivity
NO sensitivity
SO2 sensitivity
sensitivity
H2
C2H4 sensitivity
NH3 sensitivity
KEY
Temperature range
SPECIFICATIONS Pressure range
Humidity range
Storage period
Load resistor
Weight
ppm·hrs
% measured gas @ 20ppm
% measured gas @ 10ppm
% measured gas @ 10ppm
% measured gas @ 50ppm
% measured gas @ 20ppm
% measured gas @ 400ppm
% measured gas @ 400ppm
% measured gas @ 20ppm
H2S
H2 S
NO2
Cl2
NO
SO2
H2
C2 H 4
NH3
OC
kPa
%rh (see note below)
months @ 3 to 20OC (stored in sealed pot)
Ω (recommended)
g
< 0.5
<6
> 24
55 to 80
105 to 115
<±3
<±4
20,000
< 0.1
< 0.1
< 0.1
< 50
< 0.1
< 70
< 100
< 0.1
-20 to 50
80 to 120
15 to 90
6
10 to 47
<2
Note: Above 85% rh and 40OC a maximum continuous exposure period of 10 days is warranted. Where such exposure occurs the
sensor will recover normal electrolyte volumes when allowed to rest at lower %rh and temperature levels for several days.
At the end of the product’s life, do not dispose of any electronic sensor, component or instrument in the domestic
waste, but contact the instrument manufacturer, Alphasense or its distributor for disposal instructions.
NOTE: all sensors are tested at ambient environmental conditions, with 10 ohm load resistor, unless otherwise stated. As applications of use are outside our control,
the information provided is given without legal responsibility. Customers should test under their own conditions, to ensure that the sensors are suitable for their own
requirements.
Alphasense Ltd, Sensor Technology House, 300 Avenue West, Skyline 120, Great Notley. CM77 7AA. UK
Telephone: +44 (0) 1376 556 700 Fax: +44 (0) 1376 335 899 E-mail: [email protected] Website: www.alphasense.com
EPAS 25
Environmental Devices Corporation
C A R B O N D I O X I D E ( CO2)
EPAS 26
&&6-*7/'*38&.9-*':'*3('1
Environmental Devices Corporation
All dimensions in millimetres (± 0.1mm)
N I T R I C Top
O View
X I D E ( NO)
Bottom View
Side View
PERFORMANCE Sensitivity
Response time
Zero current
Resolution
Range
Linearity
Overgas limit
nA/ppm in 40ppm NO
t90 (s) from zero to 40ppm NO
ppm equivalent in zero air
RMS noise (ppm equivalent)
ppm limit of performance warranty
ppm error at full scale, linear at zero and 40ppm NO
maximum ppm for stable response to gas pulse
500 to 750
< 10
0 to 1
< 0.1
100
< ± 1.5
200
LIFETIME
ppm equivalent change/year in lab air
% change/month in lab air, monthly test
months until 80% original signal (24 month warranted)
< 0.4
<5
> 24
Zero drift
Sensitivity drift
Operating life
ENVIRONMENTAL Sensitivity @ -20°C % (output @ -20°C/output @ 20°C) 40ppm NO
Sensitivity @ 50°C % (output @ 50°C/output @ 20°C) 40ppm NO
Zero @ -20°C
ppm equivalent change from 20°C
Zero @ 50°C
ppm equivalent change from 20°C
CROSS
SENSITIVITY
H2S
NO2
Cl2
SO2
CO
H2
C2H4
NH3
CO2
sensitivity
sensitivity
sensitivity
sensitivity
sensitivity
sensitivity
sensitivity
sensitivity
sensitivity
KEY
Temperature range
SPECIFICATIONS Pressure range
Humidity range
Storage period
Bias voltage
Load resistor
Weight
65 to 85
102 to 115
< ± 0.5
3 to 6
% measured gas @ 20ppm H2S
% measured gas @ 10ppm NO2
% measured gas @ 10ppm Cl2
% measured gas @ 10ppm SO2
% measured gas @ 400ppm CO
% measured gas @ 400ppm H2
% measured gas @ 1000ppm C2H4
% measured gas @ 20ppm NH3
% measured gas @ 5%
CO2
OC
kPa
%rh (see note below)
months @ 3 to 20OC (stored in sealed pot)
mV (working electrode above ground)
Ω (for optimum performance)
g
< 30
<5
<5
<3
< 0.1
< 0.1
< 0.1
< 0.1
< 0.1
-20 to 50
80 to 120
15 to 90
6
300mV
10 to 47
<2
At the end of the product’s life, do not dispose of any electronic sensor, component or instrument in the domestic waste, but contact
the instrument manufacturer, Alphasense or its distributor for disposal instructions.
NOTE: all sensors are tested at ambient environmental conditions, with 10 ohm load resistor, unless otherwise stated. As applications of use are outside our control, the information
provided is given without legal responsibility. Customers should test under their own conditions, to ensure that the sensors are suitable for their own requirements.
Alphasense Ltd, Sensor Technology House, 300 Avenue West, Skyline 120, Great Notley. CM77 7AA. UK
Telephone: +44 (0) 1376 556 700 Fax: +44 (0) 1376 335 899 E-mail: [email protected] Website: www.alphasense.com
EPAS 27
''7-89.(84:'1;-8(<(84)(+
Environmental Devices Corporation
in millimetres (±0.1)
N I T R O G E N D I O X AllI dimensions
D E ( NO2)
Top View
Bottom View
Side View
PERFORMANCE Sensitivity
Response time
Zero current
Resolution
Range
Linearity
Overgas limit
nA/ppm in 10ppm NO2
-200 to -400
t90 (s) from zero to 10ppm NO2
< 25
ppm equivalent in zero air
± 0.35
RMS noise (ppm equivalent)
0.1
20
ppm NO2 limit of performance warranty
ppm error at full scale, linear at zero and 10ppm NO2
0 to -0.6
maximum ppm for stable response to gas pulse
60
LIFETIME
ppm equivalent change/year in lab air
% change/month in lab air, twice monthly test
months until 80% original signal (24 month warranted)
Zero drift
Sensitivity drift
Operating life
ENVIRONMENTALSensitivity @ -20°C % (output @ -20°C/output @ 20°C) @ 10ppm
Sensitivity @ 50°C % (output @ 50°C/output @ 20°C) @ 10ppm
Zero @ -20°C
ppm equivalent change from 20°C
Zero @ 50°C
ppm equivalent change from 20°C
CROSS
SENSITIVITY
H2S
CL2
NO
SO2
CO
H2
C2H4
NH3
CO2
sensitivity % measured gas @ 20ppm
sensitivity % measured gas @ 10ppm
sensitivity % measured gas @ 50ppm
sensitivity % measured gas @ 20ppm
sensitivity % measured gas @ 400ppm
sensitivity % measured gas @ 400ppm
sensitivity % measured gas @ 400ppm
sensitivity % measured gas @ 20ppm
sensitivity % measured gas @
10%
KEY
Temperature range
SPECIFICATIONS Pressure range
Humidity range
Storage period
Load resistor
Weight
nd
nd
> 24
80 to 95
95 to 105
<± 0.6
<± 0.5
H2S
CL2
NO
SO2
CO
H2
C2 H 4
NH3
CO2
OC
kPa
%rh (see note below)
months @ 3 to 20OC (stored in sealed pot)
Ω (for optimum performance)
g
< -20
< 80
< 0.5
<1
< 0.1
< 0.1
<0.1
< 0.1
<0.1
-20 to 50
80 to 120
15 to 90
6
33
<2
Note: Above 85% rh and 40OC a maximum continuous exposure period of 10 days is warranted. Where such exposure occurs the sensor will recover
normal electrolyte volumes when allowed to rest at lower %rh and temperature levels for several days.
At the end of the product’s life, do not dispose of any electronic sensor, component or instrument in the domestic waste, but
contact the instrument manufacturer, Alphasense or its distributor for disposal instructions.
NOTE: all sensors tested and stored at ambient environments unless otherwise stated. As applications of use are outside our control, the information provided is given
without legal responsibility. Customers should test under their own conditions, to ensure that the sensors are suitable for their own requirements.
Alphasense Ltd, Sensor Technology House, 300 Avenue West, Skyline 120, Great Notley. CM77 7AA. UK
Telephone: +44 (0) 1376 556 700 Fax: +44 (0) 1376 335 899 E-mail: [email protected] Website: www.alphasense.com
EPAS 28
Environmental Devices Corporation
OZONE (O3)
EPAS 29
Environmental Devices Corporation
P A RT I C U L AT E S
• Operation: Four key splash proof membrane switch – menu driven
• Calibration: Gravimetric reference NIST Traceable - SAE fine test dust-ISO12103-1
Accuracy: ± 10% to filter gravimetric SAE fine test dust
• Sensing range: .001-20.0 mg/m3 or optional .01-200.0 mg/m3 or .1-2000.0 mg/m3
• Particle size range: .1 – 100μm
• Precision: ± .003 mg/m3 (3µg/m3)
• Sampling flow rate: 2.0 liters/minute
• Analog output: 0-2 vdc
• Power: Rechargeable and interchangeable battery
• Operating temperature: -10°C to 50°C
• Storage temperature: -20°C to 70°C
• Humidity: 95% non-condensing
!"#$%&'()*+*",-.,/012/,*034*5,60178,*!2-74719*#:426,*
*
;(;<"5=<>(*<!>5><";5=?"=<?**
R>"4?;'@,A*B5?'BC8A*D
E L A T I V EE$#!*FGH355*9IJ3K0L53*5I4I3CM*
HUMIDITY
(
!2-74719*<H0/0I1,/7G17IG*
!F2LCLI:*#345FKLGT*D4GT3*
D3H4ILW3*!F2LCLI:*N88FK48:*>$-*I9*P'Q*D!M*
YF77H:*B9HI4T3**
[92LG4H*\FI7FI*]''QD!*>4I*'BC8M*
,FKK3GI*,9G5F27IL9G*
"3273K4IFK3*,93OOL8L3GI*>$-*I9*'-@,M*
NW3K4T3*Y3G5LILWLI:*OK92*&&Q*I9*%'QD!*
YLG`*,FKK3GI*,474VLHLI:*>D(*?*&&`!M*
D389W3K:*"L23*4OI3K*$'-*J9FK5*9O*89GC3G54IL9G*
!F2LCLI:*!:5I3K35L5*
!F2LCLI:*D359HFIL9G*
(9GT*"3K2*YI4VLHLI:*
>$M
"L23*,9G5I4GI*>4I*_&Q*9O*5LTG4HA*5I4IL8M*&&Q*I9*%'QD!* *
\FI7FI*^273C4G83*
c4K2*d7*"L23*
>$M*
?9-J:6*
D!*
D!*
B5*
B9FI*
^8*
"88*
"B9FI="D!*
^*
IK*
*
*
"*
"*
b*
Ic*
#73*
-*
*
Z1%'*
;1Z;*
*
*
*
*
*
*
*
*
*
*
*
"9.*
*
X=6&*
'1--*
;1Z<*
;1<*
6-1-'*
X;_*
*
$-*
X=6$*
-1Z*
X=6-1'*
'*
%-*
;--*
#0K*
$--*
X=6'*
'1;'*
;1'Z*
Z*
6-1$*
*
$'-*
*
*
*
*
$-*
*
*
D371*
QD!*
QD!*
BC8*
B*
2N*
QD!=@,*
2B=QD!*
aN*
5*
QD!*
QD!*
QD!=:K*
5*
!*
25*
#73*
*
&_--*
6&-*
*
*
*
"9.*
$-*
&%&-*
*
;*
&*
$-*
#0K*
*
&<--*
<-*
&*
*
*
D371*
`!*
*
@,*
Q*
Q*
5*
NI*;2=5*4LK*OH90*
>"4?;'@,M*
",-.,/012/,*<H0/0I1,/7G17IG*
[92LG4H*D35L5I4G83*];'@,*
e3I4*W4HF3f*e;'=$--*
"3273K4IFK3*#345FKLGT*D4GT3*
[92LG4H*D35L5I4G83*"9H3K4G83*];'@,*
e3I4*B4HF3*"9H3K4G83*
D3579G53*"L23*
?9-J:6*
D*
#*
"4*
D[*
#*
"*
*
"@A=<>(*A;5)B5#>C<;*<D5E;?*
!D#=F="@*?;C?B5*
*
!* #,0G2/,-,31*<:34717:3G*
EPAS
*
*
!"#$%&'()*
L5*
5738LOL3C*
O9K*
2345FK323GI5*0LIJLG*$-*I9*P'*QD!1*
30
488FK4I3*
!!"#$%&'$()!*+#$','$(-'
Environmental Devices Corporation
All dimensions in millimetres (± 0.1mm)
S U L F U R Top
D IView
O X I D E ( SO2)Bottom View
Side View
PERFORMANCE Sensitivity
Response time
Zero current
Resolution
Range
Linearity
Overgas limit
nA/ppm in 10ppm SO2
t90 (s) from zero to 10ppm SO2
ppm equivalent in zero air
RMS noise (ppm equivalent)
ppm limit of performance warranty
ppm error at full scale, linear at zero and 10ppm
maximum ppm for stable response to gas pulse
LIFETIME
ppm equivalent change/year in lab air
% change/year in lab air, monthly test
months until 80% original signal (24 month warranted)
Zero drift
Sensitivity drift
Operating life
ENVIRONMENTAL Sensitivity @ -20°C % (output @ -20°C/output @ 20°C) 10ppm
Sensitivity @ 50°C % (output @ 50°C/output @ 20°C) 10ppm
Zero @ -20°C
ppm equivalent change from 20°C
!"#$%&'()*+*",-.,/012/,*034*5,60178,*!2-74719*#:426,*
Zero @ 50°C
ppm equivalent change from 20°C
*
% measured gas @ 20ppm
CROSS
H2S sensitivity
;(;<"5=<>(*<!>5><";5=?"=<?**
% measured gas @ 10ppm
SENSITIVITY
NO2 sensitivity
sensitivity
% measured gas @ 10ppm
Cl2
>"4?;'@,A*B5?'BC8A*D(E$#!*FGH355*9IJ3K0L53*5I4I3CM*
NO sensitivity
% measured gas @ 50ppm
!2-74719*<H0/0I1,/7G17IG*
?9-J:6*
CO sensitivity
% measured gas @ 400ppm
!F2LCLI:*#345FKLGT*D4GT3*
D!*
sensitivity
% measured gas @ 400ppm
H2
D3H4ILW3*!F2LCLI:*N88FK48:*>$-*I9*P'Q*D!M*
D!*
% measured gas @ 400ppm
C2H4 sensitivity
YF77H:*B9HI4T3**
B5*
% measured gas @ 20ppm
NH3 sensitivity
[92LG4H*\FI7FI*]''QD!*>4I*'BC8M*
B9FI*
% measured gas @ 10%
CO2 sensitivity
180 to 350
<12
<± 0.2
<0.2
20
<5
50
<0.2
<6
>24
72 to 88
74 to 90
<± 1
<- 0.5 to 1.5
H2 S
NO2
Cl2
NO
#73*
CO -*
H2 *
C2Z1%'*
H4
NH;1Z;*
3
CO2
<-350
<-100
<-100
<1
D371*
<-0.2
QD!*
<1
QD!*
<3
BC8*
<0.1
B*
<0.1
"9.*
#0K*
*
$--*
X=6&*
X=6'*
'1--*
'1;'*
;1Z<*
;1'Z*
,FKK3GI*,9G5F27IL9G*
^8*
*
;1<*
Z*
2N*
"3273K4IFK3*,93OOL8L3GI*>$-*I9*'-@,M*
"88*
*
6-1-'*
6-1$*
QD!=@,*
-20 to 50
KEY
Temperature range OC
NW3K4T3*Y3G5LILWLI:*OK92*&&Q*I9*%'QD!*
"B9FI="D!*
*
X;_*
*
2B=QD!*
SPECIFICATIONS Pressure range
kPa
80 to 120
YLG`*,FKK3GI*,474VLHLI:*>D(*?*&&`!M*
^*
*
*
$'-*
aN*
Humidity range
%rh (see note below)
15 to 90
D389W3K:*"L23*4OI3K*$'-*J9FK5*9O*89GC3G54IL9G*
IK*
*
$-*
*
5*
6
Storage period
months @ 3 to 20OC (stored in sealed pot)
!F2LCLI:*!:5I3K35L5*
*
*
X=6$*
*
QD!*
Load resistor
Ω (for optimum performance)
22
!F2LCLI:*D359HFIL9G*
*
*
-1Z*
*
QD!*
Weight
g
<2
(9GT*"3K2*YI4VLHLI:*
"*
*
X=6-1'*
*
QD!=:K*
>$M
"L23*,9G5I4GI*>4I*_&Q*9O*5LTG4HA*5I4IL8M*&&Q*I9*%'QD!* *
*
'*
$-*
5*
"*
\FI7FI*^273C4G83*
b*
*
%-*
*
!*
At the end of the product’s life, do not dispose of any electronic sensor, component or instrument in the domestic waste, but contact
the instrument manufacturer, Alphasense or its distributor for disposal instructions.
c4K2*d7*"L23*
Ic*
*
;--*
*
25*
T E M P NI*;2=5*4LK*OH90*
E R AT U R E
>$M*
>"4?;'@,M*
NOTE:
all sensors are tested at ambient environmental conditions, with 10 ohm load resistor, unless otherwise stated. As applications of use are outside our control,
the information provided is given without legal responsibility. Customers should test under their own conditions, to ensure that the sensors are suitable for their own
",-.,/012/,*<H0/0I1,/7G17IG*
?9-J:6*
#73*
"9.*
#0K*
D371*
requirements.
[92LG4H*D35L5I4G83*];'@,*
D*
*
$-*
*
Alphasense Ltd, Sensor Technology House, 300 Avenue West, Skyline 120, Great Notley. CM77 7AA. UK
e3I4*W4HF3f*e;'=$--*
#*
&_--*
&%&-*
&<--*
Telephone: +44 (0) 1376 556 700 Fax: +44 (0) 1376 335 899 E-mail: [email protected] Website: www.alphasense.com
"3273K4IFK3*#345FKLGT*D4GT3*
"4*
6&-*
*
<-*
[92LG4H*D35L5I4G83*"9H3K4G83*];'@,*
D[*
*
;*
&*
e3I4*B4HF3*"9H3K4G83*
#*
*
&*
*
D3579G53*"L23*
*
$-*
*
"*
`!*
*
@,*
Q*
Q*
5*
*
"@A=<>(*A;5)B5#>C<;*<D5E;?*
!D#=F="@*?;C?B5*
*
!* #,0G2/,-,31*<:34717:3G*
*
*
!"#$%&'()*
L5*
5738LOL3C*
O9K*
488FK4I3*
EPAS
2345FK323GI5*0LIJLG*$-*I9*P'*QD!1*
*
RS8FK5L9G*9FI* 9O*IJL5*K4GT3*>U*$-Q*9K*E* P'Q*D!A*
LG8HFCLGT* 89GC3G54IL9GM* C935* G9I* 4OO38I* IJ3*
K3HL4VLHLI:*9O*!"#$%&'()*8J4K48I3KL5IL85*
31
Environmental Devices Corporation
VOC’S
EPAS 32
Environmental Devices Corporation
WIND DIRECTION
EPAS 33
Environmental Devices Corporation
WIND SPEED
EPAS 34
Environmental Devices Corporation
AIR VELOCITY
The Anemometer utilizes a rotary valve movement to measure both high and low air velocit
ies. The meter is capable of providing multi-functional air flow measurements. (see separate
operations manual) when connected via the signal cable to the HazScanner set meter to ft/
min scale to correspond with logger calibration and repeat results consistent with ASHRAE convention.
A T O M I C R A D I AT I O N
The atomic radiation sensor is a simple Geiger counter that responds to alpha,
beta and gamma radiation. Alpha radiation is easily blocked so care must be taken
that nothing comes between the air being measured and the mica detection window.
When an ionizing particle passes through the window, it is detected by a GeigerMueller (GM) tube, a cylindrical tube with a sealed gas and a thin central wire that is
held at a high voltage. When radiation interacts with the tube, it will produce an
energetic electron that is then counted. The output is the number of electrons
detected over a period of one minute.
ELF
Radiation in the 0 - 200 mG range. The ELF sensor utilizes a single-axis probe; before placing the probe at given location, the probe must be oriented along each axis, X, Y, and Z, to
determine the maximum reading and then left in that position for the duration of the logging session.
LIGHT INTENSITY
Utilizes a photodiode with color correction filter to measure Indoor Lighting. (see separate o
peration manual) when connected via the signal cable to the HazScanner set meter measure
ment scale to 1999 foot cable (fc) range to correspond with logger calibration and report res
ults consistent with ASHRAE convention.
SOUND
This sound level meter has been designed to meet the measurement requirements of Safety Engineers, Health, Industrial Safety Offices and Sound Quality Control in various environm
ents. This unit conforms to the IEC651 type2, ANSI S1.4 Type 2 for Sound Level Meters. Ran
ges from 30dB to 130dB at frequencies between 31.5Hz and 8KHz. Display with 0.1dB steps on a 4‐digit LCD. Two equivalent weighted sound pressure levels A and C.
EPAS 35
Environmental Devices Corporation
SAMPLE REPORTS
D ATA E X P O RT
ENVIRONMENTAL REPORT
Session location: Northeast
Session site: Medium Town
Organizational affiliation: EDC
Session environment: Outdoors
Session type: Ambient
Session environment:
Session Description: Test
Logger Serial Number: 201101
Logging began on: 1/28/2011 12:39:26 PM
Logging stopped on: 1/28/2011 4:13:37 PM
Data uploaded on: 1/28/2011 4:15:25 PM
Samples were averaged and saved every: 1 Minute
Report was averaged: 1 Hour
Total samples in this upload: 180
Memory remaining: 9776
SENSOR
UNITS
LO LIM
HI LIM
------------------------------------------------------------------------------------Carbon Dioxide
ppm
750
300
Carbon Monoxide
ppm
*
*
Nitrogen Dioxide
ppb
*
*
Nitric Oxide
ppb
*
*
Particulates
uG/m3
*
*
Relative Humidity
%
*
*
Temperature
Deg. F
*
*
VOCS
ppm
*
*
Supply Voltage
V
*
*
* indicates no limit was set
Data collected by: Allan
City: Plaistow
State: NH
Country: USA
Longitude: Deg. Min. W
Latitude: Deg. Min. N
Elevation:
Date
1/28/11
1/28/11
1/28/11
1/28/11
1/28/11
1/28/11
1/28/11
1/28/11
1/28/11
1/28/11
1/28/11
1/28/11
1/28/11
1/28/11
1/28/11
1/28/11
1/28/11
1/28/11
1/28/11
1/28/11
1/28/11
1/28/11
1/28/11
1/28/11
1/28/11
1/28/11
1/28/11
1/28/11
1/28/11
1/28/11
1/28/11
1/28/11
1/28/11
1/28/11
1/28/11
1/28/11
1/28/11
1/28/11
1/28/11
1/28/11
EPAS Time
CO2
12:39:26
12:40:26
12:41:26
12:42:26
12:43:26
12:44:26
12:45:26
12:46:26
12:47:26
12:48:26
12:49:26
12:50:27
12:51:26
12:52:26
12:53:26
12:54:26
12:55:26
12:56:26
12:57:26
12:58:26
12:59:26
13:00:27
13:01:27
13:02:26
13:03:27
13:04:26
13:05:26
13:07:26
13:08:27
13:09:26
13:10:26
13:11:26
13:12:26
13:13:27
13:14:26
13:15:26
13:16:27
13:18:26
13:19:26
13:20:26
CO
727
727
727
727
727
726
727
727
727
726
727
727
727
727
727
727
727
727
727
726
726
726
727
726
727
727
726
726
726
810
814
814
901
814
814
814
814
814
814
814
NO2
0
0
0
0
0
0
0
0
0
0
0
0
0
0
0
0
0
0
0
0
0
0
0
0
0
0
0
0
0
0
0
0
0
0
0
0
0
0
0
0
NO
0
0
0
0
0
0
0
0
0
0
0
0
0
0
0
0
0
0
0
0
0
0
0
0
0
0
0
0
0
0
0
0
0
0
0
0
0
0
0
0
Part
38.33
38.13
37.19
35.72
34.75
33.76
33.27
32.21
31.39
30.65
29.91
29.37
29
28.18
27.34
26.63
26.39
25.69
24.96
24.51
23.95
23.63
23.57
23.18
22.62
22.34
22.1
21.28
21.04
20.59
0
108.93
108.97
102.23
102.23
102.23
102.23
102.23
102.23
102.23
RH
21
14
13
25
20
19
19
20
15
20
21
22
20
25
27
22
24
31
24
24
29
31
22
26
25
24
25
24
24
24
11
12
7
10
12
7
10
9
11
9
Temp.
13
13
14
14
14
14
13
13
13
13
13
13
13
13
13
13
14
13
13
13
13
13
13
14
14
14
14
16
16
16
16
13
14
14
14
14
14
14
14
14
VOC
71.7
71.7
71.7
71.7
71.6
71.6
71.6
71.6
71.5
71.5
71.5
71.4
71.4
71.4
71.4
71.3
71.3
71.3
71.3
71.2
71.2
71.2
71.2
71.2
71.2
71.2
71.2
71.3
71.4
71.4
71.3
71.4
71.4
71.4
71.4
71.4
71.4
71.4
71.3
71.3
Pwr
0
0
0
0
0
0
0
0
0
0
0
0
0
0
0
0
0
0
0
0
0
0
0
0
0
0
0
0
0
0
0
0
0
0
0
0
0
0
0
0
12.3
12.3
12.2
12.2
12.2
12.2
12.2
12.2
12.2
12.2
12.2
12.2
12.2
12.2
12.2
12.2
12.2
12.2
12.2
12.2
12.2
12.2
12.2
12.1
12.1
12.1
12.1
12.1
12.1
12.1
12.1
12.1
12.1
12.1
12.1
12.1
12
12
12
12
36
Environmental Devices Corporation
1/28/11
1/28/11
1/28/11
1/28/11
1/28/11
1/28/11
1/28/11
1/28/11
1/28/11
1/28/11
1/28/11
1/28/11
1/28/11
1/28/11
1/28/11
1/28/11
1/28/11
1/28/11
1/28/11
1/28/11
1/28/11
1/28/11
1/28/11
1/28/11
1/28/11
1/28/11
1/28/11
1/28/11
1/28/11
1/28/11
1/28/11
1/28/11
1/28/11
1/28/11
1/28/11
1/28/11
1/28/11
1/28/11
1/28/11
1/28/11
1/28/11
1/28/11
1/28/11
1/28/11
1/28/11
1/28/11
1/28/11
1/28/11
1/28/11
1/28/11
1/28/11
1/28/11
1/28/11
1/28/11
1/28/11
1/28/11
1/28/11
1/28/11
1/28/11
1/28/11
1/28/11
1/28/11
1/28/11
1/28/11
1/28/11
1/28/11
1/28/11
1/28/11
1/28/11
1/28/11
1/28/11
1/28/11
1/28/11
1/28/11
1/28/11
1/28/11
1/28/11
1/28/11
1/28/11
1/28/11
1/28/11
EPAS 13:21:26
13:22:26
13:23:27
13:24:27
13:25:26
13:26:26
13:27:26
13:28:26
13:29:27
13:30:26
13:31:26
13:32:26
13:33:26
13:34:26
13:35:27
13:36:26
13:37:27
13:38:26
13:39:26
13:41:26
13:42:26
13:43:26
13:44:26
13:45:26
13:46:27
13:47:26
13:48:26
13:49:26
13:51:26
13:52:26
13:53:26
13:54:26
13:55:26
13:56:26
13:57:26
13:59:26
14:00:26
14:01:26
14:02:27
14:03:26
14:04:26
14:05:26
14:06:26
14:07:26
14:08:26
14:09:26
14:10:26
14:11:26
14:12:27
14:13:26
14:14:26
14:15:26
14:16:26
14:17:26
14:18:26
14:19:26
14:20:26
14:21:26
14:22:27
14:23:26
14:24:26
14:25:26
14:26:26
14:27:27
14:28:26
14:30:26
14:31:26
14:32:27
14:33:26
14:34:26
14:35:26
14:36:26
14:37:26
14:38:27
14:39:26
14:40:26
14:41:26
14:42:26
14:43:26
14:44:26
14:45:27
814
814
814
902
901
902
901
901
901
902
901
901
901
903
991
991
991
991
991
991
991
991
991
991
991
902
902
902
902
903
902
903
902
902
902
814
901
814
814
902
814
814
903
814
813
813
812
814
815
814
814
814
814
813
814
814
814
814
814
814
815
815
815
815
815
815
815
815
816
816
816
816
814
814
902
902
901
901
901
901
901
0
0
0
0
0
0
0
0
0
0
0
0
0
0
0
0
0
0
0
0
0
0
0
0
0
0
0
0
0
0
0
0
0
0
0
0
0
0
0
0
0
0
0
0
0
0
0
0
0
0
0
0
0
0
0
0
0
0
0
0
0
0
0
0
0
0
0
0
0
0
0
0
0
0
0
0
0
0
0
0
0
0
0
0
0
0
0
0
0
0
0
0
0
0
0
0
0
0
0
0
0
0
0
0
0
0
0
0
0
0
0
0
0
0
0
0
0
0
0
0
0
0
0
0
0
0
0
0
0
0
0
0
0
0
0
0
0
0
0
0
0
0
0
0
0
0
0
0
0
0
0
0
0
0
0
0
0
0
0
0
0
0
102.23
102.23
0
2.28
0
108.7
0.51
0.14
0
0
0
0
0
0
0
0
0
0
0
0
0
0
0
0
0
0
0
0
0
0
0
0
0
0
0
0
0
0
0
0
0
0
0
0
0
0
0
0
0
0
0
0
0
0
0
0
0
0
0
0
0
0
0
0
0
0
0
0
0
0
0
0
0
0
0
0
0
0
0
0
0
11
12
6
8
9
9
9
10
11
3
5
11
4
19
12
10
6
3
6
6
5
2
17
14
5
0
0
45
0
0
0
0
0
0
0
0
0
0
0
0
0
0
0
0
0
0
6
6
0
0
0
0
303
312
293
281
278
268
264
265
261
261
261
259
255
264
262
259
259
256
260
261
255
256
256
257
251
256
255
261
259
14
14
18
18
18
18
17
17
15
15
15
14
20
20
20
20
14
18
18
18
13
13
13
13
13
13
12
12
12
13
13
13
13
13
13
13
13
13
13
13
14
14
14
13
14
14
14
14
14
14
14
14
14
14
14
14
14
14
14
14
14
14
14
14
17
14
14
14
14
15
15
15
15
15
14
14
14
14
14
14
14
71.2
71.2
71.5
71.4
71.4
71.4
71.4
71.5
71.5
71.6
71.7
72.4
72.5
72.5
72.5
72.5
72.5
72.5
72.6
72.5
72.4
72.4
72.3
72.3
72.2
72.2
72.1
72.1
72
71.9
71.9
71.8
71.7
71.7
71.6
71.5
71.5
71.4
71.4
71.4
71.3
71.3
71.3
71.3
71.3
71.2
71.2
71.2
71.1
71.2
71.2
71.2
71.2
71.1
71.1
71.1
71.1
71.1
71.1
71.1
71
71
70.9
70.9
70.9
70.8
70.8
70.8
70.8
70.8
70.8
70.8
70.8
70.8
70.8
70.7
70.8
70.8
70.8
70.8
70.8
0
0
0
0
0
0
0
0
0
0
0
0
0
0
0
0
0
0
0
0
0
0
0
0
0
0
0
0
0
0
0
0
0
0
0
0
0
0
0
0
0
0
0
0
0
0
0
0
0
0
0
0
0
0
0
0
0
0
0
0
0
0
0
0
0
0
0
0
0
0
0
0
0
0
0
0
0
0
0
0
0
12
12
12
12
12
12
12
12
12
12
12
12
12
12
11.9
11.9
11.9
11.9
11.9
11.9
11.9
11.9
11.9
11.9
11.9
11.8
11.9
11.9
11.8
11.8
11.8
11.8
11.8
11.8
11.8
11.8
11.8
11.8
11.8
11.8
11.7
11.7
11.7
11.7
11.7
11.7
11.7
11.7
11.7
11.7
11.6
11.6
11.6
11.6
11.6
11.6
11.6
11.5
11.5
11.5
11.5
11.5
11.5
11.5
11.4
11.4
11.4
11.4
11.3
11.3
11.3
11.3
11.2
11.2
11.2
11.1
11.1
11.1
11.1
11
11
37
Environmental Devices Corporation
1/28/11
1/28/11
1/28/11
1/28/11
1/28/11
1/28/11
1/28/11
1/28/11
1/28/11
1/28/11
1/28/11
1/28/11
1/28/11
1/28/11
1/28/11
1/28/11
1/28/11
1/28/11
1/28/11
1/28/11
1/28/11
1/28/11
1/28/11
1/28/11
1/28/11
1/28/11
1/28/11
1/28/11
1/28/11
1/28/11
1/28/11
1/28/11
1/28/11
1/28/11
1/28/11
1/28/11
1/28/11
1/28/11
1/28/11
1/28/11
1/28/11
1/28/11
1/28/11
1/28/11
1/28/11
1/28/11
1/28/11
1/28/11
1/28/11
1/28/11
1/28/11
1/28/11
1/28/11
1/28/11
1/28/11
1/28/11
1/28/11
1/28/11
1/28/11
EPAS 14:46:26
14:48:27
14:49:26
14:51:26
14:52:26
14:53:26
14:54:26
14:55:27
14:56:27
14:57:26
14:58:27
15:25:37
15:26:37
15:27:37
15:28:37
15:29:37
15:31:37
15:32:37
15:33:37
15:34:37
15:35:37
15:36:37
15:37:37
15:38:37
15:39:37
15:40:37
15:41:37
15:42:37
15:43:37
15:44:37
15:45:37
15:46:37
15:47:37
15:48:37
15:49:37
15:50:37
15:51:37
15:52:37
15:53:37
15:54:37
15:55:37
15:56:37
15:57:37
15:58:37
15:59:37
16:00:37
16:01:37
16:02:37
16:03:37
16:04:37
16:05:37
16:06:37
16:07:37
16:08:37
16:09:37
16:10:37
16:11:37
16:12:37
16:13:37
901
901
901
901
901
901
900
900
901
901
901
830
831
830
830
833
832
917
917
830
830
830
917
918
917
916
916
917
916
917
917
917
915
915
915
915
915
915
914
915
915
915
915
914
914
915
915
916
915
916
1092
1178
1442
1532
1442
1354
1355
1354
1267
0
0
0.4
0
0
0
0
0
0
0
0
8.8
6.9
5.2
4.2
3.7
2.6
1.7
1.5
1.2
1.2
0.7
0.6
0.4
0.1
0
0
0
0
0
0
0
0
0
0
0
0
0
0
0
0
0
0
0
0
0
0
0
0
0
0.3
0.2
0.9
1.8
1.1
1.2
1.1
1.2
1.2
0
0
0
0
0
0
0
0
0
0
0
32
29
25
23
767
28
23
25
29
27
28
26
28
28
18
19
26
25
21
21
21
14
17
12
13
12
12
11
12
13
12
13
11
10
7
15
16
15
18
18
18
25
28
25
0
23
18
19
0
0
0
0
0
0
0
0
0
0
0
0
0
0
0
0
0
0
0
0
0
0
0
0
0
0
0
0
0
0
0
0
0
0
0
0
0
0
0
0
0
0
0
0
0
0
0
0
0
0
0
0
0
0
0
0
0
0
0
260
258
258
267
262
265
267
270
268
271
273
0
0
0
0
0
0
0
0
0
0
0
0
0
0
0
0
0
0
0
0
0
0
0
0
0
0
0
0
0
0
0
0
0
0
0
0
0
0
0
0
0
0
0
0
0
0
0
0
14
14
14
14
14
14
14
14
14
14
14
15
15
15
14
14
14
14
14
14
14
14
14
14
14
14
14
14
14
16
16
16
16
16
14
14
14
14
14
14
14
14
14
14
14
16
16
16
16
16
23
23
23
23
13
13
13
13
13
70.8
70.8
70.7
70.6
70.6
70.6
70.6
70.6
70.5
70.5
70.5
70.1
70.8
70.8
70.9
70.9
71.1
71.2
71.1
71.1
71
71
71
71
71
70.9
70.9
70.9
70.9
70.9
70.9
70.9
70.9
70.8
70.8
70.8
70.8
70.8
70.7
70.7
70.7
70.7
70.7
70.7
70.7
70.8
71.3
71.5
71.9
72.5
72.8
73.1
73.5
73.8
74.1
74.2
74.4
74.5
74.5
0
0
0
0
0
0
0
0
0
0
0
0.47
0.31
0.28
0.83
0.74
0.54
0.41
0.34
0.42
0.39
0.44
0.47
0.28
0.26
0.3
0.31
0.26
0.28
0.28
0.23
0.27
0.23
0.22
0.2
0.18
0.18
0.18
0.11
0.19
0.1
0.32
0.12
0.21
0.13
0.07
0.15
0.15
0.18
1.14
0.16
0.46
0.32
0.24
0.5
0
0.29
0.32
0.35
10.9
10.8
10.7
10.6
10.5
10.4
10.3
10.2
10
9.8
9.6
13
13
13
13
13.1
13.1
13.1
13.1
13.1
13.2
13.2
13.2
13.2
13.2
13.2
13.2
13.3
13.3
13.3
13.3
13.3
13.3
13.3
13.3
13.3
13.3
13.4
13.4
13.4
13.4
13.4
13.4
13.4
13.4
13.4
13.4
13.4
13.4
13.4
13.5
13.5
13.5
13.5
13.5
13.5
13.5
13.5
13.5
38
Environmental Devices Corporation
SENSOR
REPORT
Environmental Report
Start: 1/28/2011 12:39:26 PM End: 1/28/2011 4:13:37 PM
Collected by:Allan
Logger ID 201101
180
Record Count
Sensor ID
Carbon Dioxide
Range: 0 to 5000 ppm
Min
Ave
726
875.5
Max
1532
Std. Dev
Hi Limit
% Above Hi
Lo Limit
% Below Lo
750
83.89%
300
0.00%
ppm
132.0
1,600
Carbon Dioxide
Hi Limit
1,500
Lo Limit
1,400
1,300
1,200
1,100
1,000
900
800
700
600
500
400
300
12:39:26
01/28/2011
12:51:26
01/28/2011
13:03:27
01/28/2011
13:16:27
01/28/2011
13:29:27
01/28/2011
13:42:26
01/28/2011
13:55:26
01/28/2011
14:08:26
01/28/2011
14:20:26
01/28/2011
14:33:26
01/28/2011
Sensor ID
Carbon Monoxide
Range: 0 to 100 ppm
Min
Ave
0
.2677
Max
8.8
Hi Limit
Std. Dev
ppm
1.05
% Above Hi
Lo Limit
0.00%
9
% Below Lo
0.00%
Carbon Monoxide
8
7
6
5
4
3
2
1
0
12:39:26
01/28/2011
12:51:26
01/28/2011
13:03:27
01/28/2011
13:16:27
01/28/2011
13:29:27
01/28/2011
13:42:26
01/28/2011
13:55:26
01/28/2011
14:08:26
01/28/2011
14:20:26
01/28/2011
14:33:26
01/28/2011
Sensor ID
Nitrogen Dioxide
Range: 0 to 5000 ppb
Min
Ave
0
9.311
Max
Std. Dev
767
57.54
Hi Limit
ppb
% Above Hi
Lo Limit
0.00%
800
% Below Lo
0.00%
Nitrogen Dioxide
750
700
650
600
550
500
450
400
350
300
250
200
150
100
50
0
12:39:26
01/28/2011
12:51:26
01/28/2011
13:03:27
01/28/2011
13:16:27
01/28/2011
13:29:27
01/28/2011
13:42:26
01/28/2011
13:55:26
01/28/2011
14:08:26
01/28/2011
14:20:26
01/28/2011
14:33:26
01/28/2011
Page 1
EPAS 39
Environmental Devices Corporation
Environmental Report
Start: 1/28/2011 12:39:26 PM End: 1/28/2011 4:13:37 PM
Collected by:Allan
Logger ID 201101
180
Record Count
Sensor ID
Nitric Oxide
Range: 0 to 100 ppb
Min
Ave
0
11.61
Max
108.9
Hi Limit
Std. Dev
ppb
26.93
% Above Hi
Lo Limit
0.00%
110
% Below Lo
0.00%
Nitric Oxide
100
90
80
70
60
50
40
30
20
10
0
12:39:26
01/28/2011
12:51:26
01/28/2011
13:03:27
01/28/2011
13:16:27
01/28/2011
13:29:27
01/28/2011
13:42:26
01/28/2011
13:55:26
01/28/2011
14:08:26
01/28/2011
14:20:26
01/28/2011
14:33:26
01/28/2011
Sensor ID
Particulates
Range: 0 to 20000 uG/m3
Min
Ave
0
64.75
Max
Std. Dev
312
107.9
Hi Limit
uG/m3
% Above Hi
Lo Limit
0.00%
320
% Below Lo
0.00%
Particulates
300
280
260
240
220
200
180
160
140
120
100
80
60
40
20
0
12:39:26
01/28/2011
12:51:26
01/28/2011
13:03:27
01/28/2011
13:16:27
01/28/2011
13:29:27
01/28/2011
13:42:26
01/28/2011
13:55:26
01/28/2011
14:08:26
01/28/2011
14:20:26
01/28/2011
14:33:26
01/28/2011
Sensor ID
Relative Humidity
Range: 0 to 100 %
Min
Ave
12
14.48
Max
23
Hi Limit
Std. Dev
%
1.96
% Above Hi
Lo Limit
0.00%
23
% Below Lo
0.00%
Relative Humidity
22
21
20
19
18
17
16
15
14
13
12
12:39:26
01/28/2011
12:51:26
01/28/2011
13:03:27
01/28/2011
13:16:27
01/28/2011
13:29:27
01/28/2011
13:42:26
01/28/2011
13:55:26
01/28/2011
14:08:26
01/28/2011
14:20:26
01/28/2011
14:33:26
01/28/2011
Page 2
EPAS 40
Environmental Devices Corporation
Environmental Report
Start: 1/28/2011 12:39:26 PM End: 1/28/2011 4:13:37 PM
Collected by:Allan
Logger ID 201101
180
Record Count
Sensor ID
Temperature
Range: -40 to 140 Deg. F
Min
Ave
70.1
71.39
Max
74.5
Hi Limit
Std. Dev
0.77
Deg. F
% Above Hi
Lo Limit
0.00%
74.5
% Below Lo
0.00%
Temperature
74.0
73.5
73.0
72.5
72.0
71.5
71.0
70.5
70.0
12:39:26
01/28/2011
12:51:26
01/28/2011
13:03:27
01/28/2011
13:16:27
01/28/2011
13:29:27
01/28/2011
13:42:26
01/28/2011
13:55:26
01/28/2011
14:08:26
01/28/2011
14:20:26
01/28/2011
14:33:26
01/28/2011
Sensor ID
VOCS
Range: 0 to 50 ppm
Min
Ave
0
.0822
Max
1.14
Hi Limit
Std. Dev
ppm
0.17
% Above Hi
Lo Limit
0.00%
% Below Lo
0.00%
1.2
VOCS
1.1
1.0
0.9
0.8
0.7
0.6
0.5
0.4
0.3
0.2
0.1
0.0
12:39:26
01/28/2011
12:51:26
01/28/2011
13:03:27
01/28/2011
13:16:27
01/28/2011
13:29:27
01/28/2011
13:42:26
01/28/2011
13:55:26
01/28/2011
14:08:26
01/28/2011
14:20:26
01/28/2011
14:33:26
01/28/2011
Sensor ID
Supply Voltage
Range: 0 to 16 V
Min
Ave
9.6
12.13
Max
13.5
Hi Limit
Std. Dev
V
0.84
% Above Hi
Lo Limit
0.00%
13.5
% Below Lo
0.00%
Supply Voltage
13.0
12.5
12.0
11.5
11.0
10.5
10.0
9.5
12:39:26
01/28/2011
12:51:26
01/28/2011
13:03:27
01/28/2011
13:16:27
01/28/2011
13:29:27
01/28/2011
13:42:26
01/28/2011
13:55:26
01/28/2011
14:08:26
01/28/2011
14:20:26
01/28/2011
14:33:26
01/28/2011
Page 3
EPAS 41
Environmental Devices Corporation
COVER
Environmental Report
3/6/2011
ENVIRONMENTAL REPORT
Session location: Northeast
Session site: Medium Town
Organizational affiliation: EDC
Session environment: Outdoors
Session type: Ambient
Session environment:
Session Description: Test
Logger Serial Number: 201101
Logging began on: 1/28/2011 12:39:26 PM
Logging stopped on: 1/28/2011 4:13:37 PM
Data uploaded on: 1/28/2011 4:15:25 PM
Samples were averaged and saved every: 1 Minute
Report was averaged: 1 Hour
Total samples in this upload: 180
Memory remaining: 9776
SENSOR
UNITS
LO LIM
HI LIM
------------------------------------------------------------------------------------Carbon Dioxide
Carbon Monoxide
Nitrogen Dioxide
Nitric Oxide
Particulates
Relative Humidity
Temperature
VOCS
Supply Voltage
ppm
750
ppm
ppb
ppb
uG/m3
%
Deg. F
ppm
V
300
*
*
*
*
*
*
*
*
*
*
*
*
*
*
*
*
* indicates no limit was set
Data collected by: Allan
City: Plaistow
State: NH
Country: USA
Longitude: Deg. Min. W
Latitude: Deg. Min. N
Elevation:
Date,Time,CO2,CO,NO2,NO,Part,RH,Temp.,VOC,Pwr
EPAS 42
Environmental Devices Corporation
AVERAGE
PERIOD
REPORT
Locations
201101
Northeast
EDC
Environmental Report
Report Ave
1 Hour
180
1/28/2011
Start Date
12:39:26 PM
Record Cnt
End Date
Export Ave
CO2 ppm
1/28/2011
4:13:37 PM
875.527 1532
CO ppm
NO2 ppb
9.31111 767
NO ppm
8.8
0
Ave
Max
Min
Ave
Max
Min
0
11.6182 108.9
14.4888
RH %
23
12
0
12.1338
13.5
Ave
Max
Min
Ave
Max
Min
Ave
Max
Min
Ave
Temp. F
71.3994 74.5 70.1
VOC ppm
.082277 1.14
Pwr V
0
Min
9.6
0
0
0
0
0
0
Max
Min
Ave
Max
Min
Ave
Max
Min
875.527 1532
726
.267777
8.8
0
9.31111
767
0
11.6182 108.9
0
64.75
312
0
14.4888
23
12
71.3994
74.5
70.1
.082277
1.14
0
12.1338
13.5
9.6
0
0
0
0
0
0
755.690
901
726
0
0
0
0
0
0
47.1345 108.9
0
19.0714
31
7
13.7380
16
13
71.3880
71.7
71.2
0
0
0
12.1452
12.3
12
0
0
0
0
0
0
1 Hour
13:23:27
1/28/11
881.55
991
812
0
0
0
0
0
0
1.8605
108.7
0
50.55
312
0
14.6166
20
12
71.6566
72.6
71
0
0
0
11.7966
12
11.5
0
0
0
0
0
0
1 Hour
14:26:26
1/28/11
878.533
918
814
.653333
8.8
0
23.0833
767
0
0
0
0
130.35
273
0
14.35
17
14
70.8083
71.2
70.1
.161666
.83
0
12.0683
13.4
9.6
0
0
0
0
0
0
1 Hour
15:56:37
1/28/11
1125.05 1532
914
.5
1.8
0
16.1666
28
0
0
0
0
0
0
0
16.2777
23
13
72.5388
74.5
70.7
.283888
1.14
0
13.45
13.5
13.4
0
0
0
0
0
0
Ave
Max
0
Max
1/28/11
EPAS .267777
Min
Ave
12:39:26
Daily Fri, Jan 28, 2011
Max
726
Part ug/m3
64.75
312
1 Hour
Ave
Min
43
Environmental Devices Corporation
CONTACT
For further assistance contact:
Environmental Devices Corporation
603-378-2112
800-234-2589
fax 603-378-2113
[email protected]
4 Wilder Drive, Building 15
Plaistow NH 03865
USA
EPAS 44