1
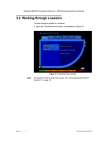
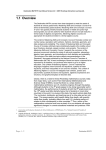
Silver Financial Planner
Tutorial
Menu
•
•
•
•
•
•
•
•
•
•
Overview
Setup
File Management
Data Input
When-If?TM
What-If?
Viewing Reports
Viewing Graphs
Summary Page
Printing Reports
Overview
•
•
•
•
•
•
•
Introduction
Main Menu
Program Selections
Data Input Forms
Overview
User Manual
Help
Overview - Introduction
The Introduction section
provides links to view the
Overview and Quickstart help.
Introduction videos are
available by clicking the link to
the Getting Started video.
Overview - Main Menu
Main Menu
Overview – Program Sections
The left side allows
you to move
through program
sections of Inputs,
Reports, Graphs
and What If?.
Overview – Input Sections
Move to any input areas
by clicking on the
sections available under
Inputs on the left hand
side of the program.
Overview - Data Input Forms, Help
Under Help, you can open
the Data Input Form
(client questionnaire)
and bring up the overview
and quickstart help.
Overview - Help
Help is always just a click
away. Click the ?
available on the top right
corner of each window.
Setup
• Report Selection
– Defaults Reports
– Custom Reports
• Calculators
– Present Value / Future Value calculator
• Options
– Customize Asset Groups
– Customize Long Term Care Defaults
– Customize Advisor Information
Setup - Report Selection: Default Reports
Six Default Report Sets
are available: Entire
Report, Retirement,
Estate, Insurance
Analysis, Gap Analysis
and Debt Freedom.
Setup - Report Selection: Custom Reports
Choose Create/Modify
Custom Reports to create
additional report sets.
The Report
Customization
area allows you to
modify existing
report sets and
create custom
report sets.
Setup - PV/FV Calculator
The PV/FV tool is useful
for quick “on the fly”
calculations
Setup - PV/FV Calculator
Enter data for
calculations here….
…. Or here
Setup – Options
Customize Asset Classes
Customize Reports:
Customize Long Term Care Default
Customize Advisor Information
Setup – Options: Customize Asset Groups
Edit the
asset class
name here.
Change asset allocation
portfolios here. Each column
needs to add up to 100%
Setup – Options: Customize LTC Defaults
Three levels of Long Term
Care are available. The
High, Medium and Low
level will be based on the
clients spending level.
Setup - Options: Customize Advisor Information
You can also
add a Cover
Page Logo.
Enter company
information here.
The ten lines of
text will display
on the report
cover page.
File Management
• Start a new file
• Open an existing file
• Save a file
File Management – File Menu
File Menu
• New - Starts a new file.
• Open - Opens an existing file.
• Save - Saves data.
• Save As – Allows data to be
saved with a new file name or
in a different location.
• Exit - Exits the program.
File Management – Save & Open
When Opening or Saving a file,
you may select any folder here.
The program will default back to
this location the next time you
open or save a file.
To OPEN a file, double click on
the file name.
To SAVE a file, enter a file
name, for example, the
clients last name. No
extension is needed – it
will be saved as a .sfp file).
Data Input
•
•
•
•
•
•
•
•
•
•
•
•
•
Navigating the Input Windows
Names/Ages
Risk
Estate
Insurance
Pensions/Social Security
Income/Expense
Education Funding
Assets
Additional Assets/Debts
Debt Freedom
Rates
Behavior Analysis
Data Input – Navigation
When you finish entering data for
each window, you may click on
another tab (available along the
left side of the program)…
… or click the NEXT
button.
Data Input – Names/Ages
Enter client
names, ages, and
retirement ages.
The program will display
an estimated life
expectancy. You can
enter an alternate life
expectancy if desired.
Data Input – Risk
Enter the clients risk
level, or click the Risk
Tolerance Test button.
Data Input –Estate
Existing
estate
planning
details.
Suggested amounts or
percents for the
estate planning
reports.
Data Input – Insurance
To enter insurance policies,
click on Add/Modify.
Data Input –Insurance Detailed Input
Enter information on up to 8 policies.
Check which
reports you wish
to include the
policy death
benefit.
Data Input – Pension/S.S.
Allows for two pensions per client and spouse.
You can enter a lump sum
pension by checking the lump
sum box. The lump sum dollar
amount will be rolled into a
qualified retirement account.
If there is a survivor
option, enter the
percent payable to the
surviving spouse here.
Data Input – Pension/S.S.
Earned income is used to on the
Cash Flow reports and to estimate
potential Social Security benefits.
If the client is retired or
the SS benefit amount is
known, enter the
amount here.
You may
select the
inflation rate
for the SS
benefit.
Data Input – Income/Expense
Annual expense
information and
inflation rates
go here.
These buttons open
special worksheets for
more detailed budget
information, special
income and expense
items.
Data Input – Income/Expense: Budget Worksheet
Use the budget
worksheet to enter
expense details. Enter
the amount for
Current, Retirement
and Survivor Now and
Survivor Retirement.
When completed,
click on DONE to
transfer totals to
the Expense fields.
Data Input – Income/Expense: Special Income Planner
Special Income Planner:
Enter amounts that the
client will receive and have
the available to add to
savings/investments.
*Note: Any pre-retirement
special income items are
considered to be reinvested
into the taxable savings
account.
Indicate the increase rate
(starting from today), the
starting year, and the
number of years. Set the
number of years to 1 for a
single year event.
Data Input – Income/Expense: Special Expense Planner
Special Expense Planner:
Enter special amounts
the clients will spend that
will reduce their assets.
*Note: Any preretirement special
expense items are
withdrawn from
investment accounts.
Each expense may be listed as
Essential, Primary, Secondary or
Optional. This will be used for the
Goal Evaluation report. Four
different Monte Carlo illustrations
will determine the percentage of
success if the goals are funded by
order of priority.
Data Input –Education Funding
If parents will pay for college costs out of their
savings and investment funds, check this box.
Enter data for each
child and info about
college costs.
Existing
college fund
and additions
to funds.
To estimate college
costs, including
tuition and housing,
use the College Cost
Estimator by clicking
the $ button.
Data Input – Education Funding: College Cost Estimator
First select
the State.
Choose In State or Out of State
and check the boxes to add other
expenses like housing costs.
Then the school.
Click OK to use
the estimated
cost.
Data Input – Assets
Use this button to
go to the asset
input window.
This is an asset summary
showing assets entered in the
asset detail input window.
Double-click on
an asset to go
directly to edit
the asset.
Data Input – Assets: Add or Modify Assets
Enter the
description,
value and
additions here.
Choose the appropriate
taxations, class, type
and ownership.
If additions start now
and stop at retirement,
leave these field blank.
Otherwise, enter the
starting year and
number of years the
additions will be made.
Data Input – Assets: Add or Modify Assets
Use these buttons to add
or delete an asset, move
through assets, or finish
entering assets. To get
back to the Asset tab and
save changes, choose OK.
Cancel will also take you
back to the Assets tab, but
will not save any changes.
Data Input – Additional Assets/Debts
Additional Asset and Debt values
are used to prepare a Net Worth
statement. Items entered in this
section are not used in the
retirement projection.
Debt payment information is used
for the Debt Freedom Analysis.
NOTE: Debt payments entered in this
section are not automatically included
with living expenses. Loan payments
need to be entered as part of living
expenses on the Income/Expense tab.
Data Input – Additional Assets/Debts
Include an additional
amount that can be
used to achieve
freedom from debt.
Data Input – Rates
Rates are applied to each
asset group. Enter an
assumed rate before and
after retirement age.
If there is a possibility funds will be withdrawn from Tax
deferred retirement accounts before age 59.5. If you do NOT
want the early withdrawal penalty applied, check this box.
If this box is checked,
first year calculations
are proportionalized for
the number of months
remaining in the year.
Data Input – Rates
If the client has non-qualified tax-deferred annuities,
indicate the cost basis percentage here (cost/value).
If taxable
assets
(stocks,
mutual
funds, ect.)
have a low
cost basis,
enter the
ratio of cost
to market
value here.
If the dollar amount of
annual additions are
increasing, enter the
increase rate here.
If this box is checked, the
possibility of major negative
rates of return is increased for
the Monte Carlo analysis.
Data Input – Behavior Analysis
Check boxes control the
variables randomized
for the Monte Carlo
simulations.
Use the Early and Later fields to select a
range of possible retirement ages.
Withdrawal rate limits
set the maximum
withdrawal rates as a
percentage of assets.
Click
Recalculate
to generate
results.
Variable spending fields
determine the expenses to
be used in the Variable
Sending analysis.
When-If?TM
• Introduction to When-If?TM
• When-If?TM – Second View of Data Input
• When-IfTM Graphs
When-If?TM – Introduction
• The When-if? Behavior Analysis gives
planners another way to analyze their client’s
financial future.
• The When-if? TM has two distinct features
used in conjunction:
– Retirement age analysis.
– Variable spending analysis.
• Both features of the When-if? TM tool can be
considered modifications of the typical Monte
Carlo simulation.
When-If?TM – Introduction
• The retirement age analysis can be used to
examine a range of retirement ages for the
client and determine which retirement age
may provide the best outcome.
• The variable spending analysis examines
what effect reactive spending behavior may
have on the success rate of client’s
retirement plan.
When-If?TM – Second View of Input
The rate of return and/or
inflation are randomized
for the Monte Carlo trials.
Used to Evaluate
Retirement Age
Probabilities.
Initial withdrawal rate limit
determines retirement age.
Initial and Ending
withdrawal rate drive
variable spending.
Spending is
bounded by the
spending floor
and ceiling.
When-If?TM – Graphs:
Age Results
Each red bar shows the
probability of having
enough funds to meet
the initial withdrawal
rate requirement.
Percentage of
Monte Carlo
trials where
retirement
had occurred
by this age.
When-If?TM – Graphs:
Success Rate
Percentage of Monte
Carlo retirement
successes when
retirement occurred at
this age.
Each green bar
shows the
probability of
having sufficient
funds through
life expectancy.
When-If?TM – Graphs:
Variable Spending
Solid Orange Line:
Planned full budget
spending.
Green Area:
Budget spending
floor. Spending
will never be lower
than the floor.
Black Dotted
Line: Adjusted
spending model.
Blue Dashed
Line: Suggested
withdrawal rate
limit.
When-If?TM – Graphs:
Variable Spending vs Monte Carlo
Blue: Monte Carlo success
rate will full budget
spending at life expectancy
when retired at this age.
Green: Monte
Carlo success rate
with variable
spending at life
expectancy when
retired at this age.
What-If?
• Using What-If?
– Features of the What-If?
• Test various "What-if" scenarios and see the results
immediately displayed.
• Model recommendations while your client is watching.
• Saving What-If? Scenarios
– Save up to 3 What If scenarios and include What-If
results in the main report set.
What-If? – Using What-If?
Clients capital
accounts (all savings,
investments and
retirement accounts
combined.)
Capital has been
consumed.
Cumulative
shortages in red.
When you click on the
What-If? tab, this
window will display.
What-If? – Using What If?
Client and spouse life
expectancy is here.
Summary of
your data input
information.
The clients run out
of money here.
What-If? – Using What If?
Here’s the power
of the “What-If?”.
When the clients realize they have
a problem (out on money) then
discuss possible solutions such as
repositioning assets.
Discuss how this might result
in increasing the rate of
return on some asset groups
and enter a new rate.
What-If? – Using What-If?
See the graph
improve before
their eyes.
Now click on the
“Recalculate What-If?”
button.
If the first
suggestion doesn’t
completely solve the
problem, try another
suggestion.
What-If? – Using What-If?
A few extra dollars
per year can make a
substantial difference.
Increase additions to
non-qualified plans
(or any other accounts).
You could also try
changing their
expenses, life
expectancy,
retirement age, ect.
What-If? - Saving What-If Scenarios
You may save up to 3
what-if scenarios and
choose to include the
what if results in the
main report set.
Make your changes and give
the scenario a name using
the Scenario Text field.
Then click the
Save/Report
button.
What-If? - Saving What-If Scenarios
Save/Report will load the Scenario
Management Option System.
The current scenario
can be saved in any of
the three spots by
clicking Save button.
To included the
What If scenario
in the report set,
check the Include
in Report? box.
Viewing Reports
• Click View Reports to generate the reports.
• Generated reports will be listed on the
Contents panel on the left side.
Viewing Reports
The report will be
displayed on the
screen, exactly as they
will look when printed.
Viewing Reports
Adjust the page
display here.
Move up or
down one page
at a time by
clicking here.
Jump to any report
page by clicking on
the page name.
Viewing Reports
The solid blue line
represents the
original projection
using the average
rate of return
each year.
The other lines
represent 10,000
projections using
a randomly
selected rate of
return every year.
Viewing Reports
The most important of
the statistics from the
report is the “Percent of
projections above zero.”
This tells us how many
times out of 10,000 there
was any money left at
the last life expectancy.
Most clients will want
this “Probability of
success” number to be
75% or more,
depending on their risk
tolerance level.
Summary Report
• The Summary report restates the client basic
objectives and summarizes the outcome.
• Actions are suggested if a shortfall does occur
before life expectancy.
Viewing Graphs
• To display graphs, click on the Graphs tab.
• Use the tabs along the left hand side to select
which graph you wish to view.
Printing
•
•
•
•
Report Selections
Custom Reports
Print Options
Export Options
Printing – Report Selection
Options are available under the
Report Selections menu.
Select the reports your
wish to display and print.
Use a default report set or
a custom report set.
Items like Print
as Draft Copy,
and Print with
Pages Numbers
can be selected.
Printing - Print Selection
Default report lists
include Entire Report,
Retirement, Estate,
Insurance Analysis and
GAP Analysis.
Custom report lists can be
created by selecting
Create/Modify Custom Reports.
Printing - Creating a Custom Report
Create a name for
your custom
report set.
Select from the Available Pages list
on the left – this will move the report
pages to the Selected Pages list on
the right.
Printing – Print Options
You can print the
entire report or a
range of pages by
selecting Print.
You can print a single
page by clicking
Print Current Page.
This will print the report
you are actively viewing.
Printing – Export Options
You export the reports to:
•Adobe PDF file (.pdf)
•Rich Text Format file (.rtf)
Click
Export.
•Excel File (.xls)
You can
export all
pages, the
current
page, or a
range of
pages.
Printing – Export Options
Select the
location to save
the exported file.
Enter the file
name, choose the
appropriate type
and click Save.
Drop down
the “Save as
type” to
select PDF,
XLS, or RTF.
End of
Silver Financial Planner Tutorial
Remember, you can always click the ? on the
top right corner of the screen for help while
working in the program.