1
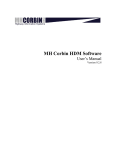
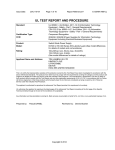
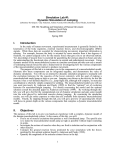
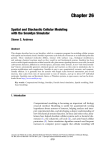
Engineered Excellence
A Journal for Process and Device Engineers
Simulating Radiation-Induced Shifts in
MOSFET Threshold Voltage
Introduction
Insulator Charging
Irradiation by energetic particles can degrade semiconductor device performance. The particles involved can be
electrons, positrons, neutrons, protons, alpha particles,
heavy ions, or high-energy photons. As they pass through
a device, these particles interact with the lattice. Energy
deposited through these interactions may damage the
lattice directly by displacing its atoms, or may result in
the creation of electron/hole pairs. A sudden excess of
electron/hole pairs may trigger a latchup, possibly damaging the device through overcurrent. Holes generated
within an insulator may become trapped there, leading
to a gradual accumulation of charge that worsens performance and eventually causes the device to fail. Consideration and modeling of these effects is important when
designing semiconductor devices that will be exposed to
high-energy radiation.
In insulator materials, because very few carriers are present, trap states usually do not become charged, although
quantum mechanical tunneling may cause some charging near interfaces. Irradiation by energetic particles,
however, can generate electron/hole pairs within the
body of an insulator. Under the influence of an electric
field, the electrons and holes from these pairs can separate and become trapped, leading to a gradual accumulation of charge both within the insulator and on its surface. The processes involved are illustrated in Figure 1.
An energetic particle such as an x-ray photon first enters
the body of an insulator. There it may be scattered by the
crystal lattice and, in the process, generate an electron/
hole pair. Once an electron/hole pair has been created,
it becomes subject to two opposing forces. The first force
arises from the Coulomb attraction between the electron
and hole, which tends to cause the pair to recombine. The
second is the electric field that arises from the applied
biases, which tends to separate the carriers. This simple
description is sufficient provided that that distinct pairs
of electrons and holes are far enough apart that the separate pairs do not interact. A sparse distribution like this is
denoted by the adjective geminate.
The device simulator Victory Device has models to account for the following radiation effects:
1. Local electron/hole pair generation along particle
tracks caused by individual particle strikes — single
event upsets.
2. Generation and recombination of electron/hole pairs
caused by the ongoing radiation of a device.
3. Insulator charging caused by the trapping of radiation-generated electrons and holes within insulator
materials.
Continued on page 2 ...
4. Lattice dislocation defects caused by the accumulated
flux of radiation through a device.
INSIDE
In this article, we illustrate some effects that radiation
may have on the electrical characteristics of a device. We
shall consider an n-MOSFET that is exposed to x-rays,
consequently experiencing radiation-induced generation
and recombination that leads to charging of the oxide region below the gate.
Volume 24, Number 4, October, November, December 2014
October, November, December 2014
Radiation-Induced Current Leakage Between
Two n-MOSFET’s .................................................... 5
Displacement Damage ................................................ 7
Mixed Mode Radiation Event Detector....................... 9
Page 1
The Simulation Standard
Photon
Photon
e
Photon
e
e
Oxide
Conduction
Band
e
Electric
Field
Energy
Quantum
h
h
Oxide
Valence
Band
h
h
Hole Trap
Hole Trap
Untrapped
Hole
Trapped
Hole
h
Hole/Electron Pair
Generation and
Subsequent Geminate
Recombination
Energy Quantum from
Geminate Recombination
Process Releases
Trapped Hole
Figure 1. Physical processes leading to insulator charging.
The parameters of the yield function depend on both the
type of the radiation and the material being irradiated.
Typical curves for SiO2 are shown in Figure 2.
In accounting for the generation of electron/hole pairs,
the generation rate due to high energy radiation can be
expressed as the product of the irradiation dose-rate and a
generation factor that is specific to the irradiated material.
This generation factor is basically just the material density
divided by the energy it takes to create an electron/hole
pair in that substance. Departures from this basic rate can
be accounted for by applying a numerical enhancement factor. Taking the density of SiO2 as 2.2 g/cm3 and the formation energy of an electron/hole pair as 18 eV, we calculate
a basic generation factor for SiO2 of 7.6x10¹² pairs/cm3·rad.
Multiplying this by a dose-rate expressed in rad/s gives us
a generation rate in units of pairs/cm3·s. However, not all
electron/hole pairs that are generated become active in the
device. Some pairs recombine so soon after they are generated that neither carrier has a chance to be transported1.
This is called geminate recombination. It is accounted for
by multiplying the basic generation rate by a yield function.
Based on the work of Dozier, et al.2 and others, the yield
function used by Victory Device takes the form
Y=
where
|E| + E0Y0
If an electric field is present, electrons and holes from pairs
that survive the geminate recombination process drift apart
under the influence of the field. Insulator charging occurs
when some of these carriers become trapped by impurities
or other crystal defects present within the insulator material. The magnitude of this charging is determined by a
balance between carrier capture and emission processes.
The capture process for insulator traps is the same as for
traps in ordinary semiconductors, but the emission process appears to be different. According to the model of
Kimpton and Kerr3, the primary energy source stimulating the detrapping process is the geminate recombination
A0
|E| + E0
• |E| is the magnitude of the electric field,
• Y0 is the zero-field yield factor,
• E0 is a critical field value, and
• A0 moderates the growth rate of the function. (Here A0
is non-negative.)
The Simulation Standard
Figure 2. Geminate yield functions for SiO2.
Page 2
October, November, December 2014
of electron/hole pairs during irradiation. As illustrated
in Figure 1, a geminate recombination event emits a
quantum of energy that may prompt the emission of a
hole from a donor-like trap, or the emission of an electron
from an acceptor-like trap. Meanwhile, the trap energies
are assumed to be far from the band edges, so the ordinary thermally-stimulated emission processes are negligible.
x-rays. The structure and doping of the MOSFET are typical, as shown in Figure 3.
In Victory Device, the radiation models only apply to
semiconductors. Consequently, to model radiation effects in an insulator, you must tell Victory Device to regard the material as a semiconductor. To do this, set the
SEMICONDUCTOR flag on an appropriate MATERIAL
statement. You may also need to define a limited number of semiconductor properties for the material. For this
simulation, we set the following:
According to these assumptions, donor-like insulator
traps emit holes at the rate
∂pt
= G0δ(1-Y)VφNt ƒ
∂t
# Semiconductor properties for oxide
MATERIAL MATERIAL=oxide \
NC300=2e19 NV300=2e19 \
where
EG300=9 SEMICONDUCTOR
• G0 is the generation factor, with units of generatedpairs/cm3·rad,
MATERIAL MATERIAL=oxide MUN=1 MUP=1e-3
MATERIAL MATERIAL=oxide M.VTHP=1
• δ is the dose rate in rad/s,
We also specify the following traps in the insulator body
and on its interface with the semiconductor. These will
become charged as the device is irradiated.
• Y is the geminate yield,
• Vϕ is the emission interaction volume for a trap,
• Nt is the density of traps, and
# Conditions for radiation-induced oxide
charging
INTOXIDECHARGING \
R1MATERIAL=oxide R2MATERIAL=silicon \
JMODEL.P NT.P=3e12 SIGMAT.P=1.5e-13 \
SIGMAN.P=1e-30 SIGMAPH.P=1.5e-13 \
JMODEL.N NT.N=1e4 SIGMAT.N=1e-30 \
SIGMAP.N=1e-30 SIGMAPH.N=1e-30 \
MFP.PHONON=0.013
• f is the probability that a trap is filled.
The expression for the emission of electrons from acceptor-like traps is similar.
Breaking down the rate equation: G0δ is the rate of electron/hole pair creation per unit volume, (1−Y) is the fraction of pairs that undergo geminate recombination, and
Vϕ Nt f is the probability that a phonon created by a geminate recombination event will interact with a filled trap
to empty it.
OXIDECHARGING MATERIAL=oxide \
JMODEL.P NT.P=4e18 SIGMAT.P=1.5e-13 \
SIGMAN.P=1e-30 SIGMAPH.P=1.5e-13 \
JMODEL.N NT.N=1e10 SIGMAT.N=1e-30 \
SIGMAP.N=1e-30 SIGMAPH.N=1e-30
Simulation
To demonstrate the effects of insulator charging due to
exposure to high-energy radiation, we shall use Victory
Device to simulate an n-MOSFET that is bombarded by
The source of radiation will be x-rays at a dose-rate of
1 rad/s:
# Radiation environment
RADIATION DOSERATE=1 XRay
The simulation in our example consists of two parts. In
the first part, we begin by irradiating the device while it
is under a forward gate bias of 5 V, up to an exposure of
1 M-rad. In the second part, we remove the gate bias and
continue the irradiation up to a total exposure of 2 M-rad.
At the start of the simulation, after the first part, and at
the end, we shall sweep the gate bias to determine the
threshold voltage.
Figure 3. n-MOSFET structure used in simulation of radiation effects.
October, November, December 2014
Page 3
The Simulation Standard
Figure 4. Shift in IDVG threshold voltage due to insulator
charging.
Figure 5. Response of trapped interface holes to gate bias and
irradiation.
Results
gate. Consequently, little or no trapping takes place at
the interface. When the reverse bias is removed, approximately half the holes generated in the oxide start diffusing towards the interface, and some of them are trapped
there. With irradiation continuing at zero gate bias, both
the upper and the lower curves in Figure 5 appear to be
headed towards the same level. Indeed, under conditions
of constant irradiation and constant bias, the distribution
of trapped holes eventually approaches an equilibrium
value that depends only on the final bias3.
Irradiation under forward bias induces a shift in the
threshold voltage of the IV curve, as seen in Figure 4.
This is due to the trapping of holes in the oxide. With a
positive bias on the gate electrode, holes generated within the oxide are pushed away from the gate, so most of
the trapping takes place near the oxide/silicon interface.
When the gate bias is removed, only half of the radiationgenerated holes will migrate towards the oxide/silicon
interface, while the other half migrate towards the gate.
Consequently, irradiation with the bias removed releases
some of holes that were trapped near the interface, eventually reducing the threshold shift by about half.
Conclusion
We have shown one way in which the operation and performance of semiconductor devices can be altered or degraded by exposure to high-energy radiation. However,
these effects can be mitigated if they are taken into consideration during the design of a semiconductor device.
A simulator such as Victory Device, which can model
radiation effects, can be a useful tool in the design of
radiation-hardened electronics.
In Victory Device, we can set a PROBE near the oxide/
silicon interface to investigate how the areal concentration of trapped holes changes during the course of this
simulation:
# Probe conditions near the
oxide/silicon interface
PROBE MATERIAL=oxide INT.DONOR.TRAPS \
X=0 Y=-1e-6 NAME=”trapped int holes”
References
The results are shown in Figure 5. With irradiation under
a forward gate bias, the concentration of holes trapped
at the interface gradually increases. Eventually it should
saturate, but the saturation level is not reached during
the course of this simulation. After the bias is removed,
the rate at which holes impinge on the traps is reduced by
roughly half while the hole emission rate remains nearly
the same, leading to a reduction in the concentration of
trapped holes.
Figure 5 also shows a curve for a reversed gate bias. Under
a reversed bias, holes generated in the oxide are pulled
away from the oxide/silicon interface and towards the
The Simulation Standard
Page 4
1] R. J. Milanowski, et al., “TCAD-Assisted Analysis of BackChannel Leakage in Irradiated Mesa SOI nMOSFETs,”
IEEE Transactions on Nuclear Science, Vol. 45, No. 6
(1998): 2593–2599.
2] C. M. Dozier, et al., “An Evaluation of Low-Energy X-Ray
and Cobalt-60 Irradiations of MOS Transistors,” IEEE
Transactions on Nuclear Science, Vol. 34, No. 6 (1987):
1535–1539.
3] D. Kimpton and J. Kerr, “A Simple Trap–Detrap Model
for Accurate Prediction of Radiation Induced Threshold
Voltage Shifts in Radiation Tolerant Oxides for all Static or
Time Variant Oxide Fields,” Solid State Electronics, Vol.
37, No. 1 (1994): 153–158.
October, November, December 2014
Radiation-Induced Current Leakage Between Two n-MOSFET’s
Introduction
material material=oxide semiconductor
material material=oxide nc300=2e19 \
nv300=2e19 eg300=9 affinity=0.9 \
mun=1 mup=1e-3 m.vthp=1
The Simulation Standard article “Simulating RadiationInduced Shifts in MOSFET Threshold Voltage”1 gives a
brief overview of the ways that ionizing radiation can
affect semiconductor devices, and considers insulator charging in particular. In the Victory Device User’s
Manual2 there is a more extensive discussion of radiation
effects. Here we look at how insulator charging due to
ionizing radiation can induce a leakage current between
two MOSFET’s separated by a trench.
We also specify the following traps within the oxide
and oxynitride materials, and on the interfaces between
oxynitride and silicon:
# Conditions for radiation-induced
oxide charging
Simulation
intoxidecharging r1material=oxynitride \
r2material=silicon jmodel.p nt.p=1e14 \
sigmat.p=1.5e-13 sigman.p=1e-30 \
sigmaph.p=1.5e-13 jmodel.n nt.n=1e4 \
sigmat.n=1e-30 sigmap.n=1e-30 \
sigmaph.n=1e-30 mfp.phonon=0.013
To demonstrate how exposure to high-energy radiation
can lead to a breakdown of the isolation between separate
devices, we shall use Victory Device to simulate a pair of
n-MOSFET’s, separated by a trench, that are bombarded
by x-rays. The structure and doping of these MOSFET’s
are shown in Figure 1.
oxidecharging material=oxynitride \
jmodel.p nt.p=2e18 sigmat.p=1.5e-13 \
sigman.p=1e-30 sigmaph.p=1.5e-13 \
jmodel.n nt.n=1e10 sigmat.n=1e-30 \
sigmap.n=1e-30 sigmaph.n=1e-30
In Victory Device, the radiation models only apply to
semiconductors. Consequently, to model radiation effects in an insulator, you must tell Victory Device to regard the material as a semiconductor. To do this, set the
SEMICONDUCTOR flag on an appropriate MATERIAL
statement. You may also need to define a limited number of semiconductor properties for the material. For this
simulation, we set the following:
oxidecharging material=oxide \
vmodel.p nt.p=2e18 sigmat.p=1.5e-17 \
sigman.p=1e-34 sigmaph.p=1.5e-13 \
vmodel.n nt.n=1e10 sigmat.n=2e-32 \
sigmap.n=2e-32 sigmaph.n=1e-30
# Semiconductor properties for oxynitride
material material=oxynitride semiconductor
material material=oxynitride nc300=2e19 \
nv300=2e19 eg300=9 affinity=0.9 \
permittivity=3.9 mun=1 mup=1e-3 m.vthp=1
# Semiconductor properties for oxide
The source of radiation will be x-rays at a dose-rate of
1 rad/s:
# Radiation environment
radiation doserate=1 Xray
In the paired n-MOSFET structure shown in Figure 1,
there is a polysilicon layer in the trench. This layer is present for stress-relief, but may act as a floating electrode.
For the purpose of illustrating radiation-induced leakage
around the trench, our simulation assumes that this polysilicon layer (labeled “anode” in the figure) has floated
to a bias of 1 V, although this represents something of a
worst-case scenario. With a bias of 50 mV on the electrode
labeled “vdd”, we use Victory Device to simulate the device performance as it is irradiated up to a dose of 4 Mrad, in order to examine the effect of dose on the leakage
current. Also, at dose levels of 0, 1, 2, 3, and 4 M-rad, we
sweep the “vdd” bias between 0 V and 1 V to see how the
Figure 1. nMOS-nMOS Structure used to Simulate RadiationInduced Leakage
October, November, December 2014
Page 5
The Simulation Standard
Figure 2. Increase in ionized donor trap concentration after irradiation.
Figure 4. Increase in leakage current with radiation dose.
leakage current is affected by it.
current on the vdd voltage (the slope of the curves in the
figure) increases as well.
Results
Conclusion
As the paired n-MOSFET device is irradiated, a charge builds
up within the oxide layer in the trench. This is illustrated in
Figure 2, which shows the ionized donor-trap concentration
along a cut-plane 0.1 μm below the top of the device.
We have shown how ionizing radiation can create a leakage
path around a trench that separates two MOSFET’s. The
leakage path is produced because radiation causes charging
of the trench oxide, and the charged oxide then acts as the
gate of a parasitic MOSFET that forms around the trench, between the “vdd” and “ground” electrodes of the simulated
device. The leakage current increases the power consumption of the device, and may facilitate latchup. A simulator
such as Victory Device, which can model radiation effects,
can help to identify potential problems like this in electronic
devices that will be exposed to ionizing radiation.
The charge that has built up within the oxide layer opens a
channel around the trench. A leakage current flows in this
channel from the “vdd” electrode to the “ground” electrode.
Figure 3 shows the current density vectors in the device, after it has received a radiation dose of 4 M-rad.
As continued exposure to radiation builds up charge in the
trench oxide, the leakage channel widens and the leakage
current increases. Figure 4 shows how the calculated leakage current from the “vdd” electrode increases as a function
of the radiation dose under conditions of constant bias.
References
At any given radiation dose-level, the magnitude of the
leakage current around the trench depends on the bias
put on the nearby electrodes. Figure 5 shows how the calculated leakage current depends on the “vdd” bias and
the radiation dose. Notice that as the dose is increased
from 1 M-rad to 2 M-rad, the dependence of the leakage
Figure 3. Leakage path around trench.
The Simulation Standard
1. Simulating Radiation-Induced Shifts in MOSFET Threshold Voltage, Simulation Standard, (July, August, September 2014).
2. Victory Device User’s Manual. Chapter 4: Radiation Effects Module (REM), Silvaco, (2014).
Figure 5. Dependence of leakage current on total ionizing dose
and Vdd bias.
Page 6
October, November, December 2014
Displacement Damage
Two fundamental damage mechanisms take place when
devices are exposed to particle fluences: ionization and
lattice displacement or just displacement damage. Ionization has previously been addressed in other simulation standard articles. Neutrons, protons, alpha particles,
heavy ions, and very high-energy photons cause lattice
displacement, or just displacement damage. Particle
bombardment can change the arrangement of the atoms
in the crystal lattice creating lasting damage, and increase
the number of recombination (defect) centers depleting
the minority carriers and degrading the analog properties of the affected semiconductor junctions. High dose
rates of particles (particles/area-s) can cause partial annealing (“healing”) of the damaged lattice, leading to a
lower degree of damage than with the same doses delivered in low intensity over a longer time period.
The displacement damage effects can vary depending on
parameters such as, type of particle radiation, total dose and
radiation flux, combination of types of radiation, and device
operating frequency, operating voltage, actual state of the device during the instant of irradiation and intrinsic and extrinsic shielding. These issues makes thorough testing difficult,
time consuming, and requiring a significant number of test
samples. Silvaco’s displacement damage capability with Victory Device can assist in reducing the cost of testing by pointing the way to required tests to reduce uncertainties.
Figure 1. 4T CMOS image sensor.
Radiation Example, radex12, demonstrates a displacement damage of a 4T CMOS Image Sensor structure. A
Victory Process file creates the 4T CMOS Image Sensor
structure, which is depicted in Figure 1.
This radiation example sweeps the fluence of 1.8Mev Protons from 1e8 to 1e12 and plots the electron concentration
as the fluence is swept through its values.
The damage associated with the collision between energetic particles and atoms within the crystal lattice is defects that can trap electrons and holes. The density of
defects is represented by the equation below:
NF= αD * EL*Density*Fluence
The fluence value is initially set to 1e8 using the set construct.
set FLUENCE=1e8
(EQ.1)
The Victory Process generated structure is imported
mesh infile=radex12_0.str
where
The radiation statement is declared and parameterized
with protons of 1.8 MeV at a fluence of 1e8 from the set
statement.
radiation proton energy=1.8 fluence=$FLUENCE
• NF is the defcts/cm3
• αD is the damage factor which represents the number
of defect states created per unit energy deposited in
the material
• EL is the Non-Ionizing Energy Loss in MeV-cm2/g particle
Using the material statement, the damaging particles
are defined to be protons with a NIEL value of 3.1MeVcm2/g.
• Density is the mass density of the material in g/cm3
material damage.proton=1e3 damage.niel=3.1
• Fluence is the particle fluence in particles/cm where
the particle species can be alpha, electron, ion, neutron, photon, proton, or user defined.
The displacement damage defects model is declared by
setting the fluence.model flag on the defects statement.
The density of defects is calculated using EQ.1 above.
This density of defects applies individually to both acceptor-like and donor-like defects states. The energy of
these defect states are assumed to be uniformly distrib-
2
The Displacement Damage capability within the Radiation
Effects Module of Victory Device supports combinations
of particle species, with separate fluence for each type.
October, November, December 2014
Page 7
The Simulation Standard
uted across the band-gap. If one wanted to describe only
defects of a single type, one must explicitly set NUMA or
NUMD parameter to zero. The tail state parameters SIGTAE, SIGTAH, SIGTDE, and SIGTDH are used to specify
the cross sections.
defects fluence.model \
sigtae=1.e-17 sigtah=1.e-15 sigtde=1.e-15 sigtdh=1.e17
Victory Device allows one to specify combinations of particle species, but each requires a separate radiation statement for each different species, and supports the bounding
of defects to specific locations or material using the localization parameter within the defect statement as described
in section 6.4 of the Victory Device manual.
Figure 2. 4T CMOS Image Sensor degrading electron concentration from base through 1e10, 1e11 and 1e12 proton fluences.
To sweep the Fluence value, one can use a feature described in Appendix B, of the VWF Interactive Tools
Manual as shown below:
solve init
solve previous
output band.param con.band val.band
# Deplete the Image Sensor of Electrons
log outfile=radex12_0.log
solve Vcgate=3.3 ramptime=1e-6 dt=1e-8 tstop=1e-6
solve tstop=2e-6 dt=1e-8
probe n.conc x=4.25 y=3.25 z=1 name=cis_conc
probe potential x=1 y=4.5 z=0.002 name=fd_potential
probe potential x=4.25 y=3.25 z=1
name=cis_potential
# Dark Recovery Time
solve tstop=1 dt=1e-7
method pam.gmres norm.scaling.local
go internal
solve init
solve previous
load infile=radex12_1.in
# Deplete the Image Sensor of Electrons
log outfile=radex12_$’FLUENCE’.log
solve Vcgate=3.3 ramptime=1e-6 dt=1e-8 tstop=1e-6
solve tstop=2e-6 dt=1e-8
sweep parameter=FLUENCE type=list data=”1e10, 1e11,
1e12”
# Dark Recovery Time
solve tstop=1 dt=1e-7
with the radex12_1.in file being:
The simulation of increasing fluence from a base, to 1e10,
1e11 and final to 1e12 is shown by Figure 2. The Figure
shows that at a fluence of 1e12 that well collection no longer exists, and the Image Sensor is no longer functioning
properly.
go victorydevice
set FLUENCE=1e8
mesh infile=radex12_0.str
radiation proton energy=1.8 fluence=$FLUENCE
material dam.proton=1e3 dam.niel=3.1
defects fluence.model \
sigtae=1.e-17 sigtah=1.e-15 sigtde=1.e-15 sigtdh=1.e-17
models consrh cvt fermi
The Simulation Standard
Page 8
October, November, December 2014
Mixed Mode Radiation Event Detector
A reversed biased PIN diode acts as a radiation event
detector, sensing the occurrence of an ionizing radiation
pulse, which is connected to a threshold detector, the resistor RThreshold, that drives the base input of a complementary (Q1 and Q2) pulse amplifier. The output of the
amplifier is supplied to the base of Q4 that drives a pulse
circuit (Q5 and Q6) with a time constant set by RT x CT.
The Radiation Event Detector circuit is shown in Figure 1.
The PIN diode structure is generated using Victory Process.
Since the PIN diode is cylindrically symmetric, one can use
2D Victory Process to generate the PIN diode structure, as
shown in Figure 2 A and B.
Figure 2A. PIN diode structure.
This structure once generated can now be called from a
mixed mode simulation as shown below:
ADIODE PWR15V=cathode PIN_NEG=anode GUARD_
RING=pgate infile=pin_3D.str cylindrical
The generated user defined ionizing pulse is done using
the combination of statements below:
.RAD PWL 0 0 0.9e-06 0 1.0e-06
2.0e-06 1.0 2.1e-06 0.0
1.0
The .RAD statements generates a piece-wise linear pulse
at 0.9us with a rise time of 0.1us to a value of 1, with a
width of 1us and then a fall time of 0.1us starting at 2us
to a value of 0 at 2.1us. This .RAD pulse generations
Figure 2 B. PIN diode structure showing anode and guard-band
(pgate contact).
Figure1. Radiation Event Detector Circuit.
October, November, December 2014
Page 9
The Simulation Standard
electron-hole pairs using the radiation statement as described in chapter 4 of the Victory Device manual.
radiation g0= 4.0e13 doserate=1.0e8
The result of the ionizing pulse is shown in Figure 3.
Mixed Mode simulation of this Radiation Event Detector
allows the user to explore threshold sensitivity by changing the value of RThreshold from 10 ohm to 10K ohms,
and the response time of the circuit by changing C3 and
R6 values as well as associated device models for the
transistors Q1 and Q2.
Figure 3. Radiation Event Detector Circuit signaling that a Ionizing Pulse of 1E8 for 1us
occurred.
The Simulation Standard
Page 10
October, November, December 2014
USA Headquarters:
Worldwide Offices:
Silvaco, Inc.
4701 Patrick Henry Drive, Bldg. 2
Santa Clara, CA 95054 USA
Silvaco Japan [email protected]
Silvaco Korea
[email protected]
Phone: 408-567-1000
Fax: 408-496-6080
Silvaco Taiwan
[email protected]
[email protected]
www.silvaco.com
Silvaco Singapore
[email protected]
Silvaco Europe
[email protected]
October, November, December 2014
Page 11
The Simulation Standard