1
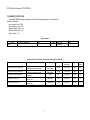
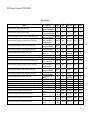
RSS Technical Document 07032014SSMI RSS SSM/I Version-7 Brightness Temperature Data Set netCDF File Format Specification Version-7, Release 0 July 3, 2014 1. INTRODUCTION This document describes the Version-7 (V7) SSM/I Brightness Temperature (TB) Dataset produced by Remote Sensing Systems (RSS) in netCDF version 4.0 format for the NOAA CDR program. This document provides further details of the metadata listed in the netCDF files. Users are advised to refer to the references below for greater detail and historical SSM/I information. The V7 TB dataset incorporates improved geolocation, calibration, and quality control procedures in a consistent manner for the entire 28-year SSM/I dataset. In addition, the six SSM/Is (F08, F10, F11, F13, F14, and F15) have been carefully inter-calibrated among themselves and with WindSat, AMSR-E, and the F17 SSMIS. This allows investigators to confidently use these SSM/I products for detailed interannual and decadal trend studies. Users should read the V7 SSM/I Calibration Report for detailed description of the improvements in geolocation and calibration of the SSM/I instruments. The netCDF files are generated from the V7 binary brightness temperature files using an IDL program. Any known problems with this or earlier versions of the data set are listed in Section 9 below. 2. FILE NAME STRUCTURE and FORMAT The SSM/I brightness temperature data are stored in orbital files. The file names have the form: RSS_SSMI_FCDR_V07R00_F@@_Dyyyymmdd_Stttt_Etttt_R#####.nc where @@ is the SSM/I satellite number (i.e. 08, 10, 11, 13, 14, and 15) yyyy is the long year, mm is month, dd is day of month tttt is hour and minute of UTC day (24 hour clock), start time and end time ##### is the orbit number (i.e., 00001 to 99999), also referred to as the granule number. By definition, an SSM/I orbit begins near the South Pole at the point where the z-component (i.e., northsouth) of the spacecraft velocity vector changes from a negative value to a positive value. For previous users of this data set, be sure to note that this is a different convention than that used in any earlier versions of RSS brightness temperature data files. This change in convention brings uniformity to SSM/I, SSMIS, WindSat, and AMSR-E data from RSS. Each orbital file contains additional scans at the beginning and end of each orbit. For example, the file for orbit 10000 contains scans starting with orbit position 9999.95 and ending with orbit position 10001.05. The data at the end of orbit file 10000 are then given again in orbit file 10001. This 5% overlap of the orbit files facilitates user requirements that involve scan averaging. In order to reduce the downlink telemetry data rate, the SSM/I only takes measurements for the 3 lower frequencies (19, 22, and 37 GHz) every other scan. The 85 GHz measurements are taken every scan. Likewise, the lower frequency measurements are only taken at every other along-scan position. The 85 GHz measurements are taken at all scan positions. For example, an orbital file typically has about 3546 scans, and the total number of observations taken during the Earth-viewing portion of the scan is 128. Thus, the arrays of 85 GHz observations are 128 by 3546. However, the arrays for the lower-frequency observations are 64 by 1773. We refer to the 85-GHz grid as hi-res, and the lower-frequency grid as lo-res. The maximum number of scans in an orbital file is about 3546. To be safe, we allow for a maximum value of 3600. The vectors and arrays in the data file are a fixed dimensional size, with 3600 being the scan dimension of the high resolution data and 1800 being the scan dimension of the low resolution data. 1 RSS Technical Document 07032014SSMI 3. SUMMARY OF DATA FIELDS Each netCDF SSM/I brightness temperature file contains the following scalars, vectors, and arrays. Dimension definitions scan_number_hires = 3600 scan_number_lores = 1800 footprint_number_hires = 128 footprint_number_lores = 64 fourteen_flags = 14 Scalar Variables Name iorbit Long Name / Description Units integer orbit number n/a _Fill Value 0 Valid Range 1 to 100000 Type Integer2 Vector Variables: Dimension is max number of scans for that resolution Name scan_time_hires(scan_number_hires) scan_time_lores(scan_number_lores) orbit_position (scan_number_hires) sc_lat(scan_number_hires) sc_lon(scan_number_hires) sc_alt(scan_number_hires) Description Units Scan start time UTC for high resolution scans in a referenced or elapsed time format Scan start time UTC for low resolution scans in a referenced or elapsed time format Orbit number with position in orbit as fraction (eg. 9999.95) Spacecraft nadir geodetic latitude at time=scan_time Spacecraft nadir geodetic east longitude at time=scan_time Spacecraft nadir altitude at time=scan_time seconds since 200001-01 00:00:00 seconds since 200001-01 00:00:00 2 _Fill Value Valid Range (when scaled) Type Scale Factor -1.0E30 -1.0E9 to 1.0E9 Double n/a -1.0E30 -1.0E9 to 1.0E9 Double n/a n/a 0.0 1.0 to 100000.0 Double n/a degrees North -500.0 -90.0 to 90.0 Float n/a degrees East -500.0 0.0 to 360.0 Float n/a meters -500.0 400000.0 to 1200000.0 Float n/a RSS Technical Document 07032014SSMI Array Variables: Name iqual_flag_hires(scan_number_hires,fourteen_flags) iqual_flag_lores(scan_number_lores,fourteen_flags) Earth_incidence_angle_hires(footprint_number_hires,scan_number_hires) Earth_azimuth_angle_hires(footprint_number_hires,scan_number_hires) Sun_glitter_angle_hires(footprint_number_hires,scan_number_hires) Land_percentage_hires(footprint_number_hires,scan_number_hires) Ice_flag_hires(footprint,number_hires,scan_number_hires) FCDR_brightness_temperature_85V(footprint_number_hires,scan_number_hires) FCDR_brightness_temperature_85H(footprint_number_hires,scan_number_hires) Earth_incidence_angle_lores(footprint_number_lores,scan_number_lores) Earth_azimuth_angle_lores(footprint_number_lores,scan_number_lores) Sun_glitter_angle_lores(footprint_number_lores,scan_number_lores) Land_percentage_lores(footprint_number_lores,scan_number_lores) Ice_flag_lores(footprint,number_lores,scan_number_lores) FCDR_brightness_temperature_19V(footprint_number_lores,scan_number_lores) FCDR_brightness_temperature_19H(footprint_number_lores,scan_number_lores) FCDR_brightness_temperature_22V(footprint_number_lores,scan_number_lores) FCDR_brightness_temperature_37V(footprint_number_lores,scan_number_lores) FCDR_brightness_temperature_37H(footprint_number_lores,scan_number_lores) Latitude_hires(footprint_number_hires,scan_number_hires) Longitude_hires(footprint_number_hires,scan_number_hires) Latitude_lores(footprint_number_lores,scan_number_lores) Longitude_lores(footprint_number_lores,scan_number_lores) Description Instrument / channel quality flag for hi-res scans(Note 1) Instrument / channel quality flag for lo-res scans (Note 1) Observation earth incidence angle for hi-res footprint Observation earth azimuth angle for hi-res footprint (clockwise from North) Observation sun glint angle for hi-res footprint (Note 2) Observation land percentage for hi-res footprint (Note 3) Observation sea ice flag (Note 3) 85.5 GHz V-pol TB 85.5 GHz H-pol TB Observation earth incidence angle for lo-res footprint Observation earth azimuth angle for lo-res footprint (clockwise from North) Observation sun glint angle for lo-res footprint (Note 2) Observation land percentage for lo-res footprint (Note 3) Observation sea ice flag (Note 3) 19.35GHz V-pol TB 19.35GHz H-pol TB 22.235GHz V-pol TB (Note 4) 37.0GHz V-pol TB 37.0GHz H-pol TB Geodetic latitude for hi-res channels Geodetic longitude for hi-res channels Geodetic latitude for lo-res channels Geodetic longitude for lo-res channels 3 Units _Fill Value Valid Range (when scaled) Type Scale Factor n/a 0 0 or 1 Byte n/a n/a 0 0 or 1 Byte n/a degrees 30000 50. to 58. Integer2 0.002 degrees 30000 -180. to 180. Integer2 0.01 degrees 30000 0. to 180. Integer2 0.01 % 255 0. to 100. Integer2 0.4 n/a 255 Integer2 n/a kelvin kelvin -100.0 -100.0 0=no ice, 1=ice possible 50. to 350. 50. to 350. Float Float n/a n/a degrees 30000 50.0 to 58.0 Integer2 0.002 degrees 30000 -180. to 180. Integer2 0.01 degrees 30000 0. to 180. Integer2 0.01 % 255 0 to 100 Integer2 0.4 n/a 255 Integer2 n/a kelvin kelvin kelvin kelvin kelvin degrees North degrees East degrees North degrees East -100.0 -100.0 -100.0 -100.0 -100.0 0=no ice, 1=ice possible 50.0 to 350.0 50.0 to 350.0 50.0 to 350.0 50.0 to 350.0 50.0 to 350.0 Float Float Float Float Float n/a n/a n/a n/a n/a 30000 -90.0 to 90.0 Integer2 0.01 30000 -180. to 180. Integer2 0.01 30000 -90.0 to 90.0 Integer2 0.01 30000 -180. to 180. Integer2 0.01 RSS Technical Document 07032014SSMI Note 1. Quality Control Flags: The iqual_flag for the lo-res and hi-res channels indicates the quality of the scan. If all the flag values are not zero, then there is a problem with the scan. We advise Users to look at the individual flags to decide if the scan should be used for their purposes. In general, if the sum of the iqual_flags is not zero, then the scan should be skipped. However, there are situations where too much data may be discarded. For example, for the F08 SSM/I, the 85 GHz channels for the most part are erroneous and flags 9, 10, and 12 will usually be equal to 1. For this case, if the User does not need the 85 GHz observations, then a sum of flags check would remove data that could be used. Ignoring flags 9, 10, and 12 would be acceptable. The flags have the following meanings: Flag 1: Scan is missing, no data. Missing scans that occur in the middle of an orbit are included in the orbital file as zero-filled spacers. However, missing scans that occur at the beginning or end of the orbit are not included. The appropriate scan_time is set to -1.e30, the fill value. Flag 2: Scan occurs during a period of erroneous data. This problem only occurs for the early SSM/I data (F08, F10, F11, and F13) before 1999. See the SSM/I TA User’s Manual, Revision 2, December 1993 for more information. Flag 3: Scan is affected by calibration errors due to NRL scan averaging. This problem only occurs for the early SSM/I data between October 9, 1990 and August 29, 1992. See the SSM/I TA User’s Manual, Revision 2, December 1993 for more information. Flag 4: Thermistor readings for the scan are out-of-bounds. Flags 5-11: These flags indicate a problem with the calibration data for the scan. These 7 flags refer to channels 19V, 19H, 22V, 37V, 37H, 85V, and 85H, respectively. The following types of anomalies will trigger this flag: a. Cold calibration counts and/or hot calibration counts that are out of bounds. b. Automatic gain control setting that is currently changing. Flag 12: Removal of moon contamination in the cold mirror was not possible for the lower frequency channels (19-37 GHz). Flag 13: Removal of moon contamination in the cold mirror was not possible for the 85 GHz channels. Flag 14: Not used. Note 2. Sun Glint: The sun-glint angle is defined as the angle between two vectors a and b. Vector a is the vector going from the SSM/I footprint to the SSM/I antenna. Vector b is the vector pointing in the direction of sunlight reflected off the Earth surface at the location of the SSM/I footprint, assuming that the earth surface is a specular reflector. Low sun-glitter angles mean that reflected sunlight is being received by the SSM/I. Note 3. Land and Sea Ice: Percentage land contamination is defined as the percentage of the power received by the SSM/I 19 GHz antenna pattern that comes from land. The ice flag is based on a monthly climatology. A value of ice_flag_res=0 means that we have never seen sea ice at that location and month since the first SSM/I was launched in 1987. Hence, it is extremely unlikely that the footprint will contain ice. The one exception to this is icebergs, which may pass through grid cells located off the East Coast of Argentina, yielding an ice_flag=0 during passage. Note 4. 22 GHz Brightness Temperature: The SSM/I sensor is not dual-polarized at 22.235 GHz. Hence, the conversion from antenna temperature to brightness temperature needs to be done differently. This problem is discussed on page 13 of the User’s Manual: SSM/I Antenna Temperature Tapes, Rev. 1. For V7 we use the following: o TB22V=1.01911*TA22V + 1.93574 TB22V=1.01865*TA22V + 2.05980 (for earth incidence angle of 52.7 ) o (for earth incidence angle of 53.7 ) 4 RSS Technical Document 07032014SSMI These two incidence angles bracket the incidence angle variation experienced the SSM/Is. For incidence o o angles between 52.7 and 53.7 , a linear interpolation is used to find TB22V. Note that the array corresponding to TB22V is called FCDR_brightness_temperature_22V. 4. MISSING TB VALUES A TB value of -100.0 indicates no TB value is available to the User. The fill value of -100.0 TB occurs when the following events occur: a. If quality flags 1, 2, 3 and/or 4 are equal to 1, then all TBs in the scan for all channels are set to -100.0. b. If either the v-pol or h-pol calibration-problem flag is = 1 for a particular frequency, then all TBs in the scan for that frequency, both v-pol and h-pol, are set to -100.0. c. If the Earth viewing count is out of bounds or if the recovered Earth viewing count is not an integer, then the TB just for that observation is set to -100.0. Depending on your reading software capabilities, you may or may not need to check if TB = -100.0 and exclude these missing values. 5. QUALITY FLAG VALUES AND SUGGESTED FILTERING For a given observation cell, look at the T B values required for your particular application. If any of these TB values is -100.0, skip the cell. Also if your application requires the low frequency channels (19-37 GHz) and quality flag 12 is =1, skip the cell. Likewise, if your application requires the high frequency channels (85 GHz) and quality flag 13 is =1, skip the cell. 6. DATA USE CITATION Please acknowledge use of these data in your publications. Development of this type of data set has taken many years and much effort on the part of the scientists involved. These scientists rely on the fair use and proper acknowledgment of the CDR to sustain their professional reputations and careers. Please use the suggested Acknowledgement Request: The SSM/I CDR used in this study was acquired from NOAA's National Climatic Data Center (http://www.ncdc.noaa.gov). This CDR was originally developed by Frank Wentz and colleagues for the NOAA CDR Program. Citation Request: Hilburn, K.A., and F.J. Wentz, 2008: Intercalibrated Passive Microwave Rain Products from the Unified Microwave Ocean Retrieval Algorithm (UMORA). Journal of Applied Meteorology and Climatology, 47, 778–794. NOAA's CDR Program and/or its official distribution partners provide sustained open access to released CDR packages and related information. To ensure use of official products and access to the latest codes, data sets and usage information (e.g., known issues), users agree to not redistribute the CDR, in whole or in part, to others. 7. REFERENCES Users should read this document in conjunction with the earlier versions of RSS SSM/I Users Manuals, which give more details on the SSM/I data history, including: SSMI Version 7 Calibration.Report, January 10, 2012 User’s Manual: SSM/I Antenna Temperature Tapes, Rev. 2, December 1993 User’s Manual: SSM/I Antenna Temperature Tapes, Rev. 1, December 1991 These and other documents are available from Remote Sensing Systems. This document you are reading is primarily intended to describe the format of the RSS V7 netCDF files available from NOAA FCDR program. 5 RSS Technical Document 07032014SSMI 8. netCDF GLOBAL FILE ATTRIBUTES Below is an example of global file attributes for one netCDF file. // global attributes: :Conventions = "CF-1.5"; :Metadata_Conventions = "CF-1.5, Unidata Dataset Discovery v1.0, NOAA CDR v1.0, GDS v2.0"; :standard_name_vocabulary = "CF Standard Name Table (v16, 11 October 2010)"; :id = "RSS_SSMI_FCDR_V07R00_F13_D20030601_S0849_E1041_R42247.nc"; :naming_authority = "gov.noaa.ncdc"; :metadata_link = "gov.noaa.ncdc:C00810"; :title = "RSS Version-7 SSM/I FCDR"; :product_version = "v07r00"; :date_issued = "2011-09-30"; :summary = "Remote Sensing Systems (RSS) Version-7 Special Sensor Microwave/Imager (SSM/I) Fundamental Climate Data Record (FCDR); intercalibrated and homogenized brightness temperature polar-orbiting product with quality flags starting from July 1987"; :keywords = "EARTH SCIENCE > SPECTRAL/ENGINEERING > MICROWAVE > BRIGHTNESS TEMPERATURE"; :keywords_vocabulary = "NASA Global Change Master Directory (GCMD) Earth Science Keywords, Version 6.0"; :platform = "DMSP 5D-2/F13 > Defense Meteorological Satellite Program-F13"; :sensor = "SSM/I > Special Sensor Microwave/Imager"; :cdm_data_type = "Swath"; :cdr_program = "CICS-NC supported Climate Data Record Program for satellites, FY 2011"; :cdr_variable = "fcdr_brightness_temperature_19V, fcdr_brightness_temperature_19H, fcdr_brightness_temperature_22V, fcdr_brightness_temperature_37V, fcdr_brightness_temperature_37H, fcdr_brightness_temperature_85V, fcdr_brightness_temperature_85H"; :source = "F13_r42247.dat"; :date_created = "20120711T053628Z"; :creator_name = "Carl Mears"; :creator_url = "http://www.remss.com/"; :creator_email = "[email protected]"; :institution = "Remote Sensing Systems"; :processing_level = "NOAA Level 2"; :references = "doi:10.1175/2007JAMC1635.1, doi:10.1126/science.1140746, SSM/I Users Interpretation Guide UG32268-900 Rev C 29 Nov 2000"; :history = "1) 2011-09-30, Carl Mears, Remote Sensing Systems, created initial netCDF file converted from the original RSS data format"; :geospatial_lat_min = -87.729996f; // float :geospatial_lat_max = 87.52f; // float :geospatial_lon_min = -180.0f; // float :geospatial_lon_max = 179.98999f; // float :geospatial_lat_units = "degrees_north"; :geospatial_lon_units = "degrees_east"; :spatial_resolution = "19 V/H GHz: 45km X 70km, 22 V GHz: 40km X 60km, 37 V/H GHz: 30km X 38km, 85 V/H GHz: 14km X 16km"; :time_coverage_start = "2003-06-01 08:49:08Z"; :time_coverage_end = "2003-06-01 10:41:13Z"; :time_coverage_duration = "PT6724S"; :license = "No restrictions on access or use"; :contributor_name = "Frank Wentz, Carl Mears"; :contributor_role = "Principal investigator and originator of input/source or antenna temperature data, Processor and author of entire driver routine (write_ssmi_tbs_netcdf.pro) which converts RSS native brightness temperature format to netCDF-4."; :_CoordSysBuilder = "ucar.nc2.dataset.conv.CF1Convention"; 6 RSS Technical Document 07032014SSMI 9. Known Problems/Errata in RSS SSM/I V7 netCDF Data Set The RSS SSM/I V7 netCDF data set files are produced using an IDL program to translate the RSS binary format L1B brightness temperature data files available from RSS. Identified problems are listed below for each data set version: Version 7, Release 0 1. The land_percentage_hires and land_percentage_lores variables each have a valid range of 0. to 100., but the valid range listed in the netCDF file states 0. to 250. The actual range (0 to 100) as opposed to the file metadata (0 to 250) is listed in the table above. 2. The scan_time_lores variable has the wrong dimension. It should be the number of scans for the low resolution channels (1800) but instead was accidentally dimensioned with the number of scans for the high resolution channels (3600). The first 1800 values contain the valid scan times for the variable, the remaining 1800 values remain as the default __fillvalue, -1.0E30. The table above lists the correct dimension that scan_time_lores should be (1800). 7