1
Weather Station Data Logger
User Manual
BETA Version 4.3.0.x
February, 2013
Preface.......................................................................................................... 4
Please Read This Fine Manual!............................................................................4
License Information........................................................................................6
Part I............................................................................................................ 7
System and Hardware......................................................................................9
Getting Started............................................................................................ 10
Arduino..................................................................................................... 12
Part II.......................................................................................................... 13
The WMR100 Anemometer...............................................................................14
Rainfall Data Processing..................................................................................15
Temperature, Dew Point and RH Processing..........................................................18
WMR200 History Processing..............................................................................24
The WMR88 Weather Console............................................................................27
The WMR100 Barometer..................................................................................28
The WeatherJack Barometer............................................................................30
The Arduino Barometer..................................................................................31
Weather Underground....................................................................................33
Citizen Weather Observer Program.....................................................................35
Web Page Upload..........................................................................................37
AWEKAS..................................................................................................... 50
Client/Server Operation..................................................................................51
The Log File................................................................................................ 56
The Message Log...........................................................................................61
The Weather Station Clock..............................................................................62
Battery Status..............................................................................................63
Signal Strength............................................................................................. 64
Program Options........................................................................................... 65
Part III......................................................................................................... 68
The Menu................................................................................................... 69
The Main Display Window................................................................................75
Graph Type (and the graph itself)......................................................................79
The Options Window......................................................................................82
Client/Server UDP and TCP Data Formats.............................................................98
What are Dew Point and RH, Anyway?................................................................103
Arduino.................................................................................................... 106
Building the Software...................................................................................113
Release Notes............................................................................................ 114
Preface
This program has a lot of advanced features, but all the default settings are designed to be
appropriate for the majority of users. Therefore, if you don’t want to get into all the messy
details, just follow the steps in the “Getting Started” section and you should be fine.
This version has two major new features: a client/server mode and support for an Arduino
board to replace the Oregon Scientific base console unit.
The client server mode allows weather data to be shared within a home network so you can
view weather data on any computer connected to your home subnet. This also makes it
possible to create custom plug-ins which can do anything you want with the weather data
broadcast by the server. This includes things like controlling fans and other equipment with
home automation hardware.
With and Arduino board and custom weather shield, the Oregon Scientific base console can be
replaced. The range for wireless sensors is increased significantly and the Arduino shield
includes a much more accurate barometer and indoor temperature sensor too. Arduino can also
receive any Oregon Scientific sensor that transmits the older version 2.1 RF protocol (e.g. the
THGN122NX and UVR128 sensors). Furthermore, Arduino can receive multiple sensors even
when they are all set to the same channel number.
Please Read This Fine Manual!
If you were looking for a simple program that just copies WRM100 data to the hard drive on
your PC, you came to the wrong place! This program is much more than that.
You can install and use the program without reading this manual, but it won’t be long before
you start having questions. You might not understand what you are seeing, or think that there
is a bug in the program. That will be your clue that you need to come back here and start
reading!
Here is a small sampling of questions that are answered in this manual:
•
I just reset the WMR100 rainfall totals, but the data logger is still showing the same
total rainfall as before. What’s up with that?
•
What are all those different wind values reported by the program?
•
Why does the wind graph appear to show different numbers than the wind readout?
•
I have extra temperature sensors but they don’t show up on the temperature graph.
Why?
•
Why doesn’t the WMR100’s comfort level or weather forecast (cloudy/rainy/sunny)
show up in the log file?
The manual is organized into three main parts. First is an introduction and quick start guide.
Next is a description of important program features. This is followed by detailed reference
information.
Philosophy
You’ll soon realize that much of this manual has information that may be beyond the level of
novice users. Attempts have been made to include tutorial information to help the novice user
understand and make use of the more advanced features.
As WSDL grows, it tends to add more and more advanced features. However, it is a constant
goal to provide a program that novices will also find valuable. Please feel free to post feedback
on the SourceForge forums (Open Discussion or Help) related to this idea. What did you find
confusing? How can this program be made easier to use for new users?
The program default settings are chosen to be appropriate for the average novice user. Tabs in
the options window are arranged from left-to-right in order of interest to novice users – start at
the left and work to the right.
Following the steps under “Getting Started” below should get you going quickly. Later feel free
to explore the more advanced aspects of this program at your leisure. It’s much easier to go
slow and take small bites instead of trying to understand everything all at once.
License Information
The Weather Station Data Logger program is Copyright © 2008-2010 by Weber Anderson. It is
licensed under the GNU Lesser General Public License (LGPL).
This software includes the ZedGraph library, also licensed under the GNU LGPL. You can obtain
a copy from http://zedgraph.sourceforge.net. Also included in this software is the USB_HID
library, licensed under the Code Project Open License. You can get a copy of this library from
http://www.codeproject.com .
Copies of the relevant licenses can be found in the installation folder for this program. You can
also get copies from http://www.gnu.org/licenses and from http://www.codeproject.com.
Sample weather icons are copyrighted by www.gstudio.us and are for personal use only.
Commercial use is prohibited.
Part I
Introduction
The Weather Station Data Logger software provides the ability to view, archive, analyze and
share data from Oregon Scientific weather stations. Starting with beta version 2.9.5.1, the
WMR100, WMR200, WMRS200 and RMS300 stations are supported. In version 4.1 and later, the
Arduino board with custom weather shield is also supported. Please post bugs on the
SourceForge help forum.
This software provides the following capabilities:
•
Data capture of all important weather station measurements.
•
Recording and archival of weather data in a portable CSV format.
•
Manual rain data input.
•
Analysis of recorded data.
•
Display of captured and analyzed data with up to sixteen simultaneous graphs.
•
Upload capability to CWOP, Weather Underground, PWS Weather and AWEKAS
•
WebCam support for Weather Underground
•
HTTP web page generation with FTP upload to web servers.
•
Client/server operation, which permits viewing of real-time weather data on other
computers.
•
Custom plug-in clients can be created to receive real-time weather data (some
programming required).
•
Data capture from the Arduino weather shield project, including support for many
Oregon Scientific wireless sensors (using version 1.0, 2.1 and 3.0 RF protocols).
•
History data logged by the WMR200 is captured and added to the weather log in the
proper chronological order.
•
WMR200 historical data is also transferred to Weather Underground and PWS Weather.
This software is available free of charge and is licensed as indicated on the previous page.
Users are encouraged to post bugs, comments and feedback on the software project's forums,
which can be found at this URL:
http://sourceforge.net/projects/wmrx00/forums
The project also maintains a web page at this URL:
http://wmrx00.sourceforge.net
Suggestions and contributions to the project from users are welcomed; please post ideas or
offers for help on the forum. The project does not accept monetary donations.
As of December, 2010 this project is under active development by the author. This will not
always be the case. If you have any feedback or enhancement ideas that could improve the
program, please post something in one of the forums soon!
The appendices that were contained in earlier versions of this document have gotten rather
large and have been moved to separate documents. The appendices can be downloaded
separately from SourceForge. Look under the “Documentation” folder in the full file listing.
Example programs for creating custom plug-in clients are included as a zip file in the
installation directory.
System and Hardware
This software was written to support the following weather station hardware:
•
Oregon Scientific WMR100, WMR200, WMRS200 and RMS300 wireless weather stations.
•
The WeatherJack barometer can optionally be used in place of the built-in barometer
in the Oregon Scientific units.
•
An Arduino board with custom weather shield can be used in place of any of the OS
base stations. The Arduino board does not contain an “atomic clock” and will not
provide weather forecast information.
Support is provided for data collected from the main external sensor packages (anemometer,
thermometer, hygrometer, external rain gage) and the main inside console unit (temperature,
barometer, and clock). Full support is also provided for up to 9 additional wireless temperature
sensors. History data stored in the WMR200 is also supported.
When using Arduino, most OS wireless sensors (versions 1.0, 2.1 and 3.0) are supported. A list
of the currently supported sensors is included in the Arduino section. More sensors can be
added if users post requests in the SourceForge forums.
When using the Arduino Weather Shield, it is possible to place more than one sensor on the
same channel assignment. This is especially useful for example, if you have (for example) five
THGR122NX sensors. These units only have three different channel settings, so they cannot all
be placed on different channels. As another example, two UV sensors can be installed and
WSDL will always report the higher of the two readings. This allows one sensor to be placed to
catch early morning sun while the other is in the optimum location for late afternoon sun.
Partial support is provided for the THWR800A water temperature sensor.
There are a few data items which are not used (or only partially used) by the program, such as
the “smiley” weather trend and sun or rain forecast information.
The software is known to run on Windows 2000, XP, Vista and Windows 7. It requires the
Microsoft .NET runtime version 3.5 or later. Both 32 and 64-bit versions of XP, Vista and
Windows 7 are supported.
If you are using a 64-bit version of Windows, be sure you have the latest updates to the
Microsoft .NET Framework. Crashes have been known to occur otherwise.
Not much memory or disk space is necessarily required by this program. A full year's worth of
data in a weather log takes less than 50MB of storage. On the other hand, frequent log file
backups can cause a fair amount of disk usage depending on the trimmed log size. Having a
large number of graphs on screen in addition to FTP graphics will start to consume a decent
amount of program memory (RAM).
Battery state indicators for the WMR200 may be inaccurate. Work is going on to fix this
problem and a new release will be made available if and when it gets fixed.
Getting Started
Here are a recommended set of steps to follow in getting the data logger software configured
and running.
First, read the rest of this document. If your eyes start to glaze over on certain sections, skip
them but try to remember the topics for future reference. Then, plan to experiment for a
while with the software. You may decide to delete weather logs and options, etc. a few times
before settling on a configuration you are happy with.
1. Decide where on the computer's hard drive you are going to store weather logs and
backups. It is a good idea to store backups on a different physical disk if possible.
2. Install the program and start it – but do not connect the weather station yet. Open the
options window and select the units you want for display and for the log file. Unless
you have a good reason to do otherwise, choose identical units for both the display and
log file (except time zones). For example avoid using degrees F for display and degrees
C in the log file. This is primarily to reduce confusion but WSDL will work just fine if
the log file units are different than the display units.
Choose whatever time zone you prefer for display. DO NOT choose local time, and
instead select a fixed UTC offset (zero offset is not a bad idea) for the log file units.
These settings are highly recommended to avoid trouble down the road. Don't change
them unless you need a different behavior and understand the consequences. You'll
find more on this topic in the reference section of this manual where the Options
Window is explained.
Select the “Hdwr” options tab and specify your weather console hardware
(WMR88/WMR100/WMR200 or Arduino). WMR200 users should normally select the
WMR200 master option and enable history. If you have a Radio Shack console, try the
WMR100 option first – if that doesn’t work try selecting the WMR200.
You should only choose the option to share USB devices if another weather program will
be running at the same time as WSDL.
3. Feel free to experiment with all other option settings.
4. If you change the log file directory, make a note of the prior setting so you can find the
old log file again.
5. When you click “Save” in the options window, one or more warnings may come up
telling you that log file units or other items have been changed. Read the explanation
and click “OK” (or “Cancel” if you aren’t sure about the change) – the program may
exit if certain options have been changed.
6. Start the program again if necessary. In some cases, WSDL will restart automatically so
wait a few seconds before restarting it manually. If you did not change the weather log
directory, you'll get a dialog explaining the log file units have been changed – with
OK/Cancel buttons. Press Cancel. A file dialog will pop up – use it to delete the
weather log file (WxLog.csv). Close the file dialog. At this point, you should get a
notice telling you that a new weather log has been created, and the units have been
initialized. If you look at options again, you should see the same units you set earlier. If
instead, you get a warning that your changes to weather log units have been discarded,
it means you did not delete, move or rename the old weather log. If you have trouble
with this, read the chapter about the log file.
7. Don’t run more than one copy of WSDL at a time, and don’t try to run any other
programs which talk to the weather station simultaneously (like VWS or WD). The
programs sometimes end up “competing” for USB data and will corrupt each other’s
USB data streams. Well okay, later on you can try this if you want and it might work –
but don’t confuse things at first and just keep it simple.
8. Turn on the weather station. Set the proper time zone and station elevation (altitude).
Wait for the altitude change to take effect on the barometer reading. Because the
WMR100’s barometer only updates once every 15 minutes, this can take up a while.
9. Connect the weather station to the computer and the program should start displaying
data within a minute or so. If you don't get data try a kick start (in the File menu) and
check the message log (View menu) for more information. It will require several
minutes’ worth of data before all of the displays become active and fully functional. If
you have opted to have WSDL compute sea-level pressure, it can take up to 12 hours
before SLP data becomes available.
10. If something doesn’t seem to work, check back here first. Many problems are simply
due to improper option settings or a lack of understanding about program operation.
WSDL will not do everything it is capable of “out-of-the-box” without setting up
options for the desired features. Also check the project web site for an FAQ page that
may help answer common questions.
Arduino
What’s an Arduino? To find out, have a look at this web site:
http://www.arduino.cc
This is a very inexpensive little computer board that comes with a simple programming
environment tailored to novice computer programmers. An Arduino program is called a
“sketch”. Arduino accepts plug-in accessories which are called “shields” and there is a custom
shield which contains everything you need to replace the OS base console – a wireless receiver,
barometer and indoor temperature sensor. The shield has no replacement for the “atomic
clock” in the OS console and does not provide weather forecasts, so you’ll have to give those
things up.
How do you get a shield? Well, at this early stage you can download a document that shows
how to build your own shield. Obviously, you need some electronics experience – but not too
much. An effort is underway to create a commercially available shield board – check the WSDL
web site for updates.
Here are the advantages of using an Arduino with custom weather shield:
•
Many folks will discover that wireless reception is much improved. The shield has a
connection for an external antenna which also helps a lot.
•
OS wireless sensors that don’t work with your OS console will work with Arduino. Both
version 2.1 and 3.0 sensors are supported. We don’t have all the different models
decoded yet but you can help with that.
•
The Bosch barometer used on the shield has much higher resolution than the OS
barometer. Instead of new pressure readings every 15 minutes you’ll get them every
minute. This barometer is as good as or better than the WeatherJack unit, and does
not require temperature compensation like the WeatherJack does.
•
The indoor temperature/humidity sensor is much more accurate than the OS base
console, and can be moved several feet away from the Arduino board with a standard
telephone extension cord. It can also be used to calibrate your OS wireless sensors.
•
Multiple wireless sensors can be set to the same channel number and Arduino can still
tell them apart.
•
WSDL can automatically sense battery changes in wireless sensors. There is no need to
press a “Scan” button or reset the console.
•
Multiple UV sensors are supported with the peak readings captured and recorded.
•
Future enhancements may provide support for other wireless sensors such as from
Taylor or LaCrosse.
See the chapter later in this manual about Arduino for more information.
Part II
Program Features
Anemometer Data
An explanation of wind data processing is provided here. This type of weather data goes
through a significant amount of processing by the software.
The WMR100 reports two different wind speeds – gust and average. However, the gust value
appears to be collected over a fairly short time period and is often observed to be less than the
average value. As a result, it was decided that the gust reading would be treated as if it were
the current wind speed – not a gust value.
Every time a wind message is received from the weather station, the raw data (current and
average speed plus direction) is stuffed into a 10-minute buffer. That is, at any given time the
most recent 10 minutes of raw wind data is available.
Once a minute, prior to updating the weather log file, the wind data buffer is analyzed to
produce several results.
1. The largest wind reading in the last minute (1-minute gust). This is based on current
wind data, not the average data.
2. A 2-minute average of direction and average speed readings. Being an average of the
averages reported by the weather station, the effective averaging period may be
longer than two minutes. If someone can figure out what the wind averaging period is,
it would be possible to massage this data to reflect a true 2-minute average. Please
post a message to the wmrx00 forum on SourceForge if you have this information!
3. Minimum and maximum wind direction in the last 2 minutes, plus a flag indicating
whether a variable direction METAR report is warranted.
4. The largest wind reading in the last 10 minutes. Again, this is based on current wind
data, not the average data.
5. Based on the largest variation in current speed over the last 10 minutes, a gusting flag
is set. This is used in the generation of METAR reports.
Analyzed results are used in three places.
1. On-screen METAR display.
2. The weather log file records 1-minute gust and 2-minute average information.
3. Reports uploaded to Weather Underground contain 2-minute average and 10-minute
gust values.
Further analysis of data from the weather log is used to produce the 1-hour gust on-screen
reading. As mentioned elsewhere in this manual, data from the log file is passed through a 30minute sliding window and filtered prior to being graphed.
Rainfall Data Processing
Data received from the weather station includes rainfall rate, rain during the current hour, rain
during the past 24 hours (this does not appear to include the current hour) and total rain (since
the total was last reset). Also available is the date and time when total rain was last reset.
Only rain rate and total rain reported by the WMR100 are stored in the weather log since the
hourly and daily totals can be computed from changes in total rain.
The total rain reset-date is not stored in the weather log. Programs used to post-process the
weather log can detect and mathematically remove rain total reset events; this permits
arbitrary computation of total rain since any desired point in the weather log.
Rain data displays and graphs use data from the weather log instead of directly using the
weather station’s reported values. This choice has a couple of benefits; rain total resets are
handled better, and daily rain can be displayed instead of a 24-hour rain total.
If the option to adjust rainfall totals for resets is enabled (in the options window), additional
processing is performed on rainfall data for display and graphing purposes. When the weather
station (or rain bucket if you are using the WxShield) is reset, total rain amount is also reset.
Sometimes, the station must be reset due to a communications failure, battery change or other
reason. This resets the rain total to zero even if that was not desired. Displaying rain data from
the weather log eliminates this problem. When total rain resets appear in the weather log file,
the software mathematically removes the reset event and keeps building the total rain amount
without interruption. The software only resets rain totals on a user-specified day of each year –
when annual rainfall totals are normally reset.
Another effect of sourcing rain data from the log file is seen in the rain data readout. While the
WMR100 reports rain in the last 24 hours, the data logger software will now display rain since a
user-specified hour of the day, or “Rain Today”. This processing is always performed and does
not depend on the choice to adjust for resets in the options window.
The hour at which daily rainfall totals are reset varies quite a bit around the world. In the UK,
it is 09:00 GMT. Australia uses 9AM local time. In the U.S. there does not seem to be a single
standard – in some places 4PM local time is used; elsewhere it is midnight local time. To cope
with this, WSDL allows the user to specify the hour at which daily rainfall totals is reset, with
optional allowance for daylight savings time.
It is worth mentioning that the log file always contains the raw (calibrated – see below) total
rain amounts reported by the weather station. Total rain resets can be detected in the log data
(they always show up as decreases in total rain) and are never actually removed from the log.
Instead, when software reads the log file, it detects rainfall reset events and artificially
removes them from readouts and plots. Leaving the original total rain data intact allows for
more flexibility in post-processing the log file. Total rain data is multiplied by the user-supplied
calibration factor prior to being written to the log file.
Users wishing to use log file data in other applications must detect and remove rain reset
events themselves. There is also a rain processing tool which can write a “processed” log file
(available in the “Tools” menu). The processed log file will have rain reset events removed
(except for the end-of-year reset).
WSDL also offers the option of counting rain bucket tips where the user provides a calibrated
bucket tip amount. See the appendices for more information on this option (the appendices are
a separate download on SourceForge).
Rain Gauge Maintenance
It is occasionally necessary to move and/or dismantle the rain gauge for cleaning or other
reasons. Any rain bucket tips that occur during such maintenance activities do not represent
actual rain and should not be counted.
WSDL has a feature (introduced in beta version 4.2.8.7) that can be enabled during
maintenance; rain bucket tips are ignored when this option is enabled. As a reminder, the rain
data readout in the main window is replaced with the text “Down for Maintenance” while this
feature is enabled.
This feature ONLY works when rain bucket tip counting is enabled, AND when rain totals are
generated from tip counts. When the following requirements are met, the Tools menu will
contain a Rain Gauge Maintenance option.
1. The current weather log must contain bucket tip counts.
2. The option to count bucket tips in new log files must be enabled in the Log tab of the
options window.
3. The “Rain bucket tip counting” option must be selected as the “Rainfall Processing”
option in the Units tab of the option window.
If these requirements are not met, the Tools menu in the main window will not contain an
option for rain gauge maintenance.
When enabled, any increases in reported rainfall do not cause the recognition of new bucket
tips. Furthermore, all reported rain rates are forced to zero while maintenance mode is
enabled.
After maintenance is completed on the rain gauge, it is a good idea to wait at least two
minutes before turning off the maintenance feature. This allows for any unwanted bucket tips
to be transmitted by the rain gauge.
Decoded rain messages in the message window/panel are flagged with a label to indicate that
maintenance mode is active, but the originally reported rain value and rate is still printed
here.
Before disabling maintenance mode, it may also be desirable to wait for the reported rain rate
values to go back to zero. Use the View...Enable...Decoded Messages menu option and
View...Message Panel or View...Message Window to check the reported rain rate prior to
turning off maintenance mode. It can take quite a long time for the reported rainfall rate to
return to zero so be prepared to wait.
At least some OS rain gauges will report an extremely high rain rate (e.g. 39.33 inches per
hour) if the bucket is manually tipped faster than some threshold rate. If a very high rate like
this is seen in the message panel, it is probably caused by tipping the bucket by hand very
quickly.
For those using WMR200 consoles, the rain gauge maintenance feature is ignored when
processing history data.
Calibration
The options window offers the ability to enter a calibration factor for rainfall reported by the
weather station. All reported values are multiplied by this factor upon receipt and the
corrected numbers are stored in the weather log. This is explained further in the section that
covers option settings.
Manual Rainfall Data Input
Some users (e.g. CoCoRahs members) may prefer to measure rainfall using a manual rain gage
instead of the OS wireless rain bucket. It is possible to enter this data manually into WSDL if
the OS rain gage is not being used.
When using this option, the OS rain gage should be turned off (no batteries). If wireless
transmissions are being received from a rain gage, they will be ignored.
When manual rainfall input is enabled, the following option settings are required. The options
will be forced to these settings if necessary:
•
In the “Units” tab, the rainfall data source will be “Adjusted for resets”.
•
In the “Calibration” tab, the rain gage scale factor will be 1.0000.
When a manual rainfall amount is entered, either one or two entries will be made in the CSV
log file. The first entry will be the amount of rainfall entered. If the amount is not zero, then a
second zero entry will be made one minute later. The second entry is required for proper
operation of WSDL’s rainfall processor.
The first entry will be made up to one minute after the data is entered. The second entry (if
required) will be made one minute after the first entry. Thus, it can take up to two minutes for
the manual rainfall entry process to be completed. During this period, if an attempt is made to
make another rainfall entry, an error dialog will pop up. If WSDL is closed or the computer is
shut down during this two minute period, rainfall entries may not be properly recorded.
Rainfall data entries can be positive or negative – this allows correction of previous entries by
adding small offsets afterwards. Manual entries are tagged with the time and date they were
made. For now, it is not possible to change the time or date of the entry once it is made.
Beginning with beta version 4.2.2.1, WSDL will write empty or null field values in the weather
log for rainfall amounts except at those points where manual rainfall values are entered. Prior
to this, zeros were written if no manual input was available. This change was made so that
manual inputs of zero rainfall for one day could be distinguished in the log file.
Temperature, Dew Point and RH Processing
The Weather Station Data Logger can adjust raw temperature and relative humidity readings
prior to display and logging of this data. Calibration offsets are available for temperature and
humidity readings. Optionally, very high humidity readings can be further adjusted as explained
below.
Temperature
The most recent temperature readings are used for display and logging purposes. Except for
FTP web page uploads, a five-minute average of temperature is used instead. Therefore, the
data you see on either Weather Underground or MADIS may differ slightly from the displayed or
logged values. The five minute averaging process is recommended by CWOP.
Relative Humidity and Dew Point
These are two different ways to talk about how much moisture (i.e. water vapor) is in the air.
Both of these number have the potential to be ambiguous (more so with relative humidity than
with dew point). There is a section below which discusses these ambiguities and how WSDL
deals with them.
Dew Point
WMR100 sensors report temperature in degrees Celsius and relative humidity (RH) in percent.
Temperature is reported with a resolution of 0.1C (or 0.18F), and humidity has a resolution of
1%. Dew point is not reported directly, but computed from temperature and RH within the OS
base console. The WxShield only receives temperature and RH; WSDL must compute dew point
in this case.
If dew point data from the WMR100 console is examined carefully, it appears quite “chunky”
and although the data resolution is 0.1C, the actual resolution appears to be much larger than
this. For reasons of aesthetics mostly, the WSDL program uses reported temperature and
relative humidity to re-compute a dew point value. The resulting dew point graphs are
smoother. See the notes toward the end of this section on accuracy.
Wireless data received by the WxShield only contains temperature and relative humidity, so
dew point is always calculated by WSDL in this case.
Conversion between relative humidity and dew point is not trivial, and WSDL uses some fairly
advanced and accurate formulas and curve fits to implement the conversion (details below).
Web uploads to CWOP contain the relative humidity, but do not include dew point. Data
uploads to Weather Underground use a 5-minute average for dew point.
Relative Humidity
As recommended by CWOP, relative humidity (RH) is reported using a one-minute average – but
since the wireless sensors only report about once per minute this usually amounts to no
averaging at all.
Separate Temperature and Humidity Sensing
It is now possible (version 4.3.1.0 and later) to split the measurement of temperature and
humidity for internet upload (CWOP, WxUnderground, etc) between two sensors. Two different
but related situations experienced by the author led to the addition of this capability.
1. Discovery of a technique for improving temperature accuracy of OS sensors through
thermistor replacement also results in inaccurate RH measurements from the upgraded
sensor. More information on improving sensor temperature accuracy is available on the
web site http://www.osengr.org. Look in the download page for a zip file name “OSThermistor-Calibration.zip”.
2. Placement of a humidity sensor within a fan-aspirated solar radiation shield can subject
it to high levels of dirt and dust; this can cause failure in as little as 12 months. This
sort of contamination is much less of a problem with the temperature sensor
(thermistor).
A good solution to both of these problems is to use one (temperature-only) wireless sensor in a
fan-aspirated shield and a second sensor in a naturally-aspirated shield for humidity
measurements.
The WSDL options window now offers (in the Hardware tab) the ability to choose two different
sensors for internet uploads. One sensor reports temperature while the other reports humidity.
WSDL assumes that both sensors are subjected to the same concentration of water vapor (i.e.
the dew point is identical for both sensors), but realizes that one sensor may be at a slightly
different temperature than the other. For example, the fan-aspirated sensor will often be at a
lower temperature on sunny days. Based on this temperature difference, WSDL will adjust RH
values from the “humidity sensor” to match dew point values at the temperature reported by
the “temperature sensor”. The net effect is that both sensors display the same dew point.
Simple Temperature & Humidity Calibration
There are options to make adjustments to temperature and humidity readings if your sensors
have significant errors. You may have the ability to determine the amount of error in your
sensors, for example by comparison with neighboring weather stations, CWOP analysis or
comparison to more accurate sensors like the SHT15 sensor attached to a WSDL WxShield.
Corrections may be applied to temperature and humidity readings in two different ways,
through relatively simple offsets or by means of a multi-point calibration table for the more
advanced user. First, the simple offsets will be discussed; one for temperature and two for
humidity.
Temperature Offset
This one is very simple – a single number that is added to all temperature readings from a
specific sensor. Each temperature channel has its own offset value in the options window.
Simple Humidity Corrections
There are two correction offsets available for each sensor. The first value (called “offset”) is
intended to make adjustments to the RH reading if it is in error at lower humidity readings
(below 80%). The second (called “max”) adjusts high humidity readings (above 80%) to achieve
a 100% reading when the air is saturated. These two are a bit more than the simple offset
provided for temperature and are discussed in detail below.
Humidity Offset
Errors in relative humidity (RH) readings are most likely not constant across all values of RH.
For example, if the sensor reads 35% when the true RH is 30% an offset of -5% would be correct.
This same sensor however is unlikely to show the same -5% offset when the true RH is 60% -- in
fact the error is likely to be less. As a result, the offset specified in the calibration table is
reduced as RH values reported by the sensor increase. This reduction is done in a smooth
(linear) fashion; the full offset is used at RH values of 30% (and below) and gradually reduced
to zero at a reported RH value equal to the RH maximum (discussed next).
Humidity Maximum Adjustment
After applying the humidity offset described above, the result will be adjusted again if it is
above 80%. The purpose of this offset is to get the reported reading up to a full 100% when the
air is saturated. This is done because the OS sensors never report RH values above 98%. To get
this up to 100%, a smoothly (linearly) increasing offset is added to RH readings – starting with
zero at 80% and increasing to a 2% offset when the reading is 98% -- this bumps it up just
enough to read a full 100%. However, to handle the case where your sensor may report less
than 98% when the air is saturated, the 98% limit is also selectable and is called “MAX” in the
calibration offset table.
The two corrections are applied in order – the humidity offset is computed and applied first.
The result is then adjusted for MAX if it is above 80%.
Multi-point Temperature & Humidity Calibration
Starting with WSDL beta version 4.2.1.4, a multi-point calibration table can be specified to
provide calibration offsets that vary according to the sensor reading (temperature or humidity).
For now this is a fledgling capability and users must hand-edit the project settings file to
enable them. Future beta versions of WSDL will provide more complete support for this
feature.
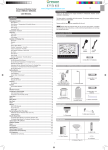
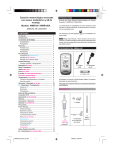
Errors in temperature and humidity may not be constant. For example the temperature may be
high by 2ºF when it is 50ºF, but the error might be -2ºF when it is 90ºF. You can supply some
number of temperature/offset data pairs. In this example there would be two pairs: {50,+2}
and {90,-2}. WSDL will apply the requested offset at the indicated temperature. For
temperatures in between the listed values, WSDL will draw a straight line between the two
points to determine the correction. The graph below shows this concept. For temperatures
outside the range of supplied values, the offset associated with the nearest value is used. In
the example one additional correction has been added of +3ºF when the sensor reading is 30ºF.
The straight lines drawn on the graph shows how WSDL interpolates correction between the
values in the table, and how it extends the first and last values without further interpolation.
M u lt i- p o in t T e m p e r a t u re C o rr e c t io n E x a m p le
4
3
C o rre c t io n , °F
2
1
0
-1
-2
-3
0
20
40
60
S e n s o r R e a d in g , °F
80
100
120
Entering Multi-point Calibration Data
The “Tools” menu has an item that will bring up an edit window for multi-point calibration
data. The window itself should be self-explanatory.
If multi-point data is entered for one or more sensors, the single-point calibration data found in
the Options window cannot be edited for those sensors.
WSDL versions starting with 4.2.8.7 can load humidity corrections from CSV files. The rules for
these files are simple:
1. All lines beginning with a “#” character are ignored as comments.
2. Each data line must contain exactly two decimal numbers separated by a languagespecific delimiter character. In US-English, the delimiter is the comma character.
3. All numbers must be in degrees Celsius; the first column contains a temperature at
which the correction value in the second column should be added to the value reported
by the sensor.
Useful Notes
This section wraps up with some notes on calibration and measurement of temperature and
humidity.
Comments on Humidity Calibration
The current set of offsets for humidity calibration is less than ideal. They make assumptions
about sensor errors below 80% that may not be correct. This is further complicated by the fact
that measuring sensor errors in RH is beyond the means of most amateur weather station
owners.
For most people, the only way to get any idea of sensor performance is by comparing readings
with nearby stations known to have accurate equipment – airports and official NOAA stations
for example. If the nearest official station is too far away then comparisons may not be all that
useful. CWOP analysis of your weather data can also be useful.
Setting the RH Offset
These corrections are a bit complicated than simple offsets and you will notice that in most
cases, the correction value you enter in the calibration table is not the value that actually gets
applied. This section describes a couple of ways to get the corrections you need.
The simplest way is just by trial and error. Enter and offset and then increase or decrease the
value until you get the desired result. Alternatively, use one of the formulas below to compute
the required offset value. Below, the term “Correction” refers to the adjustment actually
applied to the senor reading, while “Offset” refers to the number entered in to the calibration
table in the Options window.
Correction = Offset * (MAX – RH) / (MAX – 30)
Offset = Correction * (MAX-30) / (MAX – RH), but only for 30 < RH < 80
For an example, say the reported RH reading is 50% and you want to bump it up 4% to 54%. If
MAX is set to 98%, the required offset is given by the second formula:
Offset = 4 * (98-30) / (98-50) = 5.67%
More Detail on RH Maximum Readings
You may have noticed that when it's raining or foggy outside, relative humidity is not reported
as 100%, but perhaps only 95% or 98%. The WMR100’s console unit and the dedicated outdoor
sensor (channel 1) will report a maximum of 98%, while the THGR810 wireless sensor’s
maximum reported RH is somewhere between 95% and 98% (see below).
WSDL offers the option (enabled by default) to adjust humidity readings so that a reported
value of say, 98% will be displayed and logged as 100%. This is partly provided for aesthetic
purposes, and there is reason to believe that accuracy may be (very) slightly improved in the
process.
Relative humidity sensors are most accurate over the middle part of the scale – say from 30% to
70% for example. These sensors tend to be much less accurate above 80% and below 20% RH.
The author has spent some time observing RH sensor readings as the air becomes saturated
(due to rain and/or fog). The WMR100 sensors do seem to report steadily increasing RH values
right up to the point of saturation. It is therefore reasonable to conclude that the sensor can
distinguish for example, between 100% and 98% RH conditions. If on the other hand, the
sensor’s reading was internally limited at a true 95% RH, then you would expect to see the 95%
reading reported before the atmosphere was actually saturated.
Finally, users should not get the impression this is guaranteed improve the accuracy of the RH
sensor. There is a non-zero probability that it could make the readings less accurate.
Remember, these corrections are only applied in increasing amounts as the RH exceeds 80%. No
corrections are applied below 80% RH. These corrections will always have the effect of
“bumping up” the dew point reading when RH is above 80%.
Watching the RH readings while fog forms, you can get an idea whether to use the RH
calibration feature. The humidity will not truly be 100% until there is visible moisture in the
air, so if your sensor continues to show increasing readings right up to the point where fog
forms, then you will probably get some benefit from this feature. Also, keep in mind that the
RH sensor readings are not instantaneous – there is a time lag of a few minutes.
To keep things in perspective, if the RH calibration setting is 98%, the maximum upward
correction in dew point will be no more than 0.7 deg F. For a RH maximum setting of 95%, dew
point will be adjusted upwards by no more than 1.7 deg F. These values are really worst case
as they were figured for an outdoor temperature of 100 deg F, and will be significantly less at
lower temperatures.
Some More Details on Converting from RH to Dew Point
For those interested in the details of computing dew point, WSDL now uses equations published
by Arden L. Buck (NCAR) in 1981. These include a small correction factor for moist air which
improves accuracy slightly over what was used in releases prior to 2.8.8. The improvement is
very slight – previous versions of WSDL were plenty accurate without this change.
Corrections for Maximum RH Value
For the maximum RH tweaks, a linear correction is created which starts at zero for an 80% RH
reading, and linearly increases such that the user-specified reading becomes 100%. If the raw
reading exceeds the user specified maximum, the RH value will be pegged at 100%.
WMR200 History Processing
Versions of WSDL after (but not including) 4.2.0.0 provide support for historical data stored in
the WMR200 console. Upload of history to Weather Underground and PWS Weather is also
supported.
Data retrieval is slow; on average about 250 history records can be transferred per minute.
Assuming the WMR200 stores history data once per minute, it takes about six minutes to
transfer one day’s worth of stored historical data from the WMR200.
Exiting WSDL or disconnecting the WMR200 during the history collection process can result in
loss of both historical and buffered live data. DO NOT exit WSDL or disconnect the WMR200
during history collection. It is also recommended that the USB connection not be shared with
any other software during history retrieval.
When WSDL exits, if the WMR200 is connected and the WMR200 Master option is enabled, a
command is sent to the WMR200 which causes it to stop sending USB data and start logging
data internally. See the chapter about WSDL options (the “Hdwr” tab) for more information
about connection options for the WMR200.
History collection can be disabled in the options window. Be warned that if the WMR200 Master
option is also set, then WSDL will erase any history data in the WMR200 whenever it is
connected.
Historical data retrieval proceeds in four phases as follows:
1. The WMR200 is initialized and begins dumping historical data intermixed with live data.
During this phase both historical and live data are buffered in separate locations. The
goal of this phase is to collect a few live data records (four or so) from which WSDL will
compute the difference between the WMR200 clock and the computer’s clock. This
typically requires less than a minute, depending on how many external sensors are in
use. The computed offset or adjustment is printed in the message log and will always
be an integral number of minutes. If the computer’s clock is in sync with the WMR200
clock, the offset will either be zero or plus or minus one minute.
2. After the clock offset is determined, all buffered historical data is adjusted for the
clock error and sent to the weather log. Data identified for internet upload is placed in
an upload queue (there are separate queues for each provider, for example Weather
Underground and PWS weather) This phase requires very little time to complete
3. In this phase, continuing historical data is corrected for clock error and immediately
sent to the weather log. Any live data received continues to be buffered.
Both historical and live data are queued for internet upload; live data will be
interspersed with historical data in the upload queue(s). During this and subsequent
phases, queued upload data is transferred over the internet as time permits. With a
fast internet connection, uploads will tend to keep pace with historical data from the
WMR200. Over a slow dial-up connection, uploads will tend to lag behind incoming data
and will not complete until sometime after history collection has terminated.
This phase lasts until historical data transfer stops – typically about six minutes for
each day of historical data stored in the WMR200. This phase ends after a short period
(around 10 seconds or so) elapses without any history data records being received.
4. In this last phase, history collection is terminated and any buffered live data is sent to
the weather log. Buffering of live data is then terminated and WSDL returns to its
normal data collection process. This phase also executes very quickly.
While history retrieval is active, the WSDL window’s title text is changed to indicate that
history is being collected. When phase (4) above is finished, the window title reverts to its
standard value.
If there is only a small amount history data, most of the time is spent in phase (1) waiting to
determine the clock offset and in phase (3) waiting for the data timeout to occur. When large
amounts of history are present, most of the time will be spent in phase (3) collecting the
actual history data.
Because time stamps are truncated to exact one-minute intervals, history data will sometimes
fail to line up exactly with existing weather log data. As a result, one or more historical or
buffered live data records might be discarded if the time stamps overlap. This event will be
annotated in the message log if it occurs. It is also possible that a one-minute gap may occur in
the weather log at the beginning or end of a history data transfer.
Messages are written to the log file during and after historical data transfer. Additionally, the
USB message count in the main window will be seen to increment rapidly while historical data
is being received.
Calibration adjustments are performed on historical data, the same as with live data.
Until historical data queued for internet upload has been transferred, the upload counter(s)
will increment more frequently than usual – once for each historical or live data record
uploaded. The upload timer indicates the amount of time elapsed since the last piece of
queued data was uploaded.
History data can only be uploaded to Weather Underground and PWS Weather. Uploads to
CWOP, AWEKAS and FTP transfers do not support historical data for the following reasons:
•
CWOP does not support upload of old data.
•
AWEKAS data uploads always over-write previous data so historical uploads will not work.
•
FTP transfers of historical data do not make sense because each upload would over-write
the previous one in rapid succession.
During the transfer of historical data, WSDL readouts and graphical displays may not be up-todate or completely accurate. Some users may wish to restart WSDL after a large history update
has completed.
There are a few differences in data processing of historical data compared with live data:
•
The Weather Jack barometer is not supported. Even if Weather Jack is enabled,
WMR200 barometer readings will be used for historical data additions to the weather
log.
•
If WSDL is configured to compute sea-level pressure from the WMR200’s station
pressure reading, and history data collection is less frequent than every five minutes,
the SLP computations may not be available.
•
Wind data processing normally performed on data from the console to obtain average
and gust speeds data is not done.
•
If the WMR200 is disconnected and WSDL is configured to support WMR200 history data,
then WSDL will stop making entries in the weather log. This is done to leave space for
historical records that could be received when the WMR200 is re-connected.
Finally, it is important to understand the intended use of WSDL in capturing historical data
from the WMR200. The following assumptions are made, and must be met if historical data
collection is work properly.
•
When a WMR200 console is connected to WSDL (or when WSDL first starts up), it is
assumed that any historical data will be newer than the last entry in the current
weather log. Any historical records older than the last weather log entry will be
discarded.
•
WSDL must be able to transfer the entire set of historical data without interruption
(i.e. without being shut down or having the WMR200 disconnected). If an interruption
occurs, most of the historical data transferred up to that point will already be saved in
the weather log, but any buffered live data will be lost. The WMR200 will continue to
store historical data not yet transferred to WSDL.
•
Due to time stamps being adjusted to exact one-minute boundaries, a few records of
historical and/or buffered live data may be discarded due to time stamp conflicts. It is
also possible that one-minute gaps may appear in the weather log at the beginning or
end of historical data segments.
There is one (unlikely) scenario where more than a few WMR200 history records would be
discarded – in other words, don’t do this:
•
Run WSDL with the WMR200.
•
Disconnect the WMR200 USB cable.
•
Run WSDL with a different physical weather console – it could be another WMR200 or
any other hardware supported by WSDL. Say, for example the other console is plugged
in for 3 days.
•
Re-connect the original WMR200. At this point, there will be (for example) 3 days
worth of history records stored in the WMR200 whose time stamps overlap data already
in the weather log. These history records from the original WMR200 will be discarded.
The number of discarded records will be noted in the log file.
The WMR88 Weather Console
WSDL also supports the WMR88 console unit. Being less expensive than the WMR100, this unit
has some differences in the data it sends to the computer.
While the WMR100 sends wind data about every 15 seconds, the WMR88 only sends this data
roughly once a minute (perhaps every 50 seconds or so). Also, with the WMR100 wind data
clearly includes both average and gust speed values. Although the WMR88’s wind data message
is in the same format as the WMR100, the average and gust values are reported to be identical
by at least one user.
The conclusion is that WMR88 wind data is either average-only or gust-only values.
A second difference in the data stream is in regards to forecast icons. The WMR100 only
transmits five different forecast values while a sixth value has been seen from the WMR88 by
one user, and there may also be a seventh (unconfirmed). WSDL has been updated (starting
with beta version 4.2.1.1) to recognize the extra forecast values from the WMR100 (won’t
occur) and the WMR88.
Other than the differences discussed above, the WMR88’s USB data stream is formatted
identically to the WMR100. Since the WMR88 transmits data less frequently WSDL must use a
longer time interval when deciding that the unit needs an automatic kick-start. As of now, that
is the only change that occurs under the hood when selecting the WMR88 in the hardware tab
of the options window.
Anemometer Data
It has been discovered (thanks to SourceForge user “blackadderajr”) that the WMR88 console
does not use every radio transmission from the WGR800 anemometer. The wind speed reading
reported by the WMR88 console over the USB interface is the average speed and direction of
every fourth value transmitted from the WGR800 senor.
The WGR800 transmits wind data every 14 seconds – this means the WMR88 console outputs
wind data every 56 seconds (4 times 14 seconds is 56 seconds).
WMR88 USB data packets have the same format as WMR100 packets – they include data for both
average and gust wind speed. However, in the case of the WMR88 both values are identical and
appear to contain the average speed from every fourth transmission received from the WGR800
anemometer. Therefore when using the WMR88 with WSDL, wind gust data, displays and graphs
are meaningless – they contain the same data as average wind values.
The WMR88 manual states that the anemometer sends data every 56 seconds. Technically, this
is not true – the anemometer transmits every 14 seconds and the WMR88 only uses one out of
four transmissions from the anemometer.
The WMR100 Barometer
The WMR100 console provides two different barometer values. The first is called “station
pressure”, also known as QFE; this is simply the actual pressure being measured by the
WMR100’s barometer. The second value is (probably) “sea level pressure” (SLP) which is
determined by mathematically simulating the atmosphere – in essence guessing what the
barometer would measure if it were lowered to sea level through an imaginary hole drilled in
the ground. This “guess” is based on (among other things) an elevation which the user enters
into the WMR100 console.
SLP
The act of “guessing” what sea level pressure (SLP) would be based on station pressure is
tricky. In fact, the higher your elevation is, the trickier it gets. There are several ways to do it
and none of them can really be considered the only “correct” method.
There is some confusion about the WMR100’s SLP reading, as the user manual only makes a
vague reference to “sea level”. The author has attempted to reduce the WMR100’s station
pressure reading to sea level with commonly used formulas, and none of the results agree with
the WMR100’s sea level reading – that is unless the indoor temperature is used in the formulas.
If this analysis is correct, the SLP reading provided by the WMR100 will only agree with
accepted methods when the indoor and outdoor temperatures are equal.
So, if you live at a high elevation (in Colorado, for example), there is a big problem. On a cold
winter day, the outdoor temperature might be 10 ºF but indoors it is a nice, comfortable 68 ºF.
The WMR100 will compute SLP assuming a temperature of 68 ºF when it should be calculated
using 10 ºF. This will create large errors in the SLP value.
Because of this suspected mistake, WSDL offers the option to compute SLP independently from
the WMR100. WSDL incorporates the same method used by National Weather Service ASOS
stations. This method for reducing station pressure to SLP uses the station elevation, current
temperature and dew point plus a 12-hour temperature average. Also, if the elevation is above
1000 feet, the station’s normal annual temperature and normal annual dew point (more on
this below) are required.
For WSDL to properly compute SLP, the user must enter two additional pieces of information
into the options dialog window. First, the elevation of the WMR100 console must be entered in
the Upload tab under the CWOP information section. This should be the elevation of the
console – if it is on the second floor of your home, 15 feet above ground level this should be
taken into account.
The second piece of information is only required if the elevation is 1000 feet or more. It is the
normal temperature where you live. This is not easily figured out – but luckily WSDL provides
a tool for this purpose. In theory, a normal annual dew point is also required, but WSDL deals
with that behind the scenes automatically. For ASOS stations (which report SLP), NOAA experts
experimentally determine these values on a station-by-station basis. You probably won’t have a
lot of luck getting a team of meteorologists to come out and determine your “normal
temperature”.
So what can you do? If your elevation is 1000 feet or less, you don’t need to worry about it.
Otherwise, locate a nearby airport that has a METAR report that includes SLP. On the
aviationweather.gov website (for US airports), you can get individual METAR reports plus cycle
files that will contain the 12-hour old data you’ll need. In WSDL’s tools menu, select the
normal temperature calculator option. Follow the directions and you will have your normal
temperature. The performance of this method is still under investigation by the author. While
the accuracy of this process is not known, it is in all likelihood more accurate than the SLP
value from the WMR100.
QNH
Another way that station pressure can be reduced is called “altimeter setting” or QNH. This
pressure value is used extensively by pilots – it is the number they must dial into an aircraft’s
altimeter so that it reads correctly when on the runway. It is common to see a difference
between QNH and SLP and this difference can become large at higher elevations.
Reducing QFE to QNH is much simpler than computing SLP. The formula only considers the
station elevation and does not take temperature or humidity into account.
Data uploads to CWOP require that QNH be reported instead of QFE or SLP. Therefore, WSDL
includes the ability to reduce station pressure to QNH. This process uses the station elevation
entered into the “Station” tab of the options dialog. If you choose to display QNH in the
barometer window, then be sure an accurate elevation has been entered – otherwise the QNH
readout will be wrong.
The WeatherJack Barometer
The WMR100 barometer has a resolution of 1 mb or 0.039 inHg. This is a fairly coarse resolution
and is useful for watching major storm systems coming through. On the other hand, normal
diurnal (twice daily) fluctuations in pressure are difficult or impossible to discern. Also, the
WMR100 pressure reading only updates once every 15 minutes.
There is another inexpensive alternative however – the WeatherJack barometer. This
barometer has a resolution of 0.004 inHg – roughly ten times that of the WMR100! Experiments
by the author have shown this can indeed be a very accurate and sensitive addition to your
weather station, and you’ll get a new reading every minute instead of once every 15 minutes.
To get the excellent performance this unit is capable of however requires a rather technical
user, construction of a precision power supply and temperature calibration. Because of this
limitation the details are only presented in an appendix to the user’s manual. Those interested
should download the appendix from SourceForge for further information. It is available in the
“Documentation” section of the download area.
Unless you are using the WeatherJack barometer, the WeatherJack tab in the options dialog
should be ignored.
The Arduino Barometer
Well, it’s really a Bosch barometer – the BMP-085 to be exact. It is included on the custom
weather shield for Arduino. It has a resolution as good or better than the WeatherJack but with
less temperature sensitivity.
Temperature sensitivity tests have not bee performed yet, however it is hoped that the only
calibration this barometer will need is a single pressure offset to bring it into agreement with a
nearby official reading.
The barometer will be automatically configured and used when the Arduino board is enabled.
Atmospheric Tides
Versions of WSDL starting with the 4.2.6.0 patch feature the ability to analyze, estimate and
remove atmospheric tidal variations from barometric pressure graphs. This will have the most
dramatic affect with a high resolution barometer (i.e. the WeatherJack or WxShield
barometers). However, improvements may also be noticeable with the barometers built into
Oregon Scientific weather stations.
Caused largely by solar heating (with minor contributions from things like lunar gravitational
effects), atmospheric tides vary in size with latitude. They are largest at the equator, with
peak-to-peak variations around 2mb or 0.06 inHg, dropping to around half that at 40 degrees
north or south latitude, and growing progressively smaller approaching the poles.
Pressure variations due to atmospheric tides are super-imposed upon other natural variations in
pressure, such as those caused by the passage of high and low pressure systems and
thunderstorms. If your interest is mainly in barometric pressure fluctuations related to
weather, then the presence of daily tidal variations simply confuses the picture. If tidal
fluctuations can be removed from barometric pressure data, weather-related fluctuations will
be much easier to see and understand.
The analysis of atmospheric tides is an extremely complex subject. Fortunately there is a
relatively simple way to produce an accurate estimate of daily tidal fluctuations, which can be
used to remove tidal variations from barometric pressure data. It works by looking at several
weeks of recent barometric pressure data. A mathematical analysis tool called the “Discrete
Fourier Transform” is used to identify any variations in the pressure record that repeat
precisely every 24, 12, 8 or 6 hours.
Weather Underground and PWS Weather
WSDL can upload weather station data to Weather Underground on a periodic basis. Although
Weather Underground does not have strict requirements for the installation of your weather
station, it is still highly recommended that you spend some time making sure the station is
properly “sited” if you plan to upload weather data. The Weather Underground web site has
some good information on this topic.
The following data is uploaded.
•
Outdoor temperature (5-minute average), dew point (5-minute average) and relative
humidity (1-minute average).
•
The “Sea Level Pressure” reported by the WMR100. This is computed internally by the
WMR100 using the altitude you enter into the WMR100 base unit.
•
Wind (two minute average and 10-minute gust).
•
Rain (since midnight and within the last hour).
Sometimes, data is invalid when an upload occurs. For example, assume that data from the
temperature sensor is not being received. When the upload timer expires, WSDL will still
perform the upload but will omit the temperature data. Although this is a valid operation, the
upload site (e.g. PWS Weather or Weather Underground) may choose to graph the missing data
as a big spike. Some users may wish to avoid this and there are two options in WSDL for this
purpose. The first option will prevent uploads from occurring if temperature data is invalid.
The second option prevents uploads if any data is invalid – this is a more stringent requirement
and can result in frequent upload cancellations if any of the wireless signals are a bit weak.
These options also effect CWOP uploads (see the next section).
Temperature and dew point data comes from a user-specified wireless sensor. The original
WMR100 used a temperature sensor integrated with the anemometer. The ideal location of the
anemometer (10m high) is different than the ideal temperature sensor location (5 feet high).
Some users may wish to install a THGR800 or THGR810 sensor in a custom radiation shield at
the proper height and use this data instead.
Uploads can be configured and enabled in the options window. If you are going to upload data
to CWOP it would be somewhat redundant to also configure Weather Underground uploads –
WU will pick up the data feed from CWOP automatically. This is not completely redundant
however as data can be sent to WU much more frequently than to CWOP. See the CWOP
section below for more information.
Occasionally, uploads will fail. Upload failures are logged in the message log. By default, the
program tries to make an assessment as to the nature of the failure: is it transitory or
permanent (fatal)? If an upload fails and the cause is determined to be permanent, further
uploads will be automatically disabled and the options are updated to reflect this. Transitory
errors are logged, but otherwise ignored and upload attempts will continue.
One example of a “fatal” error is an invalid Weather Underground user ID or password. This is
not likely to get fixed until the user edits the stored information, so further uploads will be
disabled. The user will need to correct the ID and/or password, and then re-enable uploads.
A failed Internet connection to the Weather Underground web site is considered non-fatal. In
this case, the program will continue to attempt periodic uploads as long as the feature is
enabled.
Fatal errors can be disabled in the options window (under the “Upload” tab). When disabled,
all errors are considered non-fatal and WSDL will keep re-trying the upload operation.
PWS Weather uploads are configured the same way as Weather Underground.
Webcam Support
Beginning with version 4.2.3.5 of WSDL, webcam images can be uploaded to WU (via FTP). To
configure this, first login to WU and register a webcam. You will receive a webcam ID which
must be entered in the WU tab page of the internet options window. Then click the camera file
button and select the file to be uploaded. It MUST be a JPG image file less than 150k bytes in
size. Make sure you have a valid password entered and check the box to enable web cam
uploads. Finally, switch to the FTP tab page, set the desired upload interval and check the
Enable box. Webcam images are uploaded to WU on the FTP upload schedule – NOT on the WU
upload schedule.
You may need to run an additional program to capture the web cam image prior to the upload.
This can be accomplished with the FTP Pre-processing capability which is configured on the FTP
tab page.
Citizen Weather Observer Program
Versions of the program starting with 2.8.8 can also upload data to the Citizen Weather
Observer Program (CWOP). This data finds its way onto NOAA MADIS servers and is used by NWS
forecast offices and professional meteorologists. You can find out a lot more about CWOP from
this web page:
http://www.wxqa.com
Since the data sent to CWOP is used by NOAA and professional meteorologists, you will want to
be sure your weather station is properly installed, or “sited”. The following wiki page will give
you complete instructions for setting everything up correctly:
http://info.aprs.net/index.php?title=Weather
A very good guide (CWOP_Guide.pdf) can be downloaded from this page. Be sure to read
through this document carefully, and make sure you feel comfortable with the guidelines
before proceeding.
Once the weather station is properly installed, you will need to accurately determine the
latitude, longitude and elevation of the station. There are many ways to do this, including:
•
Internet mapping programs such as Google Earth
•
Handheld GPS receivers (CWOP recommends against determining elevation using GPS)
•
USGS topographical maps
Next, obtain a station ID from CWOP – use the “Join CWOP” link on the first web site listed
above. You will receive an e-mail with your new station ID, instructions and some very useful
links.
Now the CWOP setup information can be filled in on the options dialog window. Select the
“Web” tab and see instructions elsewhere in this manual for the dialog. The “Test” button will
send some canned weather readings to the CWOP server. The instructions from the e-mail will
explain how to determine if the upload worked.
Once everything is working and your data is being passed onto the NOAA MADIS server, Weather
Underground should automatically pick up the feed from MADIS, although it may take a week or
two. The only difference between this and direct uploads to WeatherUnderground is that MADIS
data is sent to WU on a fixed time-table that you have no control over. The MADIS feeds are
identified as “APRSWXNET” in the Weather Underground listings. If after a few weeks your site
does not show up on Weather Underground, then drop them an e-mail and ask if you need to do
anything else. Even if the station does not show in the W.U. listings, you may be able to access
it with a URL like this (replace “WC1234” with your actual CWOP ID).
http://www.wunderground.com/weatherstation/WxDailyHistory.asp?ID=WC1234
Of course, over time, this URL may change and become invalid!
As recommended by CWOP, the temperature data is a five minute average of the outdoor
sensor readings. Similarly, relative humidity is a one minute average.
Elevation must be entered into the options dialog accurately. CWOP needs barometric pressure
reported as an “altimeter setting”. The WMR100 does not offer readout of altimeter setting, so
WSDL uses station pressure reported by the WMR100 and computes the altimeter setting
internally. This calculation is done using the same formula used by ASOS stations. The formula
can be found at the following web sites:
http://www.srh.noaa.gov/epz/wxcalc/wxcalc.shtml
http://wahiduddin.net/calc/refs/ASOS_Pressure.htm
The altimeter setting will not be accurate unless you have entered an accurate elevation. Since
the WMR100 reports pressure with a resolution of 1mbar, your elevation should be accurate to
30 feet or better.
Be sure to check out the quality control feedback available on your weather data. This can help
you determine if your station is properly installed and accurate. The quality control page URL
can be formed by dropping the first character of your station ID as shown below. For example,
a station ID “WC1234” would use this URL:
http://weather.gladstonefamily.net/site/C1234
As before, this URL may change over time and become invalid.
If you determine that your barometer reading is off by a small amount, use the calibration
offset in the options window for this purpose. Versions of WSDL prior to 4.0 do not offer this
offset feature.
If one or more data items are invalid when the CWOP upload is performed, that data will
normally be omitted from the upload. This is a valid upload, but some of the CWOP graphing
tools may show the missing data as a large spike. If you wish to avoid this issue, there are
options to prevent upload when data is invalid – see the description in the preceding section on
Weather Underground uploads for more information.
As with Weather Underground and PWS uploads, some upload errors are considered fatal and
will result in further CWOP uploads being disabled. Turning off the option to enable fatal
uploads stops this behavior.
Web Page Upload
WSDL has the ability to generate and upload HTML web pages to web servers. A description of
this feature is provided here along with a short tutorial for those who are wondering how this
might be of some use. Please be sure to read the discussion of FTP security issues in the
reference section of this manual in the “Options Window” section.
HTML
HTML (or “Hyper Text Markup Language”) is the computer language that web pages are written
in. WSDL is now capable of creating HTML files that contain data from your weather station. If
these files are then uploaded to a web server (WSDL can do this), your weather will be
available as a web page on the internet.
If you want to learn more about HTML, try searching the internet for “HTML for dummies” and
the like. If you don’t want to bother, WSDL includes a couple of basic templates so you never
have to even look at HTML (almost). One good place to learn a little HTML on the internet is
here:
http://www.w3schools.com
Web pages can also be generated with HTML editors or web page generation programs. These
generated pages should also work as long as the WSDL tags are included. The “Arachnophilia”
HTML editor was used to produce the HTML examples included with WSDL.
A series of HTML examples are available for download. From the SourceForge download page,
click on the “Current Stable Release” folder and look for a zip file containing the examples.
JavaScript
Some of the examples include a little JavaScript. Novices should probably just skip over this
until they have a little familiarity with HTML. The same web site mentioned above is also a
good place to learn about JavaScript.
How does this work?
You provide WSDL with a “template file” – which typically contains HTML, but also contains a
few placeholders called “tags” for actual weather data. Here’s an example of what this might
look like:
<p>The current barometer reading is [StationBarometer] [BaroUnits].</p>
Everything in the line above is HTML except for “[StationBarometer]” and “[BaroUnits]”. These
are the tags that WSDL will replace with the actual barometer reading and the units (like
“inHg” or “hPa”). After being processed by WSDL (and being saved in a different file), it will
look like this:
<p>The current barometer reading is 28.88 inHg.</p>
WSDL has replaced the two tags with the actual weather station barometer reading and units.
In reality, there is no reason the template needs to be an HTML file – it can be almost any kind
of file as long as it contains tags to be replaced with weather data.
Periodically (as specified in the options window), WSDL will create a new HTML web page with
your current weather information as follows:
1. Grab a copy of the template file.
2. Replace tags in the template file with your current weather data.
3. Save the result as a new file – this is now a valid HTML file (web page).
4. Transfer the new file to a web server of your choice. This (optional) step makes the
new web page available on the internet.
Configuring WSDL for FTP
The “Internet Options” menu choice in the “Tools” menu will open a window that contains five
different tabs for setting up FTP operations. The content in each tab is described briefly here.
See the reference section for more detailed information.
FTP Sites
WSDL can perform FTP operations to multiple FTP servers, although most users may only need
to access one server. Fill in one line in the table here for each FTP site you wish to upload files
to. Passwords entered are only visible the options are saved; the next time options are opened,
the passwords will be replaced with four asterisks (****). Passwords are also obfuscated in the
project settings file but this should not be considered secure by any means.
FTP Tags
Fill in one line in the table for every file that contains weather tags for processing. Doubleclick in the Template File or Live File columns to open a file browser dialog, or type the file
path directly into the table cell. You can right-click in the URL column to access a list of
already configured FTP sites. Target path specifies the directory and file name on the FTP
server. Leave the URL and Target Path columns blank if you want tag processing to be
performed w/o FTP upload.
FTP Files
This table contains entries for additional files to be uploaded via FTP. This is just like the table
in the FTP Tags tab page, except there is no template file. For backwards compatibility, there
is on “special” value that can be entered into the “Local File” column – “Graphnn” where “nn”
represents two decimal digits. “nn” should be between 1 and the number of graphs being
generated. This special entry refers to the n'th graph's PNG file.
Graphics
WSDL can automatically generate PNG files of the weather data graphs. An output folder must
be specified to contain these image files. The number and types of graphs can be made to
match the WSDL main window (coupled) or independently set (not coupled). When FTP upload
of graphics is enabled, and FTP server and target directory on that server must be specified to
receive the graphics files. If the number of FTP graphics files changes, this functionality will
automatically adjust such that only the current number of image files are uploaded. Uploaded
files are named “WxGraph-nn.png” where “nn” is a number between “01” and “16”.
Currently, graphics files can only be uploaded to one FTP site with the built-in graphics
capability provided in the Internet Options window. It is still possible to upload these files to
additional sites however. In the “FTP Files” tab page, entries can be added manually to upload
each graphics file to as many FTP servers as desired. To accomplish this either specify the full
path to the graphics file in the “Local File” column, or enter the special identifier “Graphnn”
where “nn” is the graph number to be uploaded (“01” through “16”). The only drawback to this
approach is that you must configure a fixed number of graph files and if the number of FTP
graph files changes you may need to go back and modify this table.
Future versions of WSDL may support automatic upload of graphics to multiple FTP servers if
there is enough interest from users.
FTP
Thre are some miscellaneous settings on this page. A pre-processing program may be
configured to run prior to FTP uploads. This is handy for tasks such as capturing web cam
images or running programs to create additional upload files. The program can be any windows
executable file, batch file, or anything you could double-click on in a file browser. The
program is started some number of seconds prior to each FTP upload. If the program does not
exit before the FTP upload begins, it will be forcibly closed prior to the upload.
Also here, the FTP upload interval and enabling of FTP uploads is set.
Web Servers
So where you ask, can I get a web server? The answer is simpler than you may think. If you
have an ISP (internet service provider) account, then you most likely have access to a web
server. Most ISP accounts allow you to setup a web site associated with your account. Contact
your ISP or visit their web site to learn more.
WSDL uses something called “FTP” to transfer files to web servers over the internet. “FTP”
stands for “File Transfer Protocol” and this is just another way that computers can talk to each
other. Most web servers provided to customers by ISPs will offer the ability to upload files using
FTP.
Let’s continue by assuming you don’t already have a web site setup on your ISP’s web server.
Check with your ISP for instructions on setting up a web site – they will usually have at least
some basic information available. Pay particular attention to information about FTP file
transfer.
For example, with my ISP there are two ways to get to the web page directory. From the ftp
login directory, I can access the web page directory through the “public_html” directory.
Alternatively, I can access the same location from the root directory as
“/home/WWW_pages/<user>/” where <user> is my user id. FTP uses forward slash characters
“/” to separate directories instead of the back-slash “\” used by Windows.
Once you know where the web home directory is you’ll probably need to create a file called
“index.htm” or “index.html” that will contain your weather page. Again, your ISP should have
information on this.
That’s all the information you should need. Let’s assume my user id with my ISP is “fred”. The
FTP Tags and FTP Files tabs in the WSDL internet options window have fields called “URL” and
“Target Path”. For me there are two values I could enter here that would work:
URL: ftp.isp.com
Target Path: public_html/index.htm
URL: ftp.isp.com
Target Path: /home/WWW_pages/fred/index.htm
The difference between upper and lower-case letters is often significant on web servers, so pay
attention to this. The target path in the second example contains one “/” character before the
word “home”. This navigates to the ISP’s root directory. Omitting the second “/” as in the
first example will navigate from your FTP login home directory instead of the root directory.
That’s probably the worst of it. To begin with if you just want to use one of the supplied
template files, they are in a zip file located in the same directory that WSDL itself is installed
into. For the Result file, you can specify any file name anywhere on your computer. However,
it might make sense to pick a new filename in the same directory as the template. DO NOT
choose the template file name for the result file – this will over-write the template, destroying
it. It would be a good idea to make a copy of one of the supplied template files in some other
directory for your experimentation.
Examples and Testing
Several examples of web pages are provided as a separate download on SourceForge. From the
WSDL download page, click on “Current Stable Release” to find the examples in a zip file. If
you are a beginner, then start with the simple example and work up from there. The test page
just shows all of the different tags that are available.
The example weather icons were obtained from the www.gstudio.us website and are
copyrighted – they are for personal use only – commercial use is prohibited! You don’t need to
use these icons – there are lots of weather icons out there on the internet. Moon phase icons
are licensed under the LGPL.
To get started, make a copy of the simple example template in a new directory somewhere. In
the internet options dialog's FTP Tags tab page, choose the template and live (result) files, but
leave the FTP URL and Target Path entries blank. The result file can be in the same directory
as the template but with a different name or in a different directory with any name. Then push
the “Test” button. This will create the web page output file, but the FTP upload will be
skipped (because the URL field is blank). Now, you can double-click on the result file (in your
computer browser window) to see what the resulting web page will look like. You can also
right-click on the result and open it with notepad or wordpad to see the raw HTML. Much of the
weather information here is just “dummy” data. The dummy data uses fixed units (not your
current display units setting) so don’t be alarmed if the units are not what you expected.
To move testing to the next level, open the internet options window and set the FTP upload
interval (in the FTP tab) to something short (like one minute) and check the box to enable
uploads. Uploads will still not take place. However, once a minute a new web page will be
created containing current weather data instead of dummy data. This may help in fine tuning
the web page.
Once the web page looks good the actual FTP upload can be tested. The more complicated
examples will require that all of the example files (except the template file) be transferred to
the web server first. If you are not sure how to do this, ask a web-experienced friend for help.
Going Live
Once this is working, then you need to setup at least one FTP site in the FTP Sites tab page. Fill
in the FTP URL field, user id and password and check the SSL connection box. Don’t check the
box to allow unsafe certificates at first. Go back to the FTP Tags tab page and right-click on
the URL field for your template file – select the ftp site that was just configured. Enter a valid
target path value (e.g. “index.htm” – but the correct value depends on your FTP server) and
save options.
Re-open the internet options window and try the Test button again. If it works, you should be
able to view the same web page on the internet now. If the upload fails, re-check the URL,
name and password. Also try checking the option to allow unsafe certificates. As a last resort,
un-check the SSL connection option. Unless the SSL connection option works, the password is
sent over the internet un-encrypted. This means it can be intercepted and used to “hack” into
your ISP account. If this is a concern, consider creating a separate account with your ISP that
will only be used for the weather web site – this will limit the potential damage if someone
does manage to grab the password. If the SSL connection option works, the risk is substantially
reduced. See the description of this option in the reference section below for more
information.
Another variation in FTP connections is active versus passive. The difference is somewhat
technical and to find out more, try running an internet search for “active versus passive ftp”.
However the bottom line is that if you have problems with FTP or if you know your ISP’s FTP
server is passive-only you can enable passive FTP in the FTP tab of the options window.
Firewalls, anti-virus programs and routers (wireless or wired) can often cause problems getting
FTP (with and without the SSL option) to work. These problems are beyond the scope of this
manual but they are always good suspects to start with.
Once you are happy, choose an upload interval and check the “Enable” check box on the “FTP”
tab page. Save options, and enjoy!
As with other internet uploads, some upload errors are considered fatal and will result in
further FTP uploads being disabled. Turning off the option to enable fatal uploads (in the
“Upload” tab of the options window will prevent this from happening.
That’s about all the help that can be provided here – if you need more, try talking to a friend
who is computer savvy.
Template File Processing
The template file is processed as a text file. It will usually contain HTML, although this is not
required. Any string in the file matching one of the tags listed below will be replaced with the
indicated information in the output file. Data will be output in the same units as are being
displayed by WSDL on screen. It’s as simple as that. Tags are case-insensitive. For example, you
can use either “[Location]” as a tag, or for the eclectic folks, “[lOCAtiOn]” will work also.
Tag
Will be replaced with
Tag
Will be replaced with
[Location]
Station description from WSDL
options window
[Latitude]
Station latitude in decimal
degrees
[LatitudeDMS]
Latitude in degrees, minutes and
seconds
[Longitude]
Station longitude in decimal
degrees
[LongitudeDMS]
Longitude in degrees, minutes and
seconds
[Elevation]
Station elevation in feet or
meters (see notes)
[ElevationFeet]
Station elevation in feet
[ElevUnits]
Units for the [Elevation] tag
[QnhBarometer]
Altitude-corrected pressure (altimeter
setting) †
[UpdateSeconds]
How many seconds between
web page updates
[SlpBarometer]
Sea Level Pressure
[Date]
Date of the weather report
[StationBarometer
]
Station pressure, sometimes called QFE
[DayOfWeek]
Name of today (e.g. “Tuesday”)
[QnhForecast]
Forecast text based on WMR100’s sea
level pressure**
[QnhRate]
Pressure change rate (per hour),
computed using 3 hours of data.
†
†
[Time]
Time of the weather report
[StationForecast]
Forecast text based on altitude
pressure**
[TimeZone]
Long name of the display
timezone
[RainRate]
Current rain rate
[TZ]
Short name of the display
timezone
[RainThisHour]
Rain received in the last 60 minutes
[TotalRain]
Total rain as displayed on the
WMR100 console
[RainThisDay]
Rain received since midnight in the
display time zone
[RainSince]
Reset time for total rain on the
WMR100 console
[GustSpeed]
Current wind gust speed
directly from the WMR100
[AnnualRain]
Rain for the current year as computed
by WSDL
[AverageSpeed]
Average wind speed directly
from the WMR100
[AnnualRainSince]
Reset date for the annual rain total
[Direction]
Wind direction directly from the
WMR100
[RainUnits]
Unit of measure for rainfall
[CompassDirection]
Wind direction as compass point
Tag
Will be replaced with
Tag
Will be replaced with
[2minAvgSpeed]
2-minute average of
reported speeds
[WindUnits]
Unit of measure for wind
speed
[2minAvgDirection]
2-minute average of
reported directions
[BaroUnits]
Unit of measure for
barometric pressure
[2minAvgCompassDirection]
2-minunte average as a
compass point
[10minGustCompassDirection
]
Maximum gust in the last
10 minutes as a compass
point
[10minGustSpeed]
Maximum gust over the last
10 minutes
[Uv]
Current UV Index
[BeaufortSpeed]
2-minute average wind
speed on the Beaufort
scale
[BeaufortNumber]
BeaufortSpeed rounded
to the nearest integer
[BeaufortName]
Name associated with the
current BeaufortNumber
(e.g. “Strong Gale”)
[10minGustDirection]
Direction of the 10-minute
maximum wind gust
[WUid]
Weather Underground
station ID
[CWOPid]
CWOP station ID
[MADISid]
This is the CWOP ID with
the “W” removed (see
below)
[TempUnits]
Temperature display units
[RhUnits]
Relative humidity display
units
[SensorName<n>]
User specified name for
wireless sensor ‘n’ ††
[AppTemp<n>]
Apparent temperature for
wireless sensor ‘n’ †† ***
[Temperature<n>]
Temperature, sensor ‘n’
[HeatIndex<n>]
Heat index, sensor ‘n’
[DewPoint<n>]
Dew point, sensor ‘n’
[WindChill<n>]
Wind chill, sensor ‘n’
[RH<n>]
Relative humidity
(percent), sensor ‘n’
[Rain<d>]
Rain received on day ‘d’
[TempRate<n>]
Temperature change per
hour, computed using 15minutes of data, for sensor
‘n’
[DewPtRate<n>]
Dew Point change per
hour, computed using 15minutes of data, for
sensor ‘n’
[Temp<n>Min<d>]
Minimum temperature for
‡
sensor ‘n’ on day ‘d’ ††
[Date<d>]
[DayOfWeek<d>]
††
††
††
Date for min/max data on
‡
day ‘d’
Day of week for min/max
‡
data on day ‘d’
[Temp<n>Max<d>]
††
††
***
Maximum temperature
for sensor ‘n’ on day ‘d’
‡
‡
††
Tag
Will be replaced with
Tag
Will be replaced with
[UvMin/Max<d>]
Minimum or maximum UV
‡
reading for day ‘d’
[DewPt<n>Min/Max<d>]
Minimum or maximum
daily dew points on day
‡
‘d’ ††
[GustMax<d>]
Maximum wind gust, day
‡
‘d’
[Rh<n>Min/Max<d>]
Minimum or maximum
relative humidities on day
‡
‘d’ ††
[QfeMin/Max<d>]
Minimum or maximum
station pressure for day ‘d’
‡
[SlpMin/Max<d>]
Minimum or maximum sea
level pressure for day ‘d’
‡
[CumTemp<n>Min/Max<d>]
Minimum or maximum
temperature over the last
‘d’ days.
[CumDewPt<n>Min/Max<d>]
Minimum or maximum
dew point over the last
’d’ days.
[CumRh<n>Min/Max<d>]
Minimum or maximum
relative humidity over the
last ’d’ days.
[CumQfeMin/Max<d>]
Min or max QFE
barometer reading over
the last ‘d’ days.
[CumSlpMin/Max<d>]
Minimum or maximum SLP
barometer over the last ‘d’
days.
[CumUvMax<d>]
Maximum UV reading over
the last ‘d’ days.
[CumGustMax<d>]
Maximum wind gust over
the last ‘d’ days.
[CumRain<d>]
Rain received over the
last ‘d’ days.
[GraphTitle<m>]
Title text for the m’th
‡‡
graph
[GraphFile<m>]
Local file name for the
PNG file corresponding to
‡‡
the m’th graph
* Calculations of sunrise, sunset and determination of day or night require accurate latitude
and longitude values in the CWOP Upload options panel. These times are approximate and may
be in error by several minutes, especially at higher latitudes.
†
Barometer readings are taken from the WMR100 unless the WeatherJack barometer is
enabled. QNH (altimeter) values are always calculated by WSDL using the station. SLP
values are taken from the WMR100 unless the option to override these is enabled or if the
WeatherJack barometer is in use. In that case WSDL calculates SLP.
** These tags will be replaced with one of the five following values: { Sunny PartlyCloudy
Cloudy Rainy Snowy }.
*** These values are computed using the current anemometer (wind) reading, and will not be
appropriate for indoor sensors, or those sensors not located in wind environments identical to
that of the anemometer.
The values which include the designation “<n>” refer to the different temperature sensors,
on channels 0 through 10. Zero is the WMR100 console temperature reading, channel 1 is the
dedicated outdoor sensor, and the remaining channels apply to optional temperature/humidity
sensors. For example, the tag “[DewPoint2]” refers to the dew point measurement on channel
two.
††
‡
Some min/max tag entries including the string “Min/Max”, and this indicates that one of these
must be chosen. For example, “[UvMin/Max]” means that valid tags are “[UvMin]” and
“[UvMax]”. Min/max data is accessed through a “day number”, shown as <d> above. The
number zero represents the latest day, “-1” refers to the next older day (usually yesterday), “2” to the day before that and so on. For example, the tag [Temp3Max0] is the current day’s
maximum temperature on sensor channel #3. Similarly, [DewPt1Min-4] refers to the minimum
dew point on sensor channel #1, four days ago. The numbered date/day tags (e.g. [DayOfWeek1] or [Date-3]) are refer to the days associated with min/max data.
A maximum of 30 past days can be accessed through min/max data tags. However, if there are
days in the weather log with no data, fewer than 30 days will be available. Also, note that the
relative day number (<d>) may skip a day if log file data is missing. For example if today is
Wednesday and there is no data in the log for Tuesday, then [DayOfWeek-1] will be “Monday” –
not “Tuesday” as would normally be the case.
‡‡
Tags containing a graph number (<m>) refer to one of up to sixteen graphs displayed on the
screen. The legal values of <m> are 1,2,3,...15,16. If the graph number exceeds the actual
number of graphs currently being displayed, tags will be replaced with data indicating the
graph is not available. A file name of “NoGraph.png” will be substituted in this case. The
GraphFile tag is intended for local (non-FTP) use only. For FTP use, it is recommended the
graph files be re-named during the upload process using a CSV list file (see below for details).
#
Possible moon phase strings: { New, WaxingCrescent, FirstQuarter, WaxingGibbous, Full,
WaningGibbous, LastQuarter, WaningCrescent }
If the CWOP id is of the form “xWnnnn” where “x” is any character and “n” is any single digit,
then a version of this (called the MADIS ID) is formed by removing the “W”. For example, the
corresponding MADIS ID for “CW1234” would be “C1234”. This is provided because some web
site links for weather station data require the MADIS ID instead of the CWOP ID. If your CWOP
ID does not fit these rules, then the MADIS ID will be exactly equal to the CWOP ID.
Tags such as [DayNight], [MoonUp] and [MoonPhase] can be used to select different images for
display on the web page. For example if there are two PNG files named “xyz_Day.png” and
“xyz_Night.png”, then adding the following HTML snippet would result in different images on
the web page during day or night:
<img src=”xyz_[DayNight].png” ..... >
Some of these values require that certain options be set, such as longitude, latitude, elevation
and “normal temperature”. See the reference section for details on these options.
Almanac Tags
Beginning with WSDL version 4.2.1.8, many more almanac tags are available. The program now
has a built-in state-of-the-art capability for calculation of various astronomical events. This
also means that existing almanac functions (e.g. date and time of the next new moon) are now
more accurate.
This feature uses high precision data published by NASA’s Jet Propulsion Laboratory and you
must download and install a separate data file (named “Almanac.bin”) in order to use the
capability. The file must be installed into the same directory as the WSDL executable file. The
file currently available for download covers the time period from year 2000 through 2200.
If the data file is not installed or installed in the wrong location, many of the almanac tags will
not work and/or return non-sensical values.
Tag
Will be replaced with
Tag
Will be replaced with
[DayNight]
“Day” or “Night”
[Sunrise]
Hour and minute today’s
sunrise (e.g. “6:43 AM”) *
[Sunset]
Hour and minute of today’s
sunset
[SunTransit]
Hour and minute of todays’s
Sun transit
[HoursDaylight]
Hours and minutes of daylight
today
[SunAz]
Current azimuth of the sun
(degrees from North)
[SunEl]
Current elevation of the Sun
above the horizon
[SunREl]
Current elevation of the Sun
corrected for atmospheric
refraction
[SunDist]
Current distance between your
station and the Sun’s center in
Astronomical Units (AU)
[Apehelion]
Date and time of Earth’s next
Apehelion
[Perihelion]
Date and time of Earth’s next
perihelion
[SunRA]
The Sun’s current topocentric
right ascension
[SunDec]
The Sun’s current topocentric
declination
[MoonRise]
Time of today’s moonrise
[MoonUp]
“Up” or “Down”
[MoonSet]
Time of today’s moonset
[NewMoon]
Date of next new moon
[FullMoon]
Date of next full moon
[MoonPhase]
One of the strings listed below.#
[FirstQuarter]
Date and time of the Moon’s
next 1st quarter
[MoonAge]
Time elapsed since the last new
moon in days
[LastQuarter]
Date and time of the Moon’s
next last quarter
[MoonTransit]
Time of today’s moon transit
[MoonAz]
Current azimuth of the Moon in
degrees from North
[MoonEl]
Current elevation of the Moon
above the horizon in degrees
[MoonREl]
Current elevation of the moon
corrected for atmospheric
refraction
[MoonRA]
Current topocentric right
ascension of the moon
[MoonDec]
Current topocentric declination
of the moon
[Apogee]
Date and time of Moon’s next
apogee
[Perigee]
Date and time of Moon’s next
perigee
[MoonDist]
Current distance from your
station to the Moon.
[DistUnits]
Units used for Moon distance
and the eclipse search radius
[SolarEclipse]
Date and time of the next solar
eclipse of any type, anywhere on
Earth
[TotalSolarEclipse]
Date and time of the next total
solar eclipse anywhere on Earth
Tag
Will be replaced with
Tag
Will be replaced with
[EclipseSearchRadius
]
Size of radius used to search for
locally total solar eclipses
[DistUnits]
Units used for Moon distance
and the eclipse search radius
[LocalSolarEclipse]
Date and time that a solar
eclipse of any kind will be visible
from your location (does NOT
use the search radius)
[LocalTotalSolarEclipse]
Date and time that a total solar
eclipse will be visible within
the specified search distance of
your station.
[LunarEclipse]
Next date and time that a lunar
eclipse of any kind will occur
[TotalLunarEclipse]
Next date and time that a total
lunar eclipse will occur
[LocalLunarEclipse]
Next date and time that a lunar
eclipse of any kind will be visible
from your station
[LocalTotalLunarEclipse]
Next date and time that a total
lunar eclipse will be visible
from your station
[Prev<SunEvent>]
Date and time of the most
recent sun event, such as a
Vernal Equinox (see below for
events)
[Next<SunEvent>]
Date and time of the next
specified sun event, such as a
Winter Solstice (see below)
WSDL can search for the next solar eclipse that will be visible from your location. When
searching for any type of eclipse (partial or total) with the [LocalSolarEclipse] tag, only
eclipses that are visible from your exact location are considered.
Each total solar eclipse only transverses a very small fraction of the Earth’s surface, so a search
for the next total solar eclipse visible from your location (say in the next 200 years) is likely to
fail. Therefore, a search radius is also provided which allows you to search for the next total
solar eclipse that will be visible with some radius of your location (within 500 miles for
example).
The times listed for non-local solar eclipses are the time of maximum eclipse without regard to
your location on Earth. For local solar eclipses, the times listed are the time of maximum
eclipse at your location.
After WSDL is first started, the first FTP upload operation requires generation of the entire set
of almanac data listed above. Thereafter, to save time the data is only re-generated if it
becomes stale. In particular, the search for total solar eclipses visible from your location can
take as long as a minute or more if the search radius is small or zero. So, if you notice the FTP
timer is not being refreshed on the first upload, that’s the reason for it. If you are not
interested in the local eclipse information, then setting the search radius to a large value (like
2500 miles or 5000km) will speed things up considerably.
There are four different “<SunEvents>” that can be specified: VernalEquinox, SummerSolstice,
AtumnalEquinox and WinterSolstice. For example to display the time of the next summer
solstice, you would use the tag [NextSummerSolstice].
Graph Images
Copies of the weather graphs can be saved as PNG files and uploaded too. By default the
number and type of graph files generated is determined by the current on-screen graph layout.
For example, if one of the graphs on screen is changed from anemometer to UV index, then
subsequent graph files will contain UV index data.
Optionally, the number and type of graph files generated can be “locked” by un-checking the
“Coupled to Main Window” option in the FTP section of the options window. After saving this
option, a new choice will appear in the “Graph” menu of the main window – “Update FTP
Config”. Clicking this menu item will save the current graphics configuration for future FTP
uploads.
As with web page generation, graph files are processed in two stages – first generation of PNG
files on the local computer, then upload to the FTP server.
Stage 1: Two conditions must be met before PNG files will be generated.
•
Generation of FTP graphics must be enabled in Graphics tab of the internet options
window.
•
A directory for storage of these files must be specified in the Graphics tab.
Stage 2: The PNG files can only be uploaded if the Upload box is checked in the Graphics tab of
the internet options window. In addition, a valid ftp site and target directory must be entered.
PNG file names are automatically determined by WSDL. For web pages that will be viewed on
the local computer, the [GraphFile<m>] tag can be used to reference these images from an
HTML web page.
By default, graph images are sized to be 400 pixels wide and 300 pixels high, and it is possible
to change this size in Graphics tab of the internet options window.
To create the FTP graphics, WSDL maintains a hidden set of windows – one for each graph in
the main window. These windows use significant computer resources. Disabling generation of
FTP graphics will prevent these windows from being created.
Processing Multiple Files
You can also have more than one file tag-processed and/or uploaded by WSDL. To do this,
simply add more entries to the tables in the FTP Tags and FTP Files tab pages of the internet
options window.
FTP Pre-processor Support
Some users may have additional tasks they wish to perform prior to an FTP upload. For
example, analysis of the current weather logs file or generation of additional custom graphics.
These tasks may generate or update additional files to be included in the FTP upload.
Beginning with beta version 4.2.2.1, WSDL can now be configured to execute a user-specified
file prior to the FTP upload. This file can be anything you could double-click on in the file
explorer window (for example, an exe or bat file).
Starting in version 4.2.3.5, this capability can be configured in the FTP tab page of the internet
options window.
Your pre-processor must complete its tasks and exit before the FTP upload operation
commences. If it is still running when the time arrives to perform the FTP upload, it will be
forcibly stopped before continuing with the upload so be sure to allow enough time here for
your pre-processor to complete its work.
Windows Vista and 7 users must ensure that the WSDL process has the necessary permissions to
execute the pre-processor.
AWEKAS
Data uploads to Weather Underground, PWS Weather and CWOP are exactly that – WSDL sends
your weather data directly to these data collection sites. This kind of data transfer can be
viewed as a “push” operation. AWEKAS does not use this same upload “push” process. Instead,
they periodically “pull” your weather data from a web server. The process of setting up your
AWEKAS account includes giving them the URL for your web server – from which they will “pull”
your data.
So, in order to use AWEKAS, you must have a web site from which AWEKAS can pull your data
file. Setting up a web site is discussed elsewhere in this section. If the only thing you are using
the web site for is AWEKAS data transfer, then you don’t need to actually install any valid
HTML web pages on the site. The only file that needs to be there is the AWEKAS data file.
For AWEKAS data transfer to work, WSDL needs to periodically “push” a properly formatted
weather data file onto your web server. When FTP uploads are enabled, an AWEKAS data file is
automatically built in the same directory specified for graphics image files. This file is built
using the Davis Weather Link format (HTML) and is named “awekas_wl.htm”. This particular
AWEKAS upload format was chosen because it allows more information to be uploaded (UV
index, for example).
To configure this file for upload open the AWEKAS tab page in the internet options window.
Select a folder to contain the awekas_wl.htm weather data file. Check the Upload box and
specify the FTP site and target directory on that site to receive the uploaded file. The FTP site
must be configured separately in the FTP Sites tab page.
Finally FTP uploads must be enabled. The AWEKAS file will be built and then transferred every
time an FTP upload occurs.
Client/Server Operation
Beginning with version 4.1, WSDL can be run in a client/server configuration. One copy of WSDL
runs on one computer, collecting, logging, and uploading weather data. It also broadcasts realtime sensor data over your home network. Additional copies of WSDL can be run as clients on
the same computer, or other computers on your home network, receiving the real-time
broadcasts from the server. These clients will display (nearly) the same information as you
would see on the server.
It is also relatively simple for those with a little programming experience to build custom
clients to receive real-time weather data from the server. These clients can do just about
anything with the weather data. Using home automation hardware for example, a custom
client can control fans or appliances based on real-time data from the WSDL server. In this
case, the client can run on the same computer as the server, or a different computer.
Source code for an example custom client is installed as a zip file in the WSDL installation
directory (usually, this is in \Program Files\Weather\Weather Station Data Logger on the same
hard drive that Windows is installed on).
The server uses a “broadcast” technique to send its data over the network. Network routers do
not allow broadcast data packets to leave the local network, so this technique is limited to
your local home network.
To run WSDL as a server or client, you must start it with a command-line option. Use the (caseinsensitive) option “server” or “client” as appropriate. One way to accomplish this is to open a
DOS command window and use the “cd” command to change to the WSDL installation
directory. Then type the command:
WxLogger.exe server
When starting, the WSDL client will wait for up to 90 seconds listening for broadcasts from the
WSDL server. If a server is not found, it will display an error dialog and then quit. After locating
the server, the client will request a copy of the weather log held in memory by the server
(typically, about 32-days worth of data).
The client also obtains a copy of (a portion of) the server’s option settings. For now, these are
read-only although a future version of WSDL will allow the client to change server options. As a
result, the options window for a client has very few choices at this time.
Startup Utility Program
There is a utility program that makes it easy to start WSDL with one of the command line
arguments from the Windows start menu. In the WSDL source code, this program is named
“StartupHelper.exe”. During installation, three copies of this program are made and renamed
as “WxClient.exe”, “WxServer.exe” and “WxService.exe”. When the startup helper is run, it
examines its own filename, and then starts WSDL (WxLogger.exe) with the appropriate
command line argument.
The utility program expects to find WxLogger.exe in the same directory as the utility. If
WxLogger.exe cannot be found or otherwise started, an error message will be printed in a DOS
command window and displayed for a few seconds before the utility exits. Otherwise, the
startup utility will exit immediately after starting the client or server.
The utility will not exit immediately when starting the service mode version of WSDL. Instead
the utility will wait until the WSDL service terminates before exiting. This is useful when using
the Windows task manager to start the service at computer boot time.
Option Settings on WSDL Servers and Clients
WSDL options are now split into three categories: server, client and FTP graphics options.
When running as a client, WSDL obtains server and FTP graphics options from the WSDL server –
and uses these for operation. For now, these options (server and FTP graphics options) cannot
be changed on the client. Each client however, has its own private set of client options which
can be changed and are not shared with the server or other clients with one exception
(explained below in “Option File Collisions”).
As an example, user-defined names for wireless sensors are categorized as server options. A
WSDL client will obtain these from the server and every client will use the same name for each
wireless sensor. Graph color settings are categorized as client options and each WSDL client
will have its own private version of graph color settings.
In some cases (especially if several clients will be used), it can be tedious to set the client
options on each new client. To make this easier, there is an option in the Tools menu to copy
the current set of options from the server to the client and save them. This includes client,
server and FTP graphics options. New clients can then be initialized from the server’s options,
and then custom, per-client options can be set afterwards. To make this useful, users should
set the client options on the WSDL server to whatever default state is desired for new clients.
This copy utility is also useful if the WSDL server is to be moved to a different computer. Start
up a WSDL client on the new server computer and copy options from the old server. Then, shut
down the old server and start up a WSDL server on the new computer.
Option File Collisions
Options are stored in a user.config file which is located in your user directory. In XP this
directory path begins with “\Documents and Settings\<user name>\...” In Windows 7 the path is
“\Users\<user name>\...” where the string “<user name>” represents the user’s Windows login
name. If your user name is “Fred” then the options directory path will start with
“\Users\Fred\...” in Windows 7.
The same options file is used for both client and server operation modes. This becomes
important when WSDL is running as both client and server on the same computer under the
same user’s login. In this case, option changes on the client will alter the same option storage
file that the server is using.
As of now, no notifications are passed between the server and clients when option changes
occur. Because of this, when changing options where the client and server are running on the
same computer and as the same user, it is best to restart both client and server after changing
options.
Propagation of Option Changes
In the current release of WSDL, the server does not provide any notification to clients when
server options (such as wireless sensor names) are changed on the server. This means that
clients will need to be manually restarted when certain server options are changed. If you
change something on the server and don’t see it showing up in a client, try restarting the
client.
A future release of WSDL will include server notification to clients of relevant option changes
so that clients can re-read server options automatically.
The “Service” Mode of Operation
WSDL can also be started using the string “service” on the command line or by running the
startup utility “WxService.exe”. This will run the program as a server, but with most of the GUI
functionality disabled.
This option can be used when WSDL is configured to start at computer boot time (using the
Windows task manager). It will run as a server even if no one is logged into the computer. In
this scenario, there will be no GUI displayed. To see the GUI, run another instance of WSDL as a
client on the same or a different computer.
When using the service mode, many of the options cannot be changed because the GUI is not
available. A later release of WSDL will allow these options to be changed from a client GUI. For
now however, to change options the service mode version of WSDL must be shut down (using
the windows task manager). Then, start WSDL either in stand-alone mode (no command line
arguments) or server mode. After saving options, exit WSDL and restart the service mode
version from the windows task manager.
When configuring WSDL to start at computer boot time in “service” mode, some Windows
versions (e.g. XP) will turn on an option by default that will kill WSDL after it has been running
for 72 hours. This option must be turned off: after creating the task, open the properties
window for the task and look under the “Settings” tab. Un-check the option to stop the task if
it runs longer than a specified time limit (72 hours by default). Also, you may want to un-check
the options that prevent the task from executing if the computer is running on batteries. The
computer should not be allowed to sleep or hibernate if WSDL is going to be running as a
service.
Troubleshooting
The “Internet” tab in the options window has settings for the port numbers used by the client
and server. The default values are 9981 for UDP broadcasts and 9982 for TCP connections. UDP
broadcasts are used for real-time weather data and once-per-minute log file updates. The TCP
connection is used for log file dumps and server option settings. These port numbers are not
currently assigned by IANA so there should not be any conflicts. However, some users may have
other applications using these port numbers and they can be changed if necessary.
The port numbers on client and server must match. To change the client’s port numbers, start
WSDL on the client computer without the “client” option. WSDL will of course try to connect to
weather station hardware that is not present – this is okay. Open the options window and set
the port numbers as desired, then save options. Exit WSDL and re-start it with the “client”
option and the new port numbers will take effect.
The UDP broadcast packets used by the server to send real-time weather data will not be
transmitted through a router. For example a wireless router that also has four wired ports will
allow any computers on the wireless network or one of the four ports to act as a WSDL client or
server. However, the network connected to the “WAN” or “Internet” port on the router cannot
see any of these broadcast packets. Large home networks using multiple routers will have
problems – feel free to discuss any such issues on the SourceForge forum.
Implementation Details
This information is intended for those wishing to design their own Plug-In WSDL clients.
All messages (both TCP and UDP) share a common format. These are byte-oriented streams
which may be compressed using the gzip algorithm and may contain a 16-byte MD5 hash for
improved integrity.
TCP messages have one difference compared to UDP broadcasts – they start with a 10-byte
ASCII integer which defines the number of bytes in the rest of the message. This is useful for
allocating buffers on the receiving end. UDP packets do not contain this 10-byte length field.
The first byte (or eleventh byte for TCP messages) is either 0x00 or 0xFF. If any other value is
received, there is an error and the rest of the message should be discarded. When equal to
0xFF, this byte indicates that the rest of the message was compressed using gzip.
After possibly de-compressing the remainder of the message, the next byte (0x00 or 0xFF)
indicates whether a 16-byte MD5 hash is appended to the message. If the value is 0xFF, the last
16-bytes should be removed to obtain the message payload. There is no requirement to verify
the hash when present – this is optional. UDP packets can include a simple checksum which
provides a certain amount protection against message corruption. This checksum is not
guaranteed to be verified by the protocol stack, so the MD5 has been added to improve
message integrity.
After possibly removing and optionally verifying the MD5 hash, the remainder of the message
contains the actual payload. This is always formatted as XML – this choice was made because
the .NET class libraries provide easy support for this type of serialization.
UDP data broadcasts are limited to 1500 bytes in length. Due the relatively verbose nature of
XML, data structure and data field names have been kept short and terse to keep the packet
size down.
Once-per-minute log file updates contain a large amount of data compared to real-time
weather updates. To avoid excessively large UDP packets, the XML structure for these updates
contains a single string field. This field’s value is the log file record formatted as CSV data.
This is inconsistent with the format of all other real-time UDP broadcasts, but was necessary
due to the amount of data contained in a single log file update.
A future version of this manual will contain a complete specification of these XML formats.
Log file dumps and server option settings are also available from the WSDL server. These are
too large for UDP broadcasts so a TCP connection is required to obtain this data. The message
format is identical to UDP broadcasts but contains an additional 10-byte ASCII length header.
To request data, first establish a TCP connection with the server. The server’s IP address
should be obtained by listening for a UDP broadcast packet on the appropriate port (9981 by
default). Next, send a single ASCII byte to the server, indicating the type of data being
requested (this is case sensitive):
•
“L” requests a log file dump (usually about 32-days worth of log data)
•
“s” requests server option settings
•
“f” requests the server’s FTP graphics settings
•
“c” requests the server’s client settings
The server will reply to the single byte request with the requested data.
The Log File
Once a minute, current weather station values are written to a log file in CSV (commaseparated variable) format.
Details on Logged Data
Once every minute, weather station values are written to a CSV-format log file. For the most
part, data in the log file is identical to what is displayed in the main window. A little more
explanation is required for wind data.
Two types of wind information are saved in the log, average and gust. Average wind data is a
two-minute average of speed and direction – the same speed and direction as shown in the
METAR display. Gust data represents the highest wind speed (and its direction) observed in the
last minute. Gust data as saved in the log is not shown directly in any of the main window
readouts, although it can be graphed if the “Raw” option is selected in the wind gust graph
menu (Graph...Wind Gust...Raw).
The first line in the log file specifies the “culture” – which determines how numbers, dates and
times are formatted. A more detailed explanation follows below.
The next two lines in the log file define the units in which data is stored. When the program
starts, a check is made to see if the log file exists. If there is no log file, a new log file is
created using log file units specified in the options. Otherwise, the existing log file is loaded
and units specified in the log file are used, overriding any option settings – with one exception,
discussed below.
When the log file is opened at program startup, if the units used in the log file are different
than the current option settings, a warning dialog will pop up. It will give you a choice of either
overriding the option settings or walk you through the process of deleting, renaming or moving
the existing log file.
Changing log file units must be done in distinct steps:
1. Use the options button and dialog to make the changes. When the changes are saved a
warning dialog comes up and the program terminates after you press the OK button.
2. Restart the program. A warning will pop up explaining the units mismatch condition. To
continue changing log file units, the Cancel button must be pressed.
a. Alternatively, you could delete, move or rename the existing log file before
restarting the program. In this case, no dialog will pop up (skipping step (3)
below) and WSDL will create a new log file using the new units’ settings.
3. A file dialog will now pop up, showing the contents of the current log file directory.
Use this window to delete, rename or move the log file (WxLog.csv). When finished
close the dialog – it does not matter if you press the “Open” or “Cancel” button – just
close the window somehow. If you changed your mind and don't want to alter the log
file, then close the window w/o making any changes (you'll get the window a second
time and must close that one too.)
4. Another dialog will appear telling you that a new weather log file has been created.
You should check the options again to make sure the log file units are set as desired.
What can I do with the log file?
The CSV format is one of the most widely accepted data file formats in use today.
To begin with, explore the contents of the log file using a text editor, like WordPad or
Notepad. Just right-click on the file and choose “Open With...”.
Spreadsheet programs such as Open Office “Calc” and Microsoft Excel can read CSV files.
However, these programs are limited to handling about 65,000 log entries – which is equivalent
to roughly 45 days of weather information. OK, so these programs may not be all that useful.
If you have the ability to write computer programs, CSV files are easy to read and parse.
Another program that reads CSV files is Matlab from Math Works. The number of log entries will
only be limited by your computer’s memory. The downside is, Matlab costs a ton of money.
Well, if you have it, then use it. For those who don’t have it, there is FreeMat on SourceForge.
Either program is extremely powerful and well worth the effort to learn. These two programs
are the recommended way to do cool things with the log file data.
Many database programs can read CSV files. Check the projects SourceForge open discussion
forum as some other tools have been discussed there also.
Log File Extensions
With version 2.8 of the program, two extensions have been added to the log file. The two lines
following the units’ specification now contain initial rain total information which is required to
keep track of rain totals after the log file is trimmed.
Optionally, computed rain gage bucket tip counts can now be stored in the log file. See the
appendix topic on rain gage calibration for information about why you might want to do this.
The program can also try to add bucket tip counts to an existing log file. To achieve this,
enable tip counting in the Options dialog, then exit and restart the program. You will be
offered a chance to augment the weather log with tip counts. Tip counts added by this method
are not guaranteed to be accurate. Compare the displayed total rain amounts with adjusted for
resets to the tip counting method to see if there are any problems. If this does not work you
may need to start a new log file instead.
The tip count field contains two pieces of information. The value in the file is equal to the sum
of the number of tips since the last log entry and a new rain bucket tip amount, divided by 10.
If the rain bucket tip size did not change since the previous log entry, this part is omitted. Most
of the entries will be integers: 0,1,2 and so on depending on how many times the bucket tipped
since the last log entry. If the rain bucket tipping amount is changed, the first log entry made
with the new tip size will contain a fractional part equal to the tip size divided by 10.
For example, assume the tip amount is changed to 0.0123456 inches. After accepting this
change the program will exit. After restarting the program, the first new entry in the log file
(assuming no rain has occurred meanwhile) would be 0.00123456. This value represents zero
bucket tips plus one tenth of the new bucket size. If one bucket tip had occurred the value
would be 1.00123456.
Windows Regional and Language Issues
Most users will never encounter problems with Windows language settings, but when they do
occur, it can be frustrating. This section tries to explain some of the issues involved to make
troubleshooting these problems a bit easier. Unless you are experiencing problems with the
regional/language settings in Windows this section can be safely skipped. Just remember that
this section exists if you ever run into such problems.
In the Windows operating system, users can set the “Region” or “Language” – this controls how
various kinds of data are formatted. This is also known as the “Culture” setting. For example,
in much of Europe the comma character (“,”) is used as the decimal point while in the United
States a period character (“.”) is used for this purpose. In Europe, three and forty-five
hundredths would be written as “3,45” while in the U.S. it is “3.45”.
Formatting of other types of data such as dates and times is also controlled by these Windows
options. For example, in the U.S., the first day of the month of May in the year 2000 is
represented as “5/1/2000”. In Finland, this changes to “1.5.2000”.
To see all the different formats affected by regional and language settings, open the Control
Panel and double-click on “Regional and Language Options”. Then in the “Regional Options”
tab click “Customize”. The window that pops up has four tabs and shows all of the different
data formats that are part affected by the culture setting.
Versions of WSDL prior to 3.4 may not have worked with Windows language settings other than
English (United States). One of the major reasons for this was the comma separator used for
data fields in the log file. In many countries, the comma is used instead of a period to separate
the integer and fractional parts of numbers. This causes obvious problems when data fields are
also separated by commas. Starting with version 3.4, language-specific characters are used to
separate fields in the log file. For example in Finland, a semi-colon (“;”) is used instead of the
comma.
Log files are now language-specific. The first line in the log file will look something like this
(for example):
CULTURE;en-US
This specifies which Windows culture setting was used to create the log file. When WSDL loads
a log file, it compares the computer’s current culture setting to what is in the log file. If they
are different, the log file must be converted to the new culture before it can be loaded. WSDL
will do this automatically.
For example, a log file created with the computer’s regional language set to Finnish should
load properly if the computer’s regional language is changed to English (US). The user must exit
WSDL before changing the language setting, and restart WSDL afterwards. When restarted,
WSDL will backup the log file and then convert it according to the new language setting. If
there are any problems with this, you can always restore the backup copy of the log file and
change the culture setting back to the original setting.
This is not the end of issues that can arise with culture settings in Windows. Things get more
difficult when culture settings are customized. For example, assume a log file has been created
with the culture set to “en-US”. Next, assume the “en-US” culture is customized (using the
Control Panel) so that numbers are in European format (periods for thousands separators,
commas for decimal points and a semi-colon as the CSV list separator). This creates big trouble
because Windows does not rename the culture – it is still called “en-US”. Now when WSDL tries
to load the log file it will read the first line and get this:
CULTURE;en-US
Next WSDL checks the computer’s current culture setting, which is also “en-US”. WSDL now
thinks the log file is in the correct culture and goes ahead with loading. This will fail because
the computer’s version of “en-US” is now different than what is in the log file.
Similar problems will occur if a log file created under a customized culture is copied to a
computer with a non-customized culture, or vice-versa.
It should now be clear that the problem is created by the fact that Windows does not rename
the culture when it is customized through the Control Panel. WSDL cannot tell whether the
culture has been customized and whether it is any different that what is specified in the log
file.
There are three common ways to create these problems:
1. A culture setting is customized when a WSDL log file is already in existence.
2. A WSDL log file is moved to a different computer, and one of the two computers has
customized culture settings.
3. A WSDL log file is moved to a computer with a different version of Windows and the
two versions of Windows have different culture settings. For example, the Italian
language setting for Windows XP is different than for Windows 7.
Here are some suggested steps to avoid the problems.
•
Return the log file to the original location and/or set the custom culture settings back
to their original values. WSDL should be able to load the log file without error now.
•
Exit WSDL.
•
Change the culture setting to a different, non-customized culture. We’ll call this the
“temporary culture”. This can be any culture other than the final target culture. As an
example, if your usual culture setting was “en-US”, it could be changed to “en-GB”.
•
Restart WSDL and it should convert the log file into the temporary culture. Exit WSDL
again.
•
There are two paths forward now, depending on the problem being solved:
o
If you are trying to customize a culture on the same computer, then set the
computer’s culture back to the original culture and customize it.
Restart WSDL and it should convert the log file from the temporary
culture into the newly customized culture.
o
If you are trying to move the log file to a different computer, then change the
destination computer’s culture setting to the desired final value, including any
customizations.
o
Copy the log file onto the destination computer and start WSDL. WSDL
will convert the log file from the temporary culture into the
destination computer’s current culture setting.
In both cases above, it is crucial that the temporary culture is NOT customized
on any of the involved computers.
The Message Log
Everything written to the message window is also recorded in a message log file
(WxMessageLog.txt ). This occurs whether the message window is visible or not.
The message log is in the same directory as the weather log.
If you are having a problem with the software, it can be helpful to review the message log file
with a text editor.
Beginning with version 3.4, wireless communications statistics are written to the log file once
per hour. This data contains estimates and should not be assumed to be 100% accurate. The
data is useful for determining the general health of the wireless connection to the various
sensors.
Based on how often each sensor reports over the USB connection, WSDL tries to determine an
average value for each sensor. The average will vary based on the sensor, and even varies if
you change the channel number of a sensor. Then, using the estimated average WSDL attempts
to keep track of missing updates from each sensor. Once every hour, a summary of this data is
written to the message log file, and the totals are reset to zero again.
Don’t get all worried if you are missing as many as 3-5 readings per hour – this could be normal.
Even larger counts are normal from the anemometer. Once the count starts getting larger than
this however, you might have a problem. Watching for trends is useful. If a sensor normally
shows fewer than 5 missed readings per hour and then starts creeping up, look for something
that has changed – low batteries, something physically moved, etc. There could even be some
problem developing in the senor, but you will need to take that up with the manufacturer – and
they may or may not put much faith in the statistics from WSDL.
The other obvious cause of a lot of missed readings is that the sensor is just too far away, or
there are too many walls, trees, etc. between the sensor and the indoor console.
The Weather Station Clock
The weather station has a clock that can synchronize itself to a radio broadcast standard time
signal. This makes the clock pretty darn accurate, but this program does not offer an option to
set the computer’s time-of-day clock from the weather station clock. Why not?
There are currently a few reasons for this.
•
There is an unknown amount of delay in the transmission of the USB data to the
computer. Although it is likely less than a second or two it is still an unknown.
•
The clock does not automatically know the proper time zone – it must be set by the
user. It would be more useful if the clock always reported time in UTC.
•
Windows Vista (and later) may have issues with user programs trying to adjust the
system clock. This is not known for sure by the author, but until that can be resolved
there would not be much point in adding the capability.
•
Quite often, the computer running the WSDL software will have a live internet
connection. In this case, it makes more sense to use NTP (network time protocol) to
keep the computer’s clock accurate.
In summary, it would not be difficult to add this feature, but it is of questionable value.
Battery Status
The accuracy of battery status indicators for the WMR200 may be inaccurate. The project is
working to get this fixed as soon as practical.
By clicking on the “Details” button below battery information in the main window, a battery
status panel will pop-up. This panel shows the status of each set of batteries in the weather
station. This includes:
•
The indoor console battery
•
Anemometer battery
•
Wireless temperature sensor batteries ***
•
Rain gage battery
•
UV sensor battery
*** The WMR100N has a separate outdoor temperature sensor while the older WMR100 had the
temperature sensor integrated into the anemometer. The temperature sensor battery reading
for channel #1 is only valid for the WMR100N and WMR200 models. WMR100 owners should
ignore the status indicator for channel #1.
It also indicates whether the indoor console is connected to an AC power source.
If a wireless sensor has not been heard from for a while (i.e. it has “timed out”) the battery
status will indicate this fact. The timeout period can be adjusted in the options window (under
the “Hardware tab).
Signal Strength
WSDL versions 4.1.8.0 and later will also display wireless sensor signal strengths in the battery
status panel if the custom Weather Shield for Arduino is enabled. The hand-built version of the
weather shield using the RX3400 receiver module on a breakout board does not support this
feature.
Signal strengths are only approximate but are still useful for adjusting the receive antenna
location and tuning the length of the antenna. Sensors can be reliably received with signal
strengths at least as low as -90dBm. The receiver sensitivity level is somewhere between -100
and -110dBm. Depending on the exact circumstances, sensors with signal levels below -90dBm
may also be reliably received, or reception may become intermittent.
Program Options
Version 4.2
Options are still stored in the same “user.config” file as before. However, they have been split
into three different groups – server, client and FTP graphics settings. The first time a version
4.2 (or later) program is run, it will copy options from the original group (called
“WMR100WxStation.Properties.Settings” in the file), and split them into the three new groups.
When examining the user.config file, be aware that most of the values in the original group are
no longer in use. If these values are modified manually, it will have no effect. Future versions
of WSDL may clean up the original group, removing most of the settings in that group.
The ability to migrate options from program versions prior to version 3 has been removed. If
you have an old version, then install the last version 3 release of WSDL and run it once prior to
installing version 4.
Version 3.4
This version changes the formatting of numeric data and date/time information in the
user.config file (and the WxLogger.exe.config file also).
Previous versions used the computer’s current language setting for some of the data in these
files. Starting with version 3.4, this data is always formatted according to English (United
States) customs. The change was necessary so that WSDL will work properly in a wider range of
language settings.
Efforts have been made to ensure that WSDL will correctly import options from earlier versions
with different language settings. However, if this fails previous option setting files will not be
altered. If options fail to import successfully, users can examine a previous options file
(user.config) to manually recover the old settings. Also, it is possible to un-install version 3.4
and re-install the previous version of WSDL. The previous options should load without any
problems in this case.
General
Options are independent for each user account on the computer. Program options are stored in
an XML file located in an automatically determined directory. Most users will not need to know
even this much. The rest of this section contains more detailed information about the storage
of program options.
Options are stored in a user.config file which is located in your user directory. In XP this
directory path begins with “\Documents and Settings\<user name>\...” In Windows 7 the path is
“\Users\<user name>\...” where the string “<user name>” represents the user’s Windows login
name. If your user name is “Fred” then the options directory path will start with
“\Users\Fred\...” in Windows 7.
Each version of WSDL released will keep option settings in a different sub-directory – named
after the program version (e.g. “2.8.8.1”). When a new version is installed it will offer the user
an option to copy options from the previous version. It is always a good idea to check the
imported options for accuracy, and to see what new options might be present.
Early Versions of WSDL
Versions of the program prior to 2.5 used the registry to store option settings. Everything was
kept under the key HKLM/Software/WMR100. During program startup, if this key does not exist
it will be created and populated with default values. If the registry key does exist, values for
display and log file units are loaded into the program. Among other things, values in the
registry are used to specify display and log file units and backup configuration settings.
Registry values have meaningful names, so it is worthwhile examining the WMR100 registry key
with regedit.
Versions 2.5 and later store option settings in an XML text file in the user's local settings
directory. This change was necessary for non-privileged users to use the program on Windows
Vista.
The full path to the XML settings file may contain some oddly named directories. It can usually
be located by starting in the following sub-folder of the Documents and Settings folder:
Local Settings\Application Data\WMRx00
If you cannot find it there, search the Documents and Settings folder for a sub-folder named
WMRx00.
Versions 2.5 and later are designed to copy registry settings from earlier versions the first time
the program is run. These settings are then saved in the XML file and the old registry settings
can be deleted manually if desired.
Changes in version 2.8
This program version will store the XML options file in a different directory. In some cases, it
might require a bit more effort to transfer options from version 2.5. Versions after 2.8 should
not have this problem.
If the options fail to upgrade, try looking for a “user.config” file from version 2.5. Manually
copy this file to the version 2.8 directory.
Editing Options
The options file can be viewed in a text editor or an XML editor. It is tempting to try editing
this file by hand for some folks. This can work, but can also result in a corrupt options file.
Therefore, before making any manual changes like this, be sure to save a backup copy
somewhere.
To repeat – users are generally discouraged from hand-editing the user.config file. However,
since “Easter eggs” may be hidden in this file, there may be a need to do this. If you decide to
this, then please pay heed to the following.
In the file there are setting names and values. Changing the settings names is not
recommended. Changing the values can work if the new value is legal.
On last warning – this file is not your normal text file. It uses a special character coding
standard called “UTF-8”. For most keyboard characters this is no different than a normal
(meaning ASCII) text file. However, there are some characters that cause problems. For
example adding the ‘ ä ’ character to this file with a text editor will cause it to become
corrupt. The UTF-8 character coding standard uses a different method to represent this
character than your text editor does.
If you have a good XML editor, it may be able to correctly add such special characters. Just be
sure to make a backup copy before trying it out.
All numeric, date and time information MUST be formatted using US English standards. Unlike
the log file, the formatting of data in this file is invariant – it does not change if the language
setting of the computer is altered.
Part III
Reference
The Menu
File...Write Daily Extremes
This function has been enhanced in version 3.0. The old version only produced extremes for
two temperature sensors (indoor and outdoor). All wireless sensors are now supported. It was
necessary to re-arrange columns in the output file, and this may affect compatibility for some
users.
Selecting “Write Daily Extremes” in the “File” menu will cause the current log file to be
analyzed, and daily extreme values for each day in the log file will be written to a new CSV file
in the weather log directory. The new file name will indicate the range of dates covered by the
data. This file is in log file units, except for dates and times (which use the display time zone
or UTC offset).
The log file name will be based on the range of dates and times in the log file (using the log
file time zone or UTC offset). Dates actually written to the file however will use the current
display time zone or UTC offset.
This function will re-read the entire log file from disk – so it may take a while to finish if the
log file is large.
File...Kick Start
Once the program is running and receiving data from the WMR100 console, there is usually no
need for the PC to send data to the console. The WMR100 will send a continuous stream of data
to the PC without any periodic prompting from the PC.
There are times at which the console might need a “kick start” to get the data stream started.
This is accomplished by two mechanisms within the program. First, there is a timer which will
automatically kick start the console if a certain amount of time lapses (around 30 seconds or
so) with no valid messages from the console. There is also a “Kick Start” selection under the
“File” menu which will force a kick start when pressed. In most cases, forcing a manual kick
start should not be necessary.
View...Temperatures...Left/Right
These menus configure which temperature sensors are displayed in the text boxes showing
current temperatures and 15-minute temperature rates. Since the labels in these boxes are
user defined, it is possible for the text to overflow if long sensor names are chosen.
View...Barometer...SLP/QNH
The barometer display always shows station pressure on the left. The readout on the right can
be configured to display either sea level pressure (SLP) as reported by the WMR100 console, or
altimeter setting (QNH) as calculated by WSDL. The QNH calculation uses the elevation entered
into the CWOP setup (see the Upload tab in the options dialog). To learn more about the
barometer values, see the section titled “The WMR100 Barometer” earlier in this manual.
View...Compass Points
When enabled, the anemometer readout will display wind direction as the nearest compass
point instead of in degrees. The METAR and peak gust displays will still be in degrees however.
View...Message Window
This menu choice will make a text window visible at the bottom of the screen, containing
various informational and error messages.
View...Enable
This brings up a sub-menu which gives you some control over what messages are shown in the
message window. With all of the choices disabled, only error messages are shown. Error
messages cannot be disabled. There are two choices in the view menu for convenience which
will enable or disable all choices at once.
View...Enable...Data Messages
This causes decoded messages from the weather station to be logged.
View...Enable...Raw Records
Complete messages will be shown in hexadecimal format before being decoded.
View...Enable...Received Data
Raw data received through the USB port is shown in hexadecimal form, prior to being split into
separate messages.
View...Enable All / Disable All
These choices will turn all messages listed above either on or off with a single operation.
Graph...Show Temperature / Show RH / Show Dew Point
Since the temperature graph can get cluttered at times, temperature, relative humidity and/or
dew point can be omitted from the plot. These menu picks allow you choose what is plotted. It
is not possible to turn off all items (temperature, dew point and RH) at once. For example, to
change from graphing only temperature to graphing only RH, you must first turn the RH graph
ON, and then turn the temperature graph OFF.
Graph...Show Sensors
Use this menu to choose which temperature sensors are graphed. Graph colors, and the way in
which they are assigned to sensors can be configured in the options dialog. It is not possible to
turn of graphing of all sensors. If only one sensor is being graphed and you want to switch to a
different sensor, you must first turn the other sensor on, and then turn off the original sensor.
See the description of the graph window for more information.
Graph...Show Rain Rate
Selecting this option enables a second Y axis for the precipitation graph which shows the rain
rate as reported by the WMR100.
Graph...Graph Wind Wraps
This option is on (checked) by default. When wind direction is graphed, the line sometimes
“wraps around” between the top and bottom of the graph or vice-versa. There are two ways
this can be displayed:
1. A straight line is drawn from the last data point before the wrap and the first data
point after the wrap. This makes it very obvious that a wrap has occurred because
there is a long vertical straight line staring you in the face.
2. The direction graph is continued after the last point before the wrap, in the same
direction until it disappears off the top (or bottom) of the graph. A new line is then
started at the bottom (or top) of the screen and continues on to the first point after
the wrap. With this option it is not so obvious that a wrap has occurred, but the graph
is less cluttered and some may find it easier on the eyes.
The choice is entirely subjective so experiment and see which one you find preferable.
Graph...Wind Gust
There are three choices for the wind gust graph curve. The default is averaged data which is
what was graphed in WSDL versions prior to 3.0. The data is averaged over a 30-minute
window. The data looks much smoother, but actual peak gust values will be attenuated.
The second choice shows wind gusts filtered through a 10minute peak-hold process with a slow
decay period. This still keeps the data looking fairly smooth, and actual peak gust values are
never attenuated.
The third choice displays raw, unfiltered one-minute peak gust data directly from the weather
log. This graph option usually results in a cluttered display, but you can zoom in and see the
actual 1-minute peak gust readings when that is of interest.
Graph...Wind Direction Origin
The Y-axis off the wind direction graph normally runs from 0 degrees (North), through 90 (E),
180 (S), 270 (W) and finally to 360 (North again). As the wind direction moves from NW through
N to NE, the graphed line will “wrap around”, or jump from the top of the chart to bottom.
If you live in an area where the wind frequently crosses through north, this can result in a lot
of “clutter” in the graph. This menu feature allows the bottom-top wrap-around point of the
graph to be set to another direction, effectively minimizing the “clutter”. It is helpful to
experiment with this feature to understand what it does, and discover what setting works best
for you.
Graph...Barometer...SLP/QNH/QFE
Starting in version 3.0, it is now possible to graph one of three different pressure readings, sea
level pressure (SLP), altimeter setting (QNH) or raw station pressure (QFE).
Graph...Barometer...Remove Tides
Click on this item to enable or disable; a check mark appears next to it when enabled. For this
function to work, there must be at least 10 days worth of barometric pressure readings
available in the weather log, although up to 32 days worth of readings will be used if available.
When enabled, WSDL will perform a harmonic analysis of barometric pressure once a day,
producing estimates of atmospheric tidal components with periods of 24, 12, 8 and 6 hours.
These estimates are then used to remove tidal variations from the barometric pressure graphs.
This works with all three types of graphs, SLP, QNH and QFE.
Graph...[Save/Load/Delete]Config
This group of menu items will allow you to save and restore graphics layouts. For example,
there could be different graph layouts for stormy weather, heat waves or windy weather. The
saved layout includes the number of graphs, graph types and all other graph display options
available for each graph. If FTP graphics are coupled to the main window, they will also change
when a new configuration is loaded.
Graph...Update FTP Config
This menu choice only appears when the “Coupled to Main Window” option (in the FTP tab of
the options window) is un-checked. Clicking this menu choice will set the number and type of
graphs generated for FTP upload to match the current WSDL main window configuration. FTP
upload graphics are not generated unless the “Enable Graphics” option is checked (in the FTP
tab of the options window).
Graph...Load FTP Config
This menu choice is only visible when FTP graphics are not coupled to the main window.
Clicking this menu item will cause the currently configured set of FTP graphics to be loaded on
the main window. It is useful for making minor modifications to the FTP graphics settings. A
typical sequence of operations would be to load the FTP graphics configuration, then make a
few modifications, then click the “Update FTP Config” menu pick to save the new settings.
Tools...Options...
This brings up the options dialog window (see below).
Tools...Internet Options...
This opens a second options window which contains options pertaining to the internet, web
pages and so on.
Tools...Write Processed Log...
Normally, the weather log file only contains the rain amounts reported by the base station,
plus optional rain bucket tip counts. The rainfall total display however can show totals with
“reset processing” or based on cumulative bucket tip counts (see the chapter on the options
window for more detail).
This utility will take the data from a weather log and compute rainfall totals using “reset
processing” and tip counts. A new CSV file is then written which contains these additional
computed rainfall totals. This is handy when you want to create graphs or perform other data
analysis on the logged rain data. Without the utility, you would have to compute these totals
yourself, which is tedious and error-prone.
A file dialog will pop up and you can specify any valid weather log file for processing. For
example, previously saved backup files can be specified, or the currently active weather log
can be selected.
The new CSV output file contains all of the data in the original file, except rain data is
replaced with computed totals. As such, this file is not suitable for use by the Weather Station
Data Logger as a log file.
The original log file is not altered – a new filename is created by appending “-Processed” to the
original name. The new file is always created in the same directory as the original file. If a
processed log already exists, the utility will abort.
As an example, if you choose to process “WxLog.csv”, the new, processed file will be named
“WxLog-Processed.csv”.
Tools...Normal Temperature Calculator
This is an aid in finding the correct value for your “Normal Temperature” – this value is needed
if you choose to have WSDL compute sea-level pressure and your elevation is above 1000 feet.
See the reference section on station data in the Options window for more detail.
Tools...Arduino Sensor Manager...
This is only available if Arduino hardware has been configured in the Options window. See the
reference section on Arduino for more information on this tool.
Tools...Clear All Arduino Sensors...
This erases all stored information about sensors reported by Arduino. See the reference section
on Arduino for more information.
Tools...Manual Rain Input...
This will pop up a dialog where the user can enter a rainfall amount to be recorded in the
weather log. After entering the data and pressing “OK”, a second dialog will pop up to confirm
the rainfall amount. The actual process of recording the amount in the weather log can require
up to two minutes to complete. See the section on rain data processing earlier in this manual
for more information.
Tools...Multi-point Calibration Data...
This opens a window for editing multi-point calibration data. This applies only to temperature
and humidity data. This capability is described in the Calibration section of the Features
section of this manual.
Tools...Update Options from Server...
This is only available when WSDL is running in client mode. This will copy all option settings
from the server and save them on the client. After saving options, WSDL will exit and must be
restarted. This is mostly used for initializing new clients.
If the server and client are running as the same user on the same computer, then client options
are stored in the same file as server options. In this case, the current options will over-write
themselves! Although this will not hurt anything, it is rather silly.
If the server is running on the same computer as the client, but the client is running as a
different user than the server then options are not stored in the same file and this copy makes
sense.
The Main Display Window
The main window contains several groups of numeric displays and controls, plus a large X-Y
graph. Each group of displays or controls is in an outlined, labeled box. Each section below is
organized by the box's title.
Starting with version 2.8, the main window can be resized to a larger size (there is a minimum
size, however). The advantage of making the window larger is that the size of the graph area is
increased, making cluttered graphs with a lot of data easier to read. The other displays on
screen do not change size and are simply re-positioned to make room for the larger graph.
Data Color Legend
Most data displays in the application window are color coded to indicate their “age”. When the
program first starts, data displays are not visible until at least one update has been received
from the station console. Green represents current data, yellow (gold) indicates aging data and
red is used to flag data that has not been updated for at least a couple of minutes.
Individual data values in the weather log will be omitted by outputting empty CSV fields if a
particular piece of data has become too old.
Temperatures
This group displays the current readings from two temperature sensors. The most current
reading from each sensor is shown under the “Temperatures” heading, where three rows of
numbers are shown. The first row contains temperatures, followed by dew points and relative
humidity.
You can choose which two sensors are displayed. See the View...Temperatures menu
description above for more information.
Since the names for these sensors are user defined, it is possible the text labels will overflow
the available space for display. This can be fixed by shortening the name to fit within available
space.
Temperature Rates
To the right of temperature data is rate-of-change information for temperature and dew point,
under the heading “15-min Rates”. Temperature rates are computed over a 15-minute interval
using linear regression to estimate an hourly rate-of-change.
Rates are shown for the same two sensors chosen for the “Temperatures” group above.
Anemometer
There are three different wind displays, stacked vertically. The top display shows the most
recent weather station readings. In the middle is a METAR report and on the bottom displays
the largest gust within the last hour.
WMR100 wind data contains current speed and direction, plus an averaged speed. This data is
displayed as the top readout.
The middle of the three readouts contains a METAR-format wind report. The METAR report can
either be “strict”, or less formal, showing more information. METAR data is computed using a
2-minute averaging period and a 10-minute window for reporting wind gusts. The strict version
attempts to comply with known standards for METARs. The non-strict option removes some of
the thresholds for reporting gusts and variable wind which shows more information if you live in
an area without a lot of wind. The strict option can be turned on or off in the options window.
The bottom readout shows the largest wind speed and its direction recorded during the last
hour.
Barometer
Two pressure readings are received from the weather console – a raw “station” pressure (QFE)
plus a reading corrected for altitude (probably an improperly computed version of SLP output
by the WMR100). The corrected reading will not be accurate unless the user has set the
station's elevation correctly on the weather console. After setting the station elevation on the
WMR100 console, it can take up to 15 minutes for the corrected reading to adjust.
The corrected reading defaults to SLP (as reported by the WMR100) but there is an option to
display altimeter setting (QNH) instead. Starting in version 3.0, an option is provided to have
WSDL compute SLP and display that instead of the WMR100’s reported SLP. Details are
contained elsewhere in this manual.
Rate of change for pressure is computed over a 3-hour interval and displayed as an hourly rate.
Versions prior to 2.5 used a 15-minute interval to compute rate. Version 2.5 used a 2-hour
interval. This turned out to be too short a period, partly because the WMR100's barometer has
a low resolution (1mb or 0.03 inHg). Because of this relatively low resolution, changes
occurring in a 15-minute period are usually too small to be seen. Version 2.8 uses a 3-hour
period because that averaging period is also used in METAR reports.
Precipitation
The Weather Station Data Logger offers a significant advantage in its ability to track yearly
rainfall totals regardless of any reset operations performed on the WMR100 console unit.
Because of this, the data displayed in this group of readouts may be different than what is
shown on the WMR100 console. Please read the chapter on “Rainfall Data Processing” for an
explanation of the options available.
When rainfall reset processing is disabled in the options window, this readout will be identical
to the weather console data. Otherwise, the data is processed as described in the chapter on
“Rainfall Data Processing”.
Station Clock
The most recently received clock value from the console is displayed under the “Station Clock”
heading. An indicator below the time and date indicates whether the clock is synchronized to a
time standard radio signal or not.
For now, the station clock value is not used anywhere else in the program. Time stamps
associated with logged data use the computer's time and date. The data logger program does
not offer the ability to set the computer's clock from the station clock.
Battery Status
There are batteries in the main weather station console, the outdoor anemometer, any extra
wireless sensors, and the rain bucket. The battery status for each of these units is indicated by
a colored rectangle. There are only two states or colors, okay (green) and low (red).
Battery state for all extra wireless temperature sensors is combined into a single readout. If all
sensor batteries are okay, it will be bright green. If one or more of the extra sensors is not
communicating, but the remaining sensor batteries are okay the color will be a dim green.
Finally, if any of the sensors are reporting a low battery state the color will be red.
When there is a low battery condition on an extra sensor, the user must scroll through the
sensors on the WMR100 console to determine which sensor(s) have a low battery condition.
If the WeatherJack barometer is enabled, its battery state is also shown here.
Counters / Timers
This area displays counters for USB data messages received from the weather station plus the
number of internet uploads made since the program was started. There are separate counters
for Weather Underground, CWOP and FTP uploads.
For internet uploads, there is also a clock display which shows how much time has elapsed
(minutes and seconds) since the last successful upload. The color of the label will stay green
until the next upload is due, at which time it will become yellow. If one minute has passed
after the upload was due without a successful upload, the timer label will turn red.
The internet counters and timers will only be visible when the corresponding upload option has
been enabled in the options dialog window.
When historical data is being collected from the WMR200 console, the upload counters for PWS
Weather and Weather Underground will increment as historical data is uploaded to those sites.
Forecasts
The so-called weather forecasts displayed on the WMR100 console are shown in this window.
Due to limited real-estate in the display this window is only visible the size of the main window
is past a certain point. With some very small display monitors, it may not be possible to make
the window large enough for this readout to appear.
There are two forecasts: “Station” and “QNF” (or “SLP”) forecasts. The exact difference
between these two readouts is not known exactly. It is reasonable to surmise they are both
based on the barometer reading, and may also include information from indoor and/or outdoor
temperature/humidity sensors. The station forecast probably uses the QFE barometer (station
pressure) while other forecast may use the computed SLP pressure (sometimes also called QNF)
barometer reading.
The Graph(s)
Up to sixteen X-Y graphs are provided which can be used to graph temperature, pressure, wind,
and precipitation or UV data. The number of graphs can be changed in the Options dialog
window – under the “Misc” tab. A group of radio buttons on the right side of the graph allows
the graph data to be selected.
The overall graphics setup (number of graphs, graph colors and individual graph settings) can
be saved under a user-defined name, and later recalled. This capability is accessed through the
“Graph” menu. Different configurations may be of interest for different types of weather –
storms versus heat waves for example.
All data for the graph comes from the current weather log file, and the graph is updated once
per minute after the log file updates.
Under the “Graph” menu are selections to control graphing of relative humidity, dew point,
barometric pressure, wind data and rain rate.
If there is a gap (missing data) in the log file longer than eleven minutes (by default) then a
gap will be shown in the graphed data to indicate there is missing data. The time limit
(threshold) for graphing gaps can be changed in the options window (under the “Misc” tab).
Setting the time limit to zero effectively disables the graphing of data gaps.
Changes made to the graph type and configuration options described above will be reflected in
FTP graphics beginning with the next FTP upload operation.
Wind data tends to be extremely noisy, and graphing the data is often visually confusing.
Therefore, an advanced filtering technique is used to remove some of this noise and make it
easier to see trends in the data. The filtering technique uses a sliding 30-minute window and
requires at least 30 minutes worth of wind data to get results. This graph is labeled “Average
Speed”. As a result of this filtering process, don't expect changes in the numeric wind readout
to show up immediately in the graph.
There are three choices for graphing wind gust data – averaged, peak hold and raw. As with
average wind speed, raw gust data is quite noisy. The peak hold option graphs the largest gust
in a 10-minute window followed by a slow decay afterwards. The averaging option will provide
a lot of smoothing for gust data but gust peaks will be diminished significantly.
Starting with version 2.8, users can choose which temperature sensors are graphed (in the View
menu), and the colors used to graph each sensor’s data (in the Options dialog window).
Graphing of temperature, dew point and relative humidity data can be individually enabled or
disabled.
The program will not allow graphing of all sensors to be turned off at once, as this would result
in a blank graph. For example let’s say you are graphing only the indoor sensor and wish to
change to graphing only the outdoor sensor. You must first enable graphing of the outdoor
sensor and then disable graphing of the indoor sensor. If you were to first disable the indoor
sensor graph, then all graphs would be turned off – and WSDL does not allow this.
Rain rate can now be (optionally) shown on the precipitation graph.
The graph menu also allows the origin of the right-side Y axis representing wind direction to be
changed. See the description of the Graph menu for details.
The X-axis length can be set anywhere from ½ day to 30 days. The graph length up/down
buttons will change the length in ½ day increments. Alternatively, any decimal number
between 0.5 and 30.0 may be entered directly into the control. When the graph length is
changed, the current weather log is re-loaded and the in-memory copy of the log is trimmed to
the requested time span. The X-axis then becomes a sliding window, always showing the most
recent set of data in the weather log.
The graph window is interactive, so try click-drag operations and right-clicking in the window
to explore its capabilities.
Multiple Graphs
Several (up to sixteen) graphs can be displayed in the WSDL window simultaneously. This is
configured in the options dialog (under the “Misc” tab). Each graph can be independently
configured with a different graph type, graph length and display options. WSDL remembers
these settings until you change them again.
When multiple graphs are displayed, only one of them is “active” at any given time. The active
graph is identified by the addition of a black border. The active graph can be changed by
clicking on the desired graph. If one or more graphs have “Insufficient Data”, it can still be
selected by clicking on the “Insufficient Data” text label.
When you change the graph type, graph length or any of the options in the “Graph” menu,
those changes are applied to the active graph. WSDL will remember the settings you make
even after the active graph is changed. When a different active graph is selected, all of the
controls used to set graph options are updated to reflect current settings for the newly
activated graph.
This setup is extremely flexible. Play around with it a bit and you’ll discover that just about
any combination of graph data can be setup. Remember, each graph can have its own time
length, graph type and set of options (such as temperature sensor list, barometer data type,
etc).
The graphing package used here is called “ZedGraph”, written by J. Champion. This is a very
nice, versatile package and is available free of charge under the LGPL license from the Code
Project. Hats off to J. Champion for this great package!
Graph Colors
In addition to being able to choose colors for temperature graphs, WSDL versions 4.0 and later
provide for changing other graph colors, including background and grid-line colors.
The ability to completely control all colors used by WSDL would be part of a larger “skins”
enhancement effort – but for now, the user cannot change any other colors in the WSDL
window.
In addition to colors for the various data graphs, there are settings for background and grid
colors. The default color values are partially transparent – which allows the color beneath the
graph itself (which is slate gray) to show through. Users can also experiment with fully opaque
colors for the background and grid lines.
Any invalid color specifications are entered into the user.config file, that particular color will
default to “Black”. This is your clue that the color you entered is probably invalid. If the colors
get totally messed up you can recover by hitting the “Default Colors” button(s) in the option
window.
The list of valid color names recognized by windows is the same as explained elsewhere in this
manual. See the following web site for the list:
http://msdn.microsoft.com/en-us/library/aa358802(VS.85).aspx
Or search the internet for “colors by name”. You can also specify hexadecimal colors – precede
the color name with a “#” character and enter either exactly six or eight hexadecimal
characters. With six characters, the data is RRGGBB. Use eight characters to include some
transparency where the data is AARRGGBB (AA is the alpha or opaqueness value).
One final note – the color entry named “RawBarometerColor” is only used with the
WeatherJack or Bosch BMP085 (on the Arduino Weather Shield) barometers – it will not have
any effect unless WeatherJack is enabled in the options window.
The Options Window
Units Tab
There are two independent sets of units available, log and display units. Display units affect
the displayed numeric values in the program window, and may be changed at any time by
clicking on the “Tools” menu and selecting “Options”. Saved changes will be reflected
immediately.
Log units affect the numeric data stored in the log file. In most cases, you will want the display
units to be the same as the log units (except for time zone). Changing log units is a bit
complicated. When the program starts up, a preexisting log file will normally override any
changes you have made in the options window. This has the effect of discarding your changes –
and you will be notified of this event. To avoid this, the program would have to convert all
data in the log file into the new units and then re-write the log file. Instead, the more simple
approach is taken – once a weather log file is created, its units cannot be changed.
If you want changes to log file units to “stick”, the old log file must be deleted, renamed or
moved before the program is restarted. Changing the log file directory will also accomplish this
(assuming the new directory does not contain a weather log file). The program will attempt to
help you through this process with some dialog windows. See the section about the log file for
more details.
Starting with version 2.5, the computer's local time zone may be chosen instead of a fixed
offset from UTC.
The hour of the day used as a cutoff for computing daily extremes is set here. This value is
always interpreted in the display time-zone – not the log time-zone. Normally, you should set
this to zero (midnight), especially if you are uploading data to Weather Underground.
See the section covering the “Anemometer” display group for a discussion of the “Strict”
METAR wind format check-box. This setting does not affect the data uploaded to Weather
Underground.
Time Zones
It is recommended that the log file be kept in the UTC time zone (zero UTC offset). A fixed
UTC offset is also okay. Users are highly discouraged against keeping the log file in the
computer's local time zone. If you follow these suggestions, you can skip the rest of this
section. For the curious, read on...
Time can be either kept in the computer's local time zone (which might include periods of
daylight savings time), or with a fixed hour offset from UTC (static – no daylight savings time).
If you select the local time zone for log file data, things will not work correctly if you change
the computer's time zone setting. Log file data will be interpreted in the new time zone
without any conversion – which of course is wrong.
A discussion of how Windows manages time will help. Windows keeps time internally in the
local time zone, which unfortunately can be effected by daylight savings time shifts. This
means that in the spring, a full hour is skipped – times between 2AM and 3AM are invalid. In the
fall, a full hour is repeated – for example, 1:30AM occurs twice in one day! So the questions
arises – if you are told it is 1:30AM the morning daylight savings time goes off in the fall, which
version of 1:30AM is it -- the one that occurred before the time switch (90 minutes after
midnight), or the one that occurred after the time switch (150 minutes after midnight)? The
answer to this question is either 1:30AM PDT (90 minutes after midnight) or 1:30AM PST (150
minutes after midnight) – but this program (and Windows for that matter) is not really setup to
deal with this correctly.
Although ambiguous time values might be okay on the computer monitor (you are smart enough
to sort this out in your head), it can play havoc with the data in the log file. A much better
solution is to keep the log file in a time zone that does not observe daylight savings time.
Perhaps the best choice is what used to be called GMT (Greenwich Mean Time) and is now
called UTC (Universal Coordinated Time – yeah the acronym seems wrong, but that's what they
use). With this choice, time never goes backwards or skips an hour in the log file, and it can be
easily and unambiguously converted into any other time zone for display (including time zones
that use daylight savings time).
Rainfall Data Source
There are now three choices for rain data processing. The first choice (no reset processing) just
uses the (calibrated) rain data from the WMR100. The other two choices use data stored in the
weather log with additional processing.
The “Adjusted for resets” option uses calibrated WMR100 data from the weather log, with reset
events removed. A “reset event” occurs when the WMR100’s rainfall total is reset to zero. This
is detected by the software whenever a new rain total is less than the previous value. When a
reset event is detected, the software adds a numeric offset to new rain totals to effectively
remove the reset event. For example, assume this series of rain totals is in the log file: {6.55,
6.56, 6.56, 0.00, 0.03}. A reset event is detected at the 4th value and an offset of 6.56 will be
applied to all subsequent readings. The adjusted readings are now: {6.55,6.56,6.56,6.56,6.59}.
After removing all detected resets, the software will go back through the data and force new
resets to zero on November 1st of each year – this is the date when annual rainfall totals are
normally reset to zero. After this processing is complete, the rainfall data shown in displays
and graphs represents annual total amounts.
Opting for “Rain bucket tip counting” should only be used if you have performed a custom
calibration of your WMR100 rain gage. This option is grayed-out unless the option to count
bucket tips in the log file is enabled (Log tab) AND the log file includes bucket tip data. See the
appendix on calibration for more information. The appendices have been moved to a
separately downloadable document.
Log Tab
See the section on “Units Tab” above for a description of the Weather Log Units portion of this
tab.
The directory used to store weather log files, and the message log is set here.
If you enable the option to count rain bucket tipping in new log files, existing log files will not
be automatically altered. If you are not interested in this, you should leave the box unchecked. Generally, after checking this box and saving options, WSDL should be exited and restarted. When the program starts, if this option is set and the current log does not contain
bucket tipping counts, a dialog will offer the option to add tip counts to the current log file.
See the section on calibration for more information about counting rain bucket tips.
Backup Tab
Automatic backups of the weather log file are provided. The options window allows separate
directories to be selected for the log and log backups. This is useful, as the backups can be on
a different disk drive for a higher level of safety.
Backups are generated at the same (user-specified) hour every “n” days -- “n” is also user
specified. The backup hour is interpreted in the display time-zone – not the log file time-zone.
However, the backup filename will include the backup time in the log's time-zone. If the
displayed time-zone is different from the log time-zone this might be a surprise at first sight.
If the 7-Zip utility is installed, the option to compress backups can be used. It is not uncommon
for the compressed backup to be less than 10% of the original size. WSDL uses registry entries
to locate the 7-Zip program. If 7-Zip is not installed or WSDL has problems compressing the log,
a backup is still created but it will be un-compressed.
There is an option to trim the size of the log file after a backup, to a user-specified size in
days. The user can also specify the interval between trim operations, and it can be different
than the backup interval. The trim operation is performed after a successful backup, if the
time since the last trim operation is at least equal to the trim interval.
Another option allows the message log to be trimmed to a size specified in MB after a
successful backup. There is no option to backup the message log.
Here you can also choose the directory used to store the weather log backups. For safety, it is
wise to store these on a different physical disk than is used for the weather log itself. That
way, if one disk goes belly-up, you'll still have something left over.
Rain Reset Configuration
The month and day from which annual rainfall totals are counted varies quite a bit around the
world. So does the hour during the day from which daily totals are counted. This behavior can
be configured here. If the daily reset hour is not local time, there is an option to enter a UTC
offset which is not altered by changes in daylight savings time.
Hardware Tab
Starting in version 2.8, users can specify the number of external temperature sensors and give
custom names to each sensor.
External Temperature Sensors
A total of up to 11 temperature sensors are supported. The zero-th sensor is always the base
station unit and the first sensor is co-located with the anemometer. This is always on channel 1
and cannot be changed. The new WMR100N has a separate external sensor and it is unknown if
that sensor’s channel is settable.
Set the number of wireless sensors in this dialog to the highest channel number in use, which
might be different from the number of wireless sensors you have. For example, if you have
sensors on channels 1,2 and 5 then choose “5” for the number of wireless sensors. The program
always assumes you have at least one wireless sensor and you cannot set the number to zero.
Each sensor can be given a custom name which will appear in the temperature readouts and
graphics. If these names are too long, some of the readout labels may overflow and look funny.
The weather log file is capable of handling a different number of sensors with each entry;
changing the number of entries does not require any special processing of the log file. Custom
sensor names are NOT stored in the log file – you must keep track of this separately.
Sensor Number for Web Uploads
Normally, the dedicated outdoor temperature sensor data is used for web data uploads. This is
pre-assigned to channel 1. If you have installed a separate wireless sensor in a custom radiation
shield, it can be used for upload data instead. Set the value here to reflect which sensor should
be used for web data uploads.
Earlier versions of the WMR100 have the temperature/humidity sensor combined with the
anemometer. This undesirable – the ideal height for the anemometer is 30 feet while the
temperature sensor should be at a height of 5 feet. The radiation shielding provided is also
perhaps not all that it should be. Users of these models may wish to use a THGR810 wireless
sensor installed in a custom radiation shield for their outdoor readings.
Newer WMR100 models (WMR100N) come with a separate shielded temperature sensor.
UV Sensor
If there is a wireless UV sensor in your system, check this box to show UV data in the main
window.
Manual Rain Input
Some users who participate in the CoCoRaHS program may not use the OS rain gauge. Instead,
they report rainfall using a standard non-automated rain gauge. Checking this option will
disable data collection from the wireless rain gauge and enable manual input of rainfall
amounts. See the section on rainfall processing elsewhere in this manual for more information.
Wireless Sensor Timeout Limit
It is not uncommon to experience flaky communications from your wireless sensors.
Occasionally, the indoor console may miss one or two transmissions from a sensor. This causes
WSDL to eventually flag the data as “aged” or “old”. This option allows the timeout limit for
wireless sensors to be adjusted anywhere from 60 seconds to 600 seconds (10 minutes). Earlier
versions of WSDL used values around 130 seconds or so. This new option will default to 150
seconds. If you frequently get sensor timeouts and cannot fix it by relocating or re-orienting
the indoor console, this value can be increased to help the situation.
It is suggested that the timeout be kept less than your internet upload interval.
Weather Station Hardware
In this group of options, the weather station console is specified along with related options.
The choices right now are for WMR88, WMR100, WMR200 and Arduino.
When the WMR88, WMR100 or WMR200 option is chosen, there is an option to allow the USB
connection to the weather station to be “shared”. For a long time, it was recommended that
this setting be un-checked. With recent fixes in WSDL, this can be checked if WSDL will be run
in parallel with other weather data collection software. If problems are experienced with the
shared option enabled, try turning if off.
When the WMR200 is selected two additional options become available. One is to make WSDL
the master. Unlike the WMR100, the WMR200 requires handshaking from the PC in order to
keep data flowing. Turning this option on instructs WSDL to send the necessary handshakes. If
other weather software will not be sharing the WMR200, then this option must be checked. If
you plan to run other software weather software at the same time as WSDL, then it may be
necessary or helpful to turn this option off.
The second WMR200-only option enables history data collection. If this is disabled, then
WMR200 history will be erased whenever the WMR200 is plugged in or when WSDL is started
(but not if the master option is disabled).
When the Arduino console is selected, an additional group of options will be available to
configure the data connection with Arduino.
After changing any of these settings, the program should be restarted.
Arduino Weather Console
This group of options is only enabled if the Arduino console is selected in the “Weather Station
Hardware” options.
When using Arduino instead of an OS weather console, it is connected to the computer via a
USB cable and will appear as a COM port in Windows. The COM port number must be entered
here and the “Enable” box checked to activate the Arduino interface.
Please read the Arduino topic in the Reference section of this manual for information on how
wireless sensors are managed with Arduino – it is a lot different! It will be difficult to
understand the auto-configuration options here without that background information.
If the “Auto-config” option is not checked, then new sensors will be added to the RF
identification table only. This means they will not automatically be included by WSDL. This
option requires more work by users when new sensors are added, but also gives more control
over sensor setup.
If “Auto-config” is checked, then new sensors found by Arduino are automatically configured
into WSDL if possible. This means that a new entry will be made in the sensor channel table,
linking each new sensor with a WSDL channel number. In some cases, a new channel number
may not be available and the sensor will not be automatically configured.
The “Detect battery changes” option is only available if the Auto-config option is enabled. If
the capability to detect battery changes is enabled, then WSDL watches for a series of events
that signal a battery change in a wireless sensor. See the chapter on Arduino for more
information on battery change detection.
If the “use any channel” option is not checked, WSDL will only configure sensors to the WSDL
channel that matches the sensor’s channel switch setting. If multiple sensors are present on
the same channel, only the first one found will be configured.
When “use any channel” is checked, new sensors will be configured to the WSDL channel
matching the sensor’s channel if possible. If that channel is already assigned, the next
available channel will be used. Detection of battery changes in wireless sensors may not work if
the “use any channel” option is enabled.
Again, please see the Reference section on Arduino for more information on sensor
management with Arduino.
Colors Tabs
There are two tabs named “Colors” – the one on the left is for changing temperature graph
colors and contains the dynamic graph color option. The one on the right allows other colors to
be changed.
With the ability to graph temperature, relative humidity and dew point for up to 11 sensors,
the temperature graph can get quite cluttered. Maximizing the readability of these graphs
requires careful choice of colors – which can also be dependent on the capabilities of the
display monitor, your eyeballs, and personal taste. For these reasons, staring in version 2.8
users can select which colors are used for the temperature graph.
There are separate color lists for temperature, dew point and RH. Up to 11 colors may be
specified in each list. Colors can either be specified by their name in the Windows operating
system, or by RGB values (with support for alpha or transparency).
The “Default Colors” button replaces all three lists with default values – overwriting any
existing data. Don’t worry if you accidentally push this button -- you can still cancel the
options dialog without losing the currently stored color options.
Graph Color Assignment Policy
Colors are assigned to sensors in a cyclical manner. Say there are four colors in the list and five
sensors. The first four sensors will get four unique colors from the list. For the fifth sensor, the
program just recycles the list starting again with the first color.
Colors will be assigned dynamically or statically at the user’s discretion. For static assignment,
the choice of color depends on the sensor’s channel number only. With dynamic assignment,
colors are assigned cyclically only to those sensors which are being graphed. An example will
help to understand the difference.
Assume there are four colors in the list and nine sensors (on channel numbers zero through
eight). Sensor numbers three and six are enabled for graphing. Now, think of the four colors as
having numbers zero through three. The first color is color number 0 and the fourth color is
color number 3.
If static color assignment is used, the color choice for sensor three is equal to “3 modulo thenumber-of-colors (4)” which is still three (this is the fourth color). The color for sensor six is “6
modulo 4” or two (the third color).
With dynamic assignment, colors are still assigned cyclically, but only those sensors being
graphed are counted. The first sensor to be graphed is sensor 3 and it will get the first color
(color number 0). The second sensor to be graphed is sensor 6 and it will get the second color
(color number 1).
Now let’s say graphing is enabled for another sensor – sensor number 0. With static color
assignment, the new sensor’s color is “0 modulo 4” or zero – the first color. The color of the
other two sensor’s graphs will not change. With dynamic color assignment things are different;
sensor 0 will now get the first color with sensors 3 and 6 receiving the 2 nd and 3rd colors
respectively.
Color Specification Formats
The set of named colors that are recognized by windows can be found in many places on the
internet. Here is one URL that worked as of February, 2009:
http://msdn.microsoft.com/en-us/library/aa358802(VS.85).aspx
If this link does not work for you, try searching Microsoft’s web site (or the whole internet) for
the string: “colors by name”.
In addition to named colors you can enter RGB or ARGB values in hexadecimal format. The
string must start with a “#” character, and be followed by exactly 6 or 8 hexadecimal
characters (letters may be upper or lower case). For RGB values the string looks like this (don’t
enter the quotes): “#RRGGBB”. As an example, pure saturated red would be “#FF0000”.
You can specify transparency (also called alpha) in the color – assuming your graphics hardware
supports this capability. In this case, precede the RGB values with two hex characters for the
alpha value like this: “#AARRGGBB”. For example, a 25% grey which is also 50% transparent
would be “#80404040”.
Station Tab
This tab contains information about your geographic location for several purposes. The tab
itself is new in release 3.1 and contains information previously found in the Upload and
Calibration tabs. Here is a summary of the different features in WSDL that require this tab’s
data to be valid:
•
CWOP uploads require latitude, longitude and elevation.
•
Proper calculation of altimeter setting (QNH) requires an accurate elevation.
•
Over-riding the WMR100’s calculation of SLP requires elevation and (if the elevation is
1000 feet or more) normal temperature.
•
HTML tag values for almanac (sun and moon) information require latitude and
longitude.
Latitude, Longitude and Elevation
Latitude and longitude can be entered in one of three commonly used formats:
•
Decimal degrees, to four decimal places (DD.dddd). For example, “109.4892”
•
Degrees and decimal minutes, to two decimal places (DD:MM.mm). For example,
“93:35.89”.
•
Degrees, minutes and (integer) seconds (DD:MM:SS). For example, “102:01:59”.
Click the radio button corresponding to whichever format is most convenient. The current
values will be automatically converted if the format is changed. For those concerned with
minutiae, there is a slight difference in resolution with these options – decimal degrees has the
highest resolution (about 36 feet in latitude) followed by decimal minutes (61 feet) and then
integer seconds (101 feet). Unless you live on the equator, the resolution in longitude will
always be better than these numbers.
Elevation can be entered in either feet or meters. The other value will be automatically
updated to reflect the entered value. For example, entering an elevation of 1000 meters will
cause the display of elevation in feet to read 3281.
Sea Level Pressure (SLP)
This group of settings is used to over-ride the WMR100’s calculation of SLP. See the section
about the barometer in the “Program Features” section of this manual for more details.
Cal(ibration) Tab
Starting with program version 2.5, two different aspects of the weather station can be
“calibrated” -- relative humidity maximum and rain bucket readings. One could argue that
“calibration” is too strong a word for this feature.
In version 2.8 there is a second option for rain gage calibration, described in the appendices.
Please download and read the appendices if you wish to use rain bucket tip counting and the
related calibration setting.
Relative Humidity Maximum
Using this calibration setting, you can specify the maximum RH reading you get when it is
raining or foggy. For example if you set this value to 98%, then a value of 98% reported by the
WMR100 will be “bumped-up” to a 100% reading.
There are separate settings for the WMR100 console (channel 0), the dedicated outdoor sensor
(channel 1). There is also one setting that is applied identically to all additional wireless
sensors (channels 2-10).
Rain Gage Scale Factor
This factor should be used if you’ve manually calibrated the rain gage, or if the sensitivity has
been altered as described in the appendices.
One of the attributes of a rain gage is the amount of rain required to make the measuring
bucket tip. While some gages might require 0.01 inch of rain to tip the bucket, the WMR100's
unit requires about 0.03 inches.
At the end of a storm, the rain gage’s bucket will be half-way to the next tipping point (on
average). If there is enough time for this water to evaporate before the next storm, then onehalf bucket’s worth of rain will not get counted (again, on average). Furthermore, small rain
events – less than one bucket – will not be counted.
The rain gage can be modified to have a higher resolution. The scale factor option is intended
to account for such modifications. All rain gage readings from the weather station are
multiplied by this number before being displayed, logged or graphed.
Although this technique reduces the amount of un-measured rain, it can increase other
measurement uncertainties. Users must judge for themselves if the increased resolution is
worth the cost in terms of increased uncertainty. See Appendix I for more information, and an
example of a modified rain gage.
Setting this value to 1.0000 effectively disables the scale factor.
Bucket Tip Amount
For reasons described in the appendix covering rain gage calibration, another method to
process rain data has been provided. This option actually counts the number of times the rain
bucket tips and therefore effectively bypasses the WMR100’s built in calibration. Please see the
appendix to learn some of the pros and cons of this option.
This calibration value specifies the amount of rain collected by one tip of the tipping bucket
rain gage. The value can be entered in inches or mm in the appropriated place. Entering a
value in inches will automatically update the value in mm, and vice-versa.
Barometer Offset
This offset (in millibars) will be added to all barometer readings except for the WeatherJack
(there is a separate calibration offset for WeatherJack in the “WeatherJack” tab).
For OS consoles, the same offset is added to both station pressure and SLP values. Adding the
same offset to SLP is not quite the proper thing to do – the correct offset for SLP is different
than for station pressure, so only one of them can be made exactly correct. However, given the
low resolution of the OS barometer (1mb), this is probably not a huge factor unless your station
is at a high elevation. This problem does not occur if the option to override the WMR100’s SLP
reading is enabled (in the “Station” tab).
With the Bosch BMP085 barometer (and when WSDL overrides the OS console SLP value), the
barometer offset is added directly to each station pressure reading. Then, QNH and SLP are
calculated using the adjusted station pressure. If your station elevation is at a high elevation,
then an offset added to station pressure will result in a different (larger) offset being added to
the SLP and QNH readings. For example if an offset of 0.10inHg is added to station pressure,
the change in QNH might be 0.11inHg (or more) at some high elevation. Because of this, it may
take two or three attempts to find the proper offset to achieve a desired QNH or SLP reading.
Misc Tab
One option here is a check-box which causes the WSDL window to be minimized to the Windows
notification area (the far-right side of the bar at the bottom of the screen) instead of to the
task bar, where minimized program windows are usually shown.
Graph layout can also be configured here. The default configuration has a single graph
displayed in the WSDL window. This can be changed to display up to sixteen graphs (four rows
and four columns). Although most users will not find this many graphs useful, this does provide
a lot of flexibility. See the description of the graph window in the Program Features section for
more information.
The time limit (or threshold) for displaying missing log data as gaps in graphs can be set here.
Choosing a value of zero will disable the gap graphing feature. If you are uploading WMR200
history data which is logged less frequently than once every five minutes, it may be desirable
to increase this setting from the default value of eleven minutes.
WeatherJack Tab
This is of interest to those who choose to add the WeatherJack barometer to their weather
station. This is mostly for advanced users, and details for these option settings are covered in
the WeatherJack appendix which can be downloaded separately from SourceForge.
The Internet Options Window
Misc Tab
Requiring Valid Data (or just temperature)
When data is uploaded, WSDL will omit certain pieces of data if the data is “aged” or “old” – in
other words, the wireless sensor providing that data has timed out. Although both WU and
CWOP allow this, some of their online graphs may look funny if it contains reports with omitted
temperature readings. This problem really belongs to WU and CWOP, but for those who are
bugged by this, there is a check box which will prevent uploads from occurring if temperature
data is stale. You can also mitigate this problem by increasing the wireless sensor timeout
interval (see the “Hardware” options tab).
Enable Fatal Errors
This option is enabled by default. When certain types of errors occur during an internet upload
(Weather Underground, PWS Weather, CWOP, FTP or AWEKAS) further uploads are disabled
until the problem is fixed. One example of a fatal error is a bad password. Turning off this
option prevents WSDL from disabling uploads when these errors occur.
Dial-up Connections
This area offers the option to have a dial-up internet connection established each time a data
upload is ready. After the data upload completes, the connection will hang-up. This can be
useful for those with dial-up connections who don’t want the phone line busy up all the time.
Getting this to work can be a bit tricky, so follow the directions below carefully!
To use this feature, you must first configure a dialup internet connection that can be
completed without user intervention. To do this, go to the Network Connections window (in the
control panel). Either create a new connection or select an existing dial-up connection. A valid
username and password must be saved as part of the connection. Right-click on the connection
and select “Properties”. Under the “Options” tab for the dialup connection properties window,
make sure the check boxes to prompt for name and phone number are un-checked. Set the
redial attempts to zero and un-check the box to re-dial if the line is dropped.
Finally, make a note of the dialup connection’s name – as shown in the Network Connections
window. Enter the connection name where indicated in the data logger options window and
then check the enable box. If the name here does not match the internet connection’s name
exactly, then uploads will fail.
If two uploads occur around the same time (e.g. WeatherUnderground and CWOP), WSDL will
attempt to share the connection between the two uploads to avoid having to dial out twice.
If the phone line is busy or in use when the dialing attempt occurs, the data upload will be
retried every so often (whatever you specified above). Attempts to upload data will continue
on schedule. So, if you’re talking on the phone for a while, no data uploads will occur until you
get off the phone – but then they will continue normally.
Some modems do a poor job of detecting the dial tone (they seem to think that a human voice
is a dial tone) – in this case you may notice the computer will try to dial your ISP while you are
talking on the phone. This is annoying as heck. There is no good fix for this problem other than
to try a different modem or to disable auto-dial while you are using the phone.
Versions of WSDL prior to 4.2.1.5 would get locked up if a user dialog was popped up by
Windows during the dialup connection attempt. Starting with version 4.2.1.5, the dialup
process is initiated by a separate utility program (DialupConnectionUtility.exe) under the
control of WSDL. If the dial-up attempt gets locked up, WSDL kills the utility program and tries
again. This should result in more reliable behavior of the auto-dial function.
Client/Server Port Assignments
When using WSDL in the client, server or service modes, the internet port numbers used for
communications are configured here. The default ports should only be changed if they are
conflicting with other internet traffic on a home network. All instances of WSDL must be
configured with the same port numbers.
To change port numbers it is recommended that WSDL be started in standalone mode and the
options dialog used to change the port numbers. Then, save options and exit. Restart WSDL in
the desired mode and it will begin using the new port numbers.
WU Tab
This is where Weather Underground, uploads can be configured.
The station ID assigned by Weather Underground, and password for your Weather Underground
account are entered here. Be sure to enter the identifier code assigned to your weather station
here – do not enter your Weather Underground login ID. The password should be the password
associated with your Weather Underground login.
For example, assume your login ID is “joe” with password “123456”. You have registered a
weather station which has been assigned a station ID of “KCABURKE999”. Enter the station ID
“KCABURKE999” in the Station ID field, and “123456” in the password field. Do not enter “joe”
for the station ID – it will not work!
If your current password is non-blank when you open the options dialog, it will be displayed as
five asterisks (*****) to prevent others from easily seeing it. The number of asterisks has no
relationship to the length of your actual password. To change your password, you must delete
all of the asterisks and enter a new password. The new password will not be obfuscated by
asterisks until you close the options dialog and open it again.
There is very little security in this program to protect your password, and it is sent out on the
Internet without encryption. If this makes you nervous then create a separate account with
Weather Underground for these uploads. And for heaven's sake, don't use the same password
here that you use for things like your bank account!
The default URL for the upload should be correct, but can be changed if necessary.
If you obtain a webcam ID from WU, then webcam images can be uploaded via FTP. To make
this happen, fill in the ID for your webcam and select the camera image file. This file must be a
JPG file and no larger than 150k bytes in size. Check the corresponding box to enable webcam
uploads. These uploads will occur through the FTP capability, so FTP uploads must be enabled.
Uploads occur on the time interval specified in the FTP tab page. The time interval selected for
WU data uploads has no affect on the timing of webcam uploads.
After entering station ID and password, try a test upload with the “Test” button. A dialog will
pop up and let you know if the test worked. This test sends simulated weather data – not the
actual data currently being reported by the weather station. If the test is successful, set the
desired upload interval and click the “Enable” check-box.
Uploads will begin as soon as you save the new settings.
PWS Tab
These settings are the same as for Weather Underground – just use the proper values for PWS
Weather instead. As of this writing, PWS weather did not support webcam uploads.
CWOP Tab
Be sure to read the section on CWOP below before trying to use this option.
Setup for the Citizen Weather Observer Program (CWOP) is similar to Weather Underground.
When you sign up for this program you will be assigned a station ID which will probably consist
of two capital letters followed by four decimal digits (something like “AB1234” for example).
Enter this identifier in the Station ID box.
The default CWOP server URL should be correct. Don’t change this unless you have trouble with
the uploads. There is a button to reset the URL to the default setting.
The Port setting (TCP port number) should also be correct. Don’t change this unless you know
what you are doing or have some instructions from the CWOP folks asking you to do this. There
is a button to reset the port back to the default value.
Part of the CWOP upload data includes the geographic coordinates of your weather station
(latitude and longitude). This must be set accurately (see the “Station” tab in the options
window). The CWOP web pages have information to help you determine these values. An
accurate elevation must be entered into this dialog as well – otherwise barometer readings
reported to CWOP will be off. Ideally the elevation should be accurate to 10 feet or better.
Since CWOP data can be sent to NOAA, you should be picky about the quality of this data. In
some cases, it may not be possible to properly site all of your weather station components. For
example if the station is located within a stand of tall trees, the wind information may not be
usable. For this reason, there are check boxes to disable reporting of various sensor readings.
If some of your sensors are not operational there are some check-boxes that can be used to
omit some of the data in the upload to CWOP. For example, some folks may take the rain
gauge indoors during the dry season and remove the batteries – disabling rain bucket data
would make sense here.
FTP Sites Tab
There are a total of five tabs associated with setting up FTP operations. It is suggested to
proceed left-to-right through the five tabs.
The table in this tab page allows one or more FTP sites to be specified. Each site requires a
user ID and password. Be sure to enter the URL withough protocol specification. For example,
enter “my.isp.com” instead of “ftp://my.isp.com”.
Security, or the SSL options
If your current password is non-blank when you open the options dialog, it will be displayed as
five asterisks (*****) to prevent others from easily seeing it. The number of asterisks has no
relationship to the length of your actual password. To change your password, you must delete
all of the asterisks and enter a new password. The new password will not be obfuscated by
asterisks until you close the options dialog and open it again.
There is very little security in this program to protect your FTP password, and it is sent out on
the Internet without encryption (unless you check the SSL box – see below). If this makes you
nervous then create a separate account for FTP uploads. And for heaven's sake, don't use the
same password here that you use for things like your bank account!
Normally, the user name and password for FTP login is sent over the internet un-encrypted.
Malicious people who monitor the internet can capture this information, and gain access to
your account on the web server.
The check box to enable SSL (which is an acronym for “Secure Sockets Layer”) on the FTP
operation will encrypt the user name and password for a higher level of security. However, this
capability has not been fully verified yet in WSDL. It would be safest to assume this is not
working until proven otherwise.
There is one more issue with the SSL option. FTP servers often supply what are called “selfsigned” encryption certificates for the secure connection. This kind of certificate can be
intercepted and forged by hackers, and you would never know the difference. This is called a
“man in the middle” attack. The result is the same; the hacker would again learn your user id
and password on the web server. On the other hand, this option is still more secure than no
encryption at all.
Now you can understand that other check box – the one about allowing unsafe SSL certificates.
If your web server supports SSL encryption for FTP, then try it without the “unsafe” option
first. If that doesn’t work then try checking the unsafe box.
Passive FTP
There are two ways in which WSDL can connect to your FTP server, “active” and “passive”. The
difference is pretty technical and you can learn more by performing an internet search for
“active versus passive FTP”. However, there is not normally any need to do this. WSDL defaults
to an active connection, but some FTP servers only support passive connections. If your FTP
uploads are not working, try enabling the passive FTP option to see if that fixes the problem.
FTP Tags Tab
This section allows you to specify one or more files for tag processing. The template file is
processed as described earlier in this manual, and the result is saved as the “Live File”.
FTP Files Tab
If there are additional files to be uploaded which do not require tag processing, specify them
here.
Graphics Tab
Copies of the WSDL graphs can be stored as PNG files and uploaded via FTP. These image files
are stored in a user-specified folder.
The size (in pixels) of PNG files generated for upload is adjustable here. FTP graphics are
generated by hidden windows – this is necessary to allow independent control of the size.
These hidden windows can suck up computer resources and if you find the computer runs
slower it is possible to disable generation of the PNG files. This will close all of the hidden
windows used for FTP graphics.
When “Coupled to Main Window” is checked, the type and number of graphics files created will
be identical to what is present on the main WSDL window. If something changes on the main
window, the next set of graphics files will reflect that.
When “Coupled” is not checked, the type and number of graphics files created is no longer
dependent on the WSDL main window. Changes to the main window setup will not be reflected
in the FTP graphics. When graphics are not coupled, there will be a new menu item in the
“Graph” menu which can be used to force FTP graphics to reflect the current WSDL main
window.
The generated image files are not uploaded unless the Upload box is checked. When checked, a
valid FTP site and target directory must be specified for the upload operation. The graph files
will have fixed names: “WxGraph-nn.png” where “nn” is a two digit decimal number between
“01” and “16”, referring to each of the graphs created.
FTP Tab
The station description entered here will be used in tag replacement operations.
If the Almanac.bin file is installed, WSDL can search for locally total solar eclipses within a
specified radius of your station's location.
FTP Pre-processing
A program of your choosing can be executed some amount of time prior to each FTP upload
operation. Specify that here.
Upload Control
Here you specify how often you want FTP uploads to occur and enable or disable the upload
capability.
Client/Server Details and Custom Plug-Ins
Data transmitted over the network by the WSDL server can be received by any computer
(Windows, Linux, or whatever) on the network. Real-time data is transmitted by the server as
UDP packets which are sent to the “broadcast” address (255.255.255.255). These packets are
specifically configured so that they will not be passed through a router to the rest of the
network. A common scenario is a home network where several computers are connected to a
single router (which may include wireless capability). This router may also be connected to a
high speed network connection such as DSL. Broadcast packets will be routed to all computers
connected directly to the router (including wireless connections), but not past the router onto
the public DSL network connection. This is by design and is intended to protect the home
network and avoids sending needless traffic over the public DSL connection.
Large home networks with multiple routers may have problems because of this configuration.
Users who experience such problems are urged to post comments on the SourceForge Open
Discussion forum. There are possible alternatives that could be explored if this turns out to be
a common problem.
Ports
Data packets transmitted over the network contain a “port number”. This is simply a number
between 1 and 65,535 which is intended to indicate the purpose or data contained in the
packet. For example, packets associated with port number 80 typically contain HTML data
associated with web pages. Port numbers from 1 to 1024 are reserved for well known and
accepted uses. Higher numbered ports are less stringently defined, and WSDL uses ports 9981
and 9982 for client/server communications. These ports are not explicitly reserved for WSDL
however, and it is conceivable than a conflict could occur with other software in the future. As
a result, WSDL allows these two port numbers to be changed, and as long as the server and
clients use the same two ports, everything should work just fine.
UDP
This stands for “User Datagram Packet”. It is a one-way message broadcast by the server onto
the network. WSDL clients actively listen for these messages on the network. There is no
feedback from the client(s) to the server to indicate that any particular message was received
correctly. It is not possible for a client to ask for a missed message to be re-transmitted. This
lack of “hand-shaking” between server and client makes this broadcast technique particularly
efficient, and on a small home network there is very little chance that a client will miss a
message, or receive a corrupted message. These messages are small enough that they can be
sent in a single “packet” which avoids further overhead associated with re-ordering and
assembling larger messages that require multiple packets for transmission.
Real time data from weather sensors is transmitted using UDP packets. One-minute log file
updates are also sent via UDP.
All UDP packets have a common format. The first byte is a “flag” byte and is either 0x00 or
0xff (hexadecimal). If non-zero, it indicates that the rest of the packet has been compressed
using the gzip algorithm, and must be un-compressed before proceeding further. Otherwise,
the rest of the packet is used as-is. If the first byte is not 0x00 or 0xff, the message is corrupt
and should be discarded.
The second byte (possibly after de-compression) is also a flag byte, either 0x00 or 0xff
hexadecimal, and indicates (when non-zero) that a 16-byte checksum has been appended to
the message. Other values indicate a corrupt message. The “checksum” is actually an MD5 hash
of the message contents (not including the flag byte), which is a more secure verification than
a simple checksum. Verification of the checksum is optional, and it is possible to simply discard
the last 16 bytes of the message. The .NET class library provided with WSDL for user
application development includes checksum verification in the ClientServerComms class.
For those who want the gory details, UDP packets may be transmitted using a true simple
checksum which does a poor job of detecting multiple bit errors and may or may not be
verified by the UDP drivers in Windows. The MD5 hash has been added to augment the low
quality of data protection that is built into the UDP protocol.
TCP
This is an acronym for “Transmission Control Protocol”. It is more reliable than UDP but
requires that a formal connection be setup between the server and client. There is more
network overhead but data from the server is guaranteed to get to the client accurately and in
the proper order. Large amounts of data can be reliably transferred using TCP. It is not possible
for the server to “broadcast” a TCP message. Each client must specifically request a TCP
connection with the server and this becomes a reliable 2-way connection.
In WSDL, when a client first starts up, it requests a short-term (30-day) log file dump from the
server so that past weather history can be displayed to the user. This data is sent via TCP.
When the connection is first established, the client sends a single character (or byte) to the
server (“L”) which requests a log file dump. The server then serializes 30-days’ worth of log
file data, compresses it using the gzip algorithm and then sends it over the TCP connection to
the client. This terminates the transaction and the TCP connection is then closed.
This same technique is also used to share option settings between client and server. When
clients start up they also get a copy of the current server option settings which are then used
during operation. Future versions of WSDL will allow clients to send altered server settings back
to the server. FTP graphics configuration data is similarly shared between client and server.
Data formats for TCP are identical to UDP except that an additional 10-byte header is added to
the message. The header contains the message length in bytes, encoded as a decimal number.
This conveniently allows the receiver to pre-allocate a buffer of the proper length to receive
the remainder of the message.
The length header is absent from UDP messages – they are always short (less than 1500 bytes),
so it is not difficult to pre-allocate a buffer that will be longer than any possible UDP message.
Server Discovery
When a client first starts, it must discover the IP address of the server. It does this by listening
for broadcast packets on the configured UDP port. Once a packet is received, it is assumed the
server’s address is the same as the sender of the broadcast packet (UDP packets come with
“caller ID” for free).
Next, the client will create a couple of TCP connections to the server – to obtain a copy of the
server’s option settings and to get a dump of the current log file. These connections are then
closed and the client just listens for broadcast packets.
Custom Plug-Ins
When WSDL is run in client/server mode, the client is a specially configured WSDL program that
listens for packets transmitted by the WSDL program which is running as a server. However,
any computer program can receive data packets from the WSDL server and these programs are
called “Plug-Ins”.
The simplest kind of plug in is a program which listens for UDP broadcast packets from the
WSDL server. These packets contain real-time weather data such as wind, temperature and so
on. Typically, the plug in will only be interested in a subset of real-time data (for example
temperature readings from the wireless sensor on channel #3). The plug in will sort through the
data packets, discarding all but the ones it is interested in. The plug-in can perform whatever
processing of this data is desired and take whatever actions the plug-in’s author desires based
on this data.
Plug-In Example
Example source code for a custom plug-in is installed with WSDL. Look in the installation
directory for zip file containing the example. Unpack this archive in a local directory and a
folder named “WSDL-Custom-Client-Demo” will be created. This is a complete Visual Studio C#
project that implements the X10 fan controls described above. Unpack this archive in one of
your own folders, and use it for experimenting.
There is a Visual Studio solution file in the directory along with two sub-directories – “WSDLClient” and “WSDL-PlugIn-Demo”. The first directory contains the library code that any client
can use to interface with WSDL. You should not need to modify any of the files in this
directory. It has been tested and works with a CM15A X10 interface module connected to the
computer’s USB port.
The “WSDL-PlugIn-Demo” directory contains the X10 fan control example. The X10 drivers must
be installed on your computer in order to build and run the example. The drivers can be found
here, or search the internet for “ActiveHome Pro SDK” or “ahsdk_install.exe”.
http://www.x10.com/activehomepro/sdk/index.html
The drawing below shows a hypothetical house floor plan with fans, temperature sensors and
computer equipment. (Yikes, for some reason, this house does not have a kitchen!) Colored
arrows indicate airflow, green represents cool air, and then yellow, orange and red indicate
progressively warmer air. The example program is based upon this scenario.
Wireless sensors are placed outdoors, in the living room and office. Controlled by X10 switches,
there are fans placed in the window of bedroom 2 and in the living room. Also, there is a small
room air conditioner in the office controlled by a third X10 switch.
On a hot day the outside temperature will be higher than any of the inside temperatures, and
the inside temperatures will rise during the day. For example, assume that during the day it
reaches 100 ºF outside and the inside has warmed to 85 ºF. During this time, it is desirable to
operate the room A/C inside the office but the other fans should be off.
After sunset, the outdoor temperature starts dropping and eventually cools below the inside
temperature. At this point, the fan in bedroom 2 can be turned on to pull the cooler outside air
in through open windows in the living room and bedroom 1. In order for this to work well, the
outside temperature will need to be somewhat cooler than the temperature in the living room –
say at least 2 ºF cooler for example. This will be called the “threshold” value.
Additionally, a second “mixing” fan is located in the living room to help mix the incoming cool
air with warm air in the living room before it is exhausted down the hallway and out through
bedroom 2.
The office may have been cooled to say 75 ºF during the day, so the A/C should still be
operating until the outside temperature is below the office temperature by at least the
threshold amount. Once the outside temperature drops below this level, the office A/C can be
turned off and the window opened to allow cool air to be drawn into the office.
When making decisions to turn the fans and A/C on or off, the actual temperature is compared
to the desired temperature. It is not sufficient however to make the “on/off” decision based
only on this information. To see why, imagine the desired temperature is 65 ºF and the living
room temperature has just dropped to 64.9 ºF, so the fans have been turned off. What happens
next is an almost immediate rise in the living room temperature reading because the cool air
has stopped flowing in through the windows, and the walls and furniture are still warmer than
65 ºF. Using this simple decision logic, the fans would be turned on again within a very short
period of time. The living room sensor reading would then quickly cool below the set point
again and the fans are turned off. The result is rapid on-off cycling of the fans which is
annoying and inefficient.
What is needed is a little “hysteresis”. This just means that after turning the fans off (e.g. at
64.9 ºF), the temperature should be allowed to rise a bit (e.g. to 66 or 67 ºF) before turning
the fans on again. In this example, the “hysteresis” amount is 1 or 2 ºF -- the difference
between the off temperature of 65 ºF and the on temperature of 66 or 67 ºF. The fans will still
cycle off and on but the time between cycles will be much longer and not so objectionable.
Another trick that will help the cycling problem is to shield the sensor somewhat so it is not
directly in the path of cool incoming air. Laying the sensor flat on a surface such as a table will
also slow down the rate at which it senses temperature changes, and this can reduce the
on/off cycling. This trick can also be overdone – for example, putting a large towel on top of
the sensor. In this case, the sensor will take too long to respond to temperature changes and
the house will become over-cooled before the fans are turned off. As with most things, a little
experimentation is helpful to find the right balance.
Another little bonus in the example demonstrates how to intercept messages from an X10
motion sensor – see the X10Switch.cs file. This example assumes the motion sensor is setup to
activate a switch on house/unit code “A1”. There does not need to actually be an X10 switch
on “A1” – the example works either way.
Outdoor
Temp
Sensor
X10
Switch
Living Room
Mixing Fan
Indoor
Temp
Sensor
A/C
Temp
Sensor
Room A/C
Office
X10
Switch
X10
Controller Computer WMR100
Bedroom 1
Bedroom 2
X10
Switch
Window Fan
Figure 1. Scenario used in custom client example
What are Dew Point and RH, Anyway?
As part of the 4.3.1.0 release of WSDL, the author was forced to confront this question. One of
our more astute users discovered a slight error in WSDL's computation of dew point when
temperatures were below freezing. This lead to a big research effort that culminated in a few
changes to WSDL, and this addition to the user manual.
You will need to have a bit of background to understand the information presented in this
section. A layman's introduction to the topic can be found in the Wikipedia entries for
“Relative Humidity” and “Dew Point”. Once you have digested that, try moving on to a white
paper published by Sensirion entitled “Introduction to Humidity, Basic Principles on Physics of
Water Vapor”.
For those interested in further reading, a very good article on this topic was written by Bob
Hardy of RH Systems company and entitled “Determination of Relative Humidity in Subzero
Temperatures”.
The author has discovered that when things get cold, terms like “relative humidity” and “dew
point” can be a little ambiguous.
RH and Dew Point Ambiguities
When both ambient temperature and computed dew point are above freezing, there is no
ambiguity. Everything is computed relative to the saturation vapor pressure of water vapor
over water. Easy as pie. No brainer.
When the air temperature falls below freezing, things can get a bit ambiguous. What it boils
(pun intended) down to is: do you want to talk about the saturation vapor pressure of water
vapor over ice, or over liquid water?
Before talking more about what is ambiguous, let's be clear about what is not ambiguous: the
partial pressure of water vapor in the air being measured. If someone tells you that number,
there is no ambiguity, and there is no question about how moist the air is. Unfortunately, this
particular way of talking about humidity (partial pressure) is not all that meaningful for
everyday purposes; therefore it is seldom used. Rats.
So, is the measurement of humidity be made more meaningful in everyday life? The first of two
approaches is to compare the partial pressure of water vapor in the air to the partial pressure
of water vapor required to saturate air at the current temperature. When expressed as a
percentage, this is the definition of relative humidity. For example, say the current partial
pressure of water vapor is 50mb. If increasing the partial pressure of water vapor to 100mb at
the current temperature would saturate the air, then the relative humidity is 50%. Pretty
simple, right? Well, sort of.
Things get a little ambiguous when the air temperature drops below freezing. Let's say the
temperature is -10C (14F); what happens if we start increasing the partial pressure of water
vapor to find the saturation point? The answer is ambiguous; one of two things will occur:
1. Frequently, as more water vapor is added to the air, frost will form at some point. Ice.
This will occur at a particular partial pressure, call it e si. For example, let's say this
occurs at a partial pressure of 2.5mb in our situation.
2. If conditions are “just right”, we'll be able to increase the vapor pressure of water
higher than esi without the appearance of frost. Partial pressure can be increased
further to a point where super-cooled, liquid water droplets will appear. We will call
this esw. For this example, we'll say this occurs at a partial pressure of 2.9mb.
If the actual partial pressure of water vapor is 2.0mb, then what is the relative humidity in this
example? RH is defined as the ratio between the actual partial pressure of water vapor to the
saturation pressure. Should we compare the current partial pressure (2.0mb) to the saturation
pressure over water (2.9mb) or over ice (2.5mb)? The answer we get for RH is either 69% or
80%, respectively. Which is the right answer? Depending on the context, either answer can be
correct. Now you see the ambiguity.
In dealing with this ambiguity, it may help to reflect on what really matters. If your goal is to
understand when a particular physical process will occur (e.g. frost or super-cooled dew
formation), then your choice between the two options is clear. If you are a manufacturer of
relative humidity sensors...what should you do? Your customers may have different needs so
how do you determine RH?
Hopefully this example has done a good job of illustrating the ambiguities involved in
measuring relative humidity. Before discussing the solution to our quandary, let's briefly
consider dew point and frost point.
Dew Point vs Frost Point
With relative humidity, the question asked was: how much must we increase the partial
pressure of water vapor before dew (or frost) forms? When discussing dew point and frost
point, question is subtly different, and goes something like this:
If we take a parcel of air, and cool it (without changing it's pressure), at what temperature
would dew (or frost) begin to form? That temperature will be the dew (or frost) point. If the
amount of moisture in the air parcel is low enough that dew forms below freezing, it is also
possible that frost will form before dew. Once again, ambiguity; less so in this case because
there are two different terms involved, namely “dew point” and “frost point”. Unfortunately,
sometimes people refer to “dew point” when they really mean “frost point”. Again, this occurs
less frequently and most of the time, when someone says “dew point”, they do not mean “frost
point”.
The Two Ambiguities
With RH, the ambiguity threshold occurs when ambient temperatures drop below zero. With
dew point, the ambiguity begins not when ambient temperature drops below zero, but when
dew point drops below zero. Said another way:
1. When temperatures and dew point are above freezing, there is no ambiguity in RH
values.
2. Ambiguity can creep in even when temperatures are above freezing – it is only required
that the dew point be below freezing for ambiguity to exist. For example, if the
temperature is +20C (68F) and very dry with a true dew point of -5C (23F), there can
still be ambiguity in a stated value of “dew point”. This is because sometimes, an
actual “frost point” is called “dew point”.
Resolving the Ambiguity
In the real world, there are two commonly accepted methods for resolving these ambiguities.
One method is called “Standard” and the other is called “WMO” (World Meteorological
Organization).
•
WMO convention always computes dew point, assuming that super-cooled liquid water
will always form, never frost.
•
Standard convention assumes that frost will always form at below-freezing
temperatures. It is possible with this convention to see valid RH values above 100% in
cases where super-cooled liquid water is forming instead of frost.
This leads us, finally, to some kind of resolution to our quandary. The first thing is: what do
manufacturers of humidity sensors (like Oregon Scientific) do? The answer is that they
generally use the WMO convention – in part because the general public would not know what to
make of RH values higher than 100%. There are exceptions, but the majority of manufacturers
use the WMO convention.
More specifically, what happens with Oregon Scientific humidity sensors and WSDL? The actual
humidity measurements made by OS wireless sensors is RH, not “dew point”. Although OS base
consoles compute dew point from the wireless sensors' temperature and RH, it is the value of
RH that is measured and reported by the sensor, not “dew point”. WSDL saves the reported
temperature and RH values in the weather log without modification (with calibration offsets).
It is important to re-iterate here that the crucial information stored in the weather log file is
temperature and RH – not dew point.
In addition to this, WSDL computes “dew point” based on reported temperature and RH values.
This number is also stored in the weather log file. In this sense, “dew point” is a value derived
from the reported values of temperature and RH – and therefore not at the same level of
importance as the actual reported values.
In the preceding paragraph, “dew point” values computed by WSDL are in quotes for a reason.
In fact, WSDL uses the Standard convention here and actually computes a frost point when
ambient temperatures (i.e. dry bulb) are below freezing.
Arduino
As far as WSDL is concerned, the term “Arduino” refers to a combination of the Arduino
Duemilanove processor (http://www.arduino.cc) and a custom plug-in “shield” board that
contains an RF receiver, barometer and temperature/humidity sensor. This forms the basis for
a replacement of the WMR100 base console. It is not a complete replacement because Arduino
does not include the atomic clock or weather forecast icons included in the WMR100 console.
Combined with an external antenna, the Arduino receiver is more sensitive than the WMR100
and will give better reception of wireless sensors in many cases. The included barometer and
temperature/humidity sensors are also more accurate and/or sensitive than those in the
WMR100 console.
The Arduino Duemilanove Uno processor can be purchased inexpensively from many sources.
For now, the shield board must be built by hand or custom ordered. A document showing how
to build a weather shield board is available for download on SourceForge. The parts are
relatively inexpensive and this is a good option for those with some electronics experience. All
the design work has been done, you just need to buy the parts and do some soldering.
A project is also underway to design a weather shield board that can be custom ordered from
any number of electronics prototype assembly houses. The CAD (computer-aided design) files
will be available for download – send these files to an assembly house and they will obtain the
parts, make the PC board and assemble it all for you. This is a bit more expensive, but the
costs are much more reasonable if you can get a group of friends together and place a larger
order.
Another effort is underway to have this custom shield board manufactured for retail sale by a
commercial vendor. If this effort succeeds, both the processor and shield boards will be
available for purchase already assembled. You would only need to plug the two boards together
and connect an external antenna.
Capabilities
Arduino can receive data from many different OS wireless sensors. These sensors transmit data
using various radio-frequency (RF) message formats (or protocols). These message formats are
identified by OS as version 2.1 and version 3.0. The Arduino receiver can receive both types of
RF message formats and can properly identify many different models of sensors. If you have a
sensor that is not recognized by Arduino, it may be possible to add it – please post a message
on the Open Discussion forum on SourceForge.
Another advantage with Arduino is that many wireless sensors that use the version 2.1 RF
protocol are only supported by a small number of very specific console units. For example,
according to the OS sensor compatibility chart, the UVR128 UV sensor is supported by the
following console units: BAR321HGA, BAR908HGA, BAR933HGA, BAR988HGA and BAR998HGA.
With Arduino, the UVR128 sensor can be used at the same time with many other sensors
including those that transmit version 3.0 RF protocol messages.
With the Arduino/WxShield reciever, it is now possible to have more then 10 wireless sensors.
WSDL release 4.2.8.7 and later support up to 21 wireless sensors.
There are two features of the WMR100 console that Arduino does not replace – the atomic
clock and the reporting of weather forecast icons. When switching from the WMR100 to
Arduino, these features are lost. Perhaps an enterprising WSDL user can provide an algorithm
for computing the forecast icons, but there are no plans to replace the atomic clock. With the
availability of accurate time via the internet this is not currently seen as a major issue.
Paying the Price
All of this extra capability is not free – it comes at the cost of added complexity. The WMR100
console automatically takes care of the details involved with handling sensors and channel
numbers. In order for Arduino to provide support for different RF protocols and multiple
sensors on the same channel number, the user must undertake some of the tasks of sorting out
which sensor is which.
WSDL does provide some choices which allow a tradeoff between complexity and flexibility.
There are two relevant option settings – one which will auto-configure any new sensor
discovered by Arduino and another option which will automatically configure sensors with
channel number conflicts. By default, the auto-configuration option is turned on but sensors
with channel number conflicts are not configured.
If you only have one sensor on each channel and there are no nearby neighbors whose sensors
are being received, the default setup should work well. If you are receiving signals from a
neighbor’s sensors or if you have more than one sensor assigned to a channel, read on to learn
more about sensor identification.
Channel Numbers
Some OS sensors can be set to one of ten different “channels” which allows the use of up to
ten sensors at one time. Other sensors have only three different channel settings, and some do
not have a channel switch at all. Sensors transmit their messages at a regular interval (for
example, once every 42 seconds). This interval changes when the channel setting is changed.
The change in timing makes it less likely than any two sensors will transmit at the same time
and interfere with each other.
When two sensors are set to the same channel, there is still (usually) a very slight difference in
the message intervals. For example one sensor may transmit every 42.04 seconds while the
other one might transmit every 42.12 seconds. As a result, these two sensors will slowly drift in
and out of sync, and for some period of time will interfere with each other. Still, most of the
time sensors will not interfere with each other. When in sync, updates from one or both sensors
may not be received and this can last for several minutes in the worst case.
One characteristic of sensor RF (radio frequency) messages is that they don’t really just have
one, three or ten channel settings. There are in reality as many as 2,560 channels (or even
more than that, depending on how you care to count channels). There are twenty eight bits of
information in each RF message that contain identifying information about each sensor. Below,
numbers in hexadecimal format will be preceded by the characters “0x” for clarity.
•
A two byte (16-bit) sensor ID code. For example, hexadecimal 0x1d20 identifies a
THGR122NX sensor.
•
A one byte (8-bit) random code. This code changes whenever the batteries are
changed, or when the sensor’s reset switch is activated.
•
A 4-bit channel number. This value indicates the channel number selected by the user,
and can typically take on either three or ten different values for sensors with channel
switches. If there is no channel switch, this value is fixed and does not change. Some
sensors with only three channels will actually use channel numbers 1, 2 and 4 – not 1, 2
and 3 as is shown on the sensor’s channel switch.
The “golden nugget” in all of this is the 8-bit random code, which we will refer to as a “rolling
code”. Because this can be caused to change by resetting the sensor (or temporarily removing
the batteries) it can be considered to be user-settable. It is not practical to set it to a specific
value however, unless you are willing to keep hitting the reset switch until you get the desired
code – this would take 256 attempts on average!
If two sensors of the same type are both set to the same channel number, but have different
random codes, it is still possible to tell them apart from one another. OS weather receivers do
not support this capability, but Arduino does.
In summary, two or more sensors can share the same channel, and as long as the sensors are
not “talking over” each other their data can be properly identified and decoded. Occasionally,
two sensors will wind up with the same random code, and one of them must be reset to remedy
the situation.
There is in reality a limit to the number of sensors that can be placed on a single channel
setting. Sensors transmit their data roughly once per minute and the transmissions last a
sizable fraction of a second (for RF protocol version 2.1 – version 3.0 transmissions are shorter).
If enough sensors are placed on the same channel, they will begin to interfere with each other
frequently enough that it becomes unusable. The author does not know what the exact limit is,
but two sensors on a single channel work pretty well in practice.
When two sensors are on the same channel, their transmissions occur at roughly the same
interval but in practice these intervals are very slightly different. It is not known if this is due
to small differences in the sensors’ internal clock frequencies or if it is intentional as a
function of different random codes. In either case, two such sensors will occasionally get in
sync and interfere with each other for several minutes at a time. This behavior is created by
the sensor design and cannot be mitigated by WSDL.
Sensor Management with Arduino and WSDL
Although this new capability adds a lot of flexibility to WSDL, it comes at the cost of added
complexity. A simple database containing three tables is used to manage this complexity.
There are three tables (associations) in WSDL’s sensor database.
•
The sensor identification table contains a list of known sensor ID codes (the 16-bit ID
code transmitted by each sensor). Entries in this table indicate the type of data
reported by the sensor (e.g. wind, rain, etc) and known model numbers which use this
ID code. This is built into WSDL and cannot be easily viewed or changed by the user.
•
An RF identification table keeps track of the different sensors which have been
detected and assigns a serial number to each unique sensor. Each sensor is identified
by the combination of its 16-bit RF ID code, the 4-bit channel number and the 8-bit
random code. When a sensor is reset (or has its batteries changed) the random code
changes and the sensor then appears to be a different unique sensor. More on this
later.
•
A sensor channel table is used to associate each sensor in the RF ID table with a WSDL
channel number (at least, for temperature/humidity sensors). Each entry in this table
is contains a unique sensor serial number which must match a serial number in the RF
identification table. For each sensor, there is a model number, battery change date,
WSDL channel number, sensor name and comments. This is discussed in detail below.
For the purposes of the following discussion, there are three categories of sensors:
temperature, UV and “all others”. Temperature sensors (which may include humidity) have
channel numbers and WSDL can handle up to ten different sensors at any one time. In theory,
there is no reason WSDL could not handle more than ten sensors and this could be done if there
is enough user interest.
UV and other sensors are not channelized, but WSDL can still keep track of different sensors via
their random code values. In the case of UV sensors, WSDL can support any number of these
and will always use the highest reading from all such sensors. Specific UV sensors can be
disabled by setting their channel number to -1 in the sensor channel table.
For other sensors (wind, rain, barometer), WSDL can only handle one at a time. When multiple
sensors are present, only one can be enabled with a zero or positive channel number in the
sensor channel table.
Sensor Management Scenarios
In the simplest configuration, WSDL manages the sensor tables for the user, and this provides
little more capability than the original WMR100 console. Temperature sensors are
automatically assigned to the WSDL channel matching their RF channel number. If multiple
sensors are present on the same channel, the first one received is assigned to the proper
channel number while any duplicates are disabled. The same approach is used for UV and other
sensors – only the first sensor received is used by WSDL. This configuration is the default and is
selected in the options dialog by enabling the “Auto-config new sensors” option and disabling
the “Auto-config uses any available channel” option.
An additional level of flexibility is achieved by enabling the “Use any available channel”
option. Two changes in behavior occur with this enabled. For temperature sensors, a new
sensor will be assigned to the WSDL channel number matching its RF channel number – if that
channel is not already in use. Otherwise, the next lowest available WSDL channel number will
be chosen. When channel conflicts are present, which sensor gets assigned to which channel is
a matter of chance and the results may not be the same every time. If more than one UV
sensor is detected, they are all enabled and WSDL will record the peak reading amongst all UV
sensors. Other sensors are treated the same as before – only the first one detected will be
enabled.
Both of the above scenarios may need user intervention if undesired sensors are present. For
example, perhaps your neighbor also has OS wireless sensors and you are receiving them too.
Under the WSDL “Tools” menu, the “Arduino Sensor Manager” will allows the user to modify
sensor configurations when the automatic choices do not achieve the desired result.
The most flexible scenario is selected by disabling the “Auto-config new sensors” option. In this
case, new sensors are automatically added to the RF identification table but the sensor channel
table is not modified at all. Here, there user must manually configure each sensor that is to be
used by WSDL.
The Arduino Sensor Manager
Found under the Tools menu, this displays two tables to manage the configuration of wireless
sensors. The first table is entitled “RF Codes” and contains a list of all sensors that have been
received by Arduino. New sensors are always automatically added to this table but are not fully
configured when the serial number is set to -1. Serial numbers can be changed in this table and
sensors can be deleted. New sensors received by Arduino are always added to this table, so
deleting an active sensor will only be temporary – it will come back the next time it is heard
from.
When the transmissions from two sensors overlap in just the right way (an infrequent
occurrence), a garbled, phantom sensor ID may be decoded – a combination of sensor ID code,
channel and rolling code that does not really exist. To prevent these phantom sensors from
appearing in the RF Codes table, WSDL must receive two transmissions from a new sensor
within a short time span (e.g. three minutes) before it is added to the table. Therefore, when
turning on new sensors or changing batteries, you may need to wait a couple of minutes before
the new sensor will appear.
The second table, “Sensor Information” contains data for each unique sensor by serial number.
This includes sensor name, model number, battery change date, WSDL channel assignment and
comments. All fields are editable and entries can be added and deleted.
Sensor Manager Buttons
This section describes the various buttons found in the sensor manager window.
•
Refresh Rf Codes: Re-loads the RF Codes table from the current list of observed sensor
codes. This operation will over-write any un-saved changes you have made to the RF
Codes table.
•
Delete Selected RF Codes: Removes one or more rows from the RF Codes table. Use
mouse clicks or click-and-drag to select one or more rows for deletion.
•
Reload Saved Sensors: Re-loads the Sensor Information table from stored options
memory. Any unsaved changes to the table will be lost.
•
Delete Selected Sensors: Removes one or more rows from the Sensor Information
table. Use mouse clicks or click-and-drag to select one or more rows for deletion.
•
Import/Export: Saves or loads both tables in the sensor manager window
simultaneously. Data is stored in, and retrieved from XML text files. This is useful to
backup sensor information and to move sensor information from one computer to
another. The XML files can be edited with a text editor if you understand XML and are
careful to preserve the formatting.
•
Validate Changes: Checks for any invalid information in the tables that would prevent
them from being saved. A dialog will pop up if there are any problems.
•
Save: Validates any changes and then saves both tables to options memory.
•
Close: Closes the Sensor Manager window. Any un-saved changes will be lost.
Battery Replacement
When sensor batteries are replaced, the sensor will switch to a new random code and will
appear to be a new sensor to WSDL. There are a couple of different ways to deal with this
change.
The easiest way to deal with battery replacement is to enable both sensor auto-config and
battery change detection in the options window. Then, if a particular sensor goes missing and a
new sensor shows up with the same RF ID code and channel number, but has a different rolling
code, WSDL assumes the new sensor is actually the old one with new batteries. This sequence
of events also occurs if you press the “Reset” button on a wireless sensor – WSDL will assume
you have changed the batteries in this case. It can take as long as 7-8 minutes for WSDL to
recognize a battery change so be patient.
If you have multiple sensors set to the same RF channel, do not change batteries in both
sensors at the same time. WSDL will get confused and may swap the sensors when it detects a
battery change. In this case, you must change the batteries in one sensor and wait for the
battery change to be detected before changing batteries in the other sensor.
If all of your sensors are set to unique channel numbers, WSDL will not get confused if you
change more than one set of batteries at the same time.
A second way to handle battery replacement is available if you do not use overlapping channel
settings. Assuming that sensors are being auto-configured, selecting “Clear All Arduino Sensors”
in the WSDL Tools menu will erase all sensor configuration data and begin reconfiguring sensors
from scratch. This technique will not work if you have two or more sensors sharing the same
channel number. The downside to this technique is that battery change dates will all be reset
to the current date.
The third way to manage battery changes is completely manual. If the auto-configure option
for new sensors is disabled, the sensor with new batteries will result in a new entry in the RF ID
table and nothing else. After it appears here, the user can then use the Arduino Sensor
Manager to delete the RF ID entry for the old random code value. Then assign the correct serial
number to the new random code. The battery change date must be manually updated in this
case.
Which Sensor is Which?
If multiple sensors are configured on the same channel number, it can be confusing to
determine which sensor has which random code. Here are some tips for keeping track of
sensors.
•
Use a marking pen to write a serial number somewhere on each sensor. Or put a piece
of tape on the sensor and write a number on the tape.
•
Write the channel number setting on the outside of the sensor also.
•
When first setting things up, don’t power up two sensors on the same channel at the
same time. Power the first one up, and then make a note of the random code before
installing batteries in the next sensor.
•
If all sensors are on different channels, enable the auto-configuration option. When
replacing batteries, use the Clear All Arduino Sensors tool menu item after changing
batteries.
•
If sensors share channels, disable the auto-configuration option completely, or at least
do so after all sensors are configured as desired. After replacing batteries, check the
sensor manager tool. There should be one new sensor in the RF codes table that
corresponds to the unit with new batteries. Change its serial number to the proper
value and delete the previous entry with the same serial number.
A future version of WSDL will add the capability to detect “battery change” events and
automatically update the sensor management tables. In addition, several additional
enhancements are planned for sensor management that should make this task easier.
Supported Sensors
Here’s a list of the sensors currently supported by the Arduino Weather Shield. The list may not
be complete or fully accurate. If you have a version 2.1 or 3.0 sensor which does not work,
please post a note on the SourceForge Help or Open Discussion forum.
Here is a list of sensors that are confirmed to work with the Weather Shield:
THGR122NX, THGN123N, THGR810, THGR810A, PCR800, WGR800, BTHR968, THC128.
The following sensors can probably be decoded by the Arduino Weather Shield. This is not a
guarantee. If you purchase any of these sensors and the Arduino Weather Shield cannot decode
their transmission, WSDL and its authors cannot be held liable for any related damages. This is
part of the software license terms you agreed to when installing the program.
UVN800, UVR128, THWR288A, THGR288N, THGR918, THGR918N, WGR918, RGR918, BTHR918,
RGR968, THWR800, THC138, THR128/138, THN128/138, THGN500.
Advanced Checksums (CRC)
Oregon Scientific sensors using protocol versions 2.1 and 3.0 include two types of validity
checks in the RF messages. The first validity check is a simple arithmetic sum of the message
digits. In other words, the sensor computes a total from all the digits it will be sending, then
appends this total to the message. This allows the recipient to verify that the message has not
been corrupted during transmission. This is a very simple type of validity check and the
WxShield firmware requires this “check sum” to be correct before it passes the message out
over the USB cable.
The check sum described above is simple and does not provide a high level of assurance that
the message was not garbled. Most errors in reception will be caught by this check sum, but a
few bad apples will still get through. If a more bullet-proof validity check is desired, OS also
includes something called a “cyclic redundancy check” or “CRC” with the message. The mathinclined reader can learn more about the CRC algorithm on Wikipedia or by searching the
internet.
OS sensors generate the CRC number through a fairly complex calculation and append it to the
RF message. The WxShield firmware can optionally be configured to pass the CRC check
number over the USB cable to WSDL. WSDL versions starting with 4.3.1.0 will recognize the fact
that CRC values are included in USB messages from Arduino and verify their validity. Messages
without valid CRC codes will be rejected.
There is one detail about the CRC codes used by OS sensors that users should be aware of.
Calculation of the CRC value starts by choosing an initial value; this initial value is then
manipulated into the final CRC value. OS version 3.0 sensors always use the same initial value –
zero. OS version 2.1 sensors do not use a consistent initial value. In fact, the initial value is
sometimes not even the same among sensors of the same model. As a result, when WSDL is first
started, it must spend a few minutes observing sensor CRC values in order to figure out what
initial value is being used by each sensor. If WSDL sees the same initial value used at least
eight time by any given sensor, it will remember that initial value until WSDL is shut down.
Prior to determination of the initial value, WSDL accepts all messages from the sensor as long
as the simple checksum is valid. After the initial value is determined, WSDL will reject
messages from that sensor which do not contain a valid CRC code.
The use of CRC codes by WSDL is governed only by their appearance in Arduino USB messages.
CRC checks can only be disabled by re-loading the Arduino firmware with the CRC output
option disabled. This is controlled by the ENABLE_CRC_OUTPUT statement in the
WsdlWxShield.ino file – set it to “0” to disable CRC codes or to “1” to enable CRC codes.
Generic Message Protocol
WSDL also accepts a set of generic RF message reports from the Arduino processor. These are
intended to allow interfacing of user-created sensors with WSDL. This section describes the
generic message format.
Overall Generic Message Layout
Generic messages contain either six or seven pieces of information, all strung together:
<Header><SensorType><Channel><RandomCode><Status><SensorData><Checksum>
•
Header is always the string “GEN:” in upper case letters
•
SensorType is a single letter, chosen from the table below. Case is important as the
table contains both upper and lower case letters.
•
Channel is a single hexadecimal digit, 0..9, A..F.
•
Random code is two hexadecimal digits. Think of this as an extension to the channel
number if you like – in other words the effective channel number is really 12-bits. This
allows for 4,096 different channel settings.
•
Status is a single hexadecimal digit, where individual bits are used to encode sensor
status information. Currently only the LSB is recognized as a low battery indication
(when it is a one).
•
Sensor data is specific to each sensor and described in detail below.
•
Checksum is a 16-bit unsigned sum of all characters in the message preceding the
checksum. The checksum uses the ASCII character set when performing the summation.
This field is optional and may be omitted if desired. If Arduino sends the “OPT:CRC”
message at startup, then WSDL will require this field to be present; it will be
interpreted as a CRC-16-CCITT (using the polynomial x16+x12+x5+x0, aka 0x1021).
Here is a sample generic message:
GEN:T2F31+034100240042D
In this example we have the following fields:
•
Header: “GEN:”
•
Sensor Type: “T”
•
Channel: “2”
•
Random code: “F3”
•
Status: “1”
•
Sensor Data: “+034100240”
•
Checksum: “042D”
Sensor-Specific Content
The following table describes the different sensor-type letters recognized by WSDL and the
sensor-specific content for each type.
Sensor
Type
Letter
Data Type
Format
WSDL
ID
Notes
t
Temperature only
SDDDFF
FFF1
In degrees Celsius. “+2365” is +23.56C
h
Humidity only
DDF
FFF2
In percent. “713” is 71.3%
T
Temperature and
humidity
SDDDFF DDDF
FFF3
See “t”, “h” above. “-0944453” is -9.44C / 45.3%
R
Rain
DDDFF DDDDDFF
DDDDFF DDDDFF
FFF5
In mm and mm/hour. The four fields are rain
rate, total rain, rain today, rain last hour.
“012340112298000345000123” is 12.34 mm/hour,
1122.98mm total, 3.45mm today, 1.23mm this
hour.
W
Wind
DDF DDDF DDF DDDF
FFF4
In meters/second and degrees. Fields are
average speed and direction, then gust speed
and direction.
“12327453211999” is 12.3 m/s at 274.5 degrees
average, 32.1 m/s at 199.9 degrees peak gust.
B
Barometer
DDDDFFF DDDDFFF
DDDDFFF
FFF6
Pressure in mb for QFE, QNH and SLP.
“098765410132501015123” is 987.654mb QFE,
1013.250mb QNH, 1015.123mb SLP.
U
UV
DDF
FFF7
UV index on the standard UV scale. “083” is a UV
index of 8.3.
Notes on Sensor-Specific Messages
WSDL only uses the QFE barometer value, so the other two (QNH and SLP) may be coded as
zeros if desired.
In general, there are more decimal places allotted than most sensors transmit, and you may
need to stuff some trailing zeros to meet the formatting requirements.
If your sensor does not use a random code, then just use anything, like “00” for example.
Checksums and CRCs
A simple 16-bit arithmetic checksum can be included as four hexadecimal characters at the end
of each generic message. These are not required, but if included WSDL will check them for
validity. The current version of WSDL (4.3.0.8 and prior) will simply note bad checksums in the
message log, but future versions will reject them.
Starting with version 4.3.0.8, the option to use a 16-bit CRC here is available. To enable the
option, Arduino must output the string “OPT:CRC” when it starts up. WSDL should recognize
this in the message log. When this CRC option is enabled, WSDL requires the CRC to be present
– it is no longer optional.
The CRC is the 16-bit CCITT version that uses the polynomial x16+x12+x5+x0, which is 0x1021 in
hexadecimal. The initial value for this CRC is 0xffff hexadecimal. The CRC is computed by
feeding all of the ASCII characters of the message (starting with “GEN:”) through the
algorithm, MSB first. The 16-bit result is then converted to a 4-character hexadecimal string
and appended to the message.
For those using a table-driven CRC implementation in Arduino, be careful of one common
mistake that is made. The initial value (0xffff) must be run through the table twice before
being used in the algorithm. This results in the value 0x1d0f being present in the CRC register
just prior to processing the message. Thus, some folks often talk about the initial value being
0x1d0f – this is in some sense correct – but the real initial value is still 0xffff.
To test your CRC implementation, here are two test strings:
“123456789” has a CRC-16 of 0xe5cc
“GEN:U1AB1097” has a CRC-16 of 0x9fe2
If both of these tests produce the results listed above, your CRC-16 implementation is most
likely okay.
Finally, WSDL expects the four ASCII characters representing the CRC to be sent with the least
significant nibble first. Using the generic UV index message example above, the correct full
message including CRC is:
“GEN:U1AB10972EF9”
Building the Software
This software must be built using Visual Studio .NET version 2008. It is built against version 3.5
of the .NET runtime. Solution and project files in SVN on SourceForge are of the 2008 vintage,
so those users running newer versions of Visual Studio will need to convert them.
The source code is delivered without the ZedGraph library. ZedGraph source may be obtained
from SourceForge. Versions 5.1.4 and 5.1.5 are known to work. It should be possible to link the
build directly against a compiled ZedGraph DLL, although this has not been tried.
To make use of the ZedGraph source distribution, unpack the zip file in a separate directory.
Inside the version directory for the source code, there are two subdirectories (“source” and
“web”), and a VS solution file. Copy the entire contents of the “source” directory into the
“ZedGraph” sub-directory of the WMR100 solution directory. The WMR100 Visual Studio solution
should now load without errors. If there are problems, try removing the ZedGraph project from
the solution and then add it back again.
In order to make options upgrade more reliably, all assemblies are now strong-named. As a
result, if the strong name is changed, the option upgrade process will stop working. To avoid
this do not change any identifying information in AssemblyInfo.cs (except version numbers). Do
not regenerate the key file used to sign the assembly.
Release Notes
Easter Eggs
From time to time, a few early-release features may be included in WSDL. These will not be
documented and must be enabled or changed by hand-editing the “user.config” options file.
These are usually items that will (probably, but not always) be in a future release and are not
fully tested. If you do try one out, feedback in one of the SourceForge forums would be
appreciated.
Please note that numeric values stored in the options file (user.config) are always formatted
according to English (United States) rules. For example, periods (“.”) must be used for decimal
separators – do not use commas (“,”) even if your country normally does this.
There may be several versions of the user.config file floating around. The version containing
default settings is in the installation directory and is named “WxLogger.exe.config”. This is the
default or backup file and is used:
1. When the program is first installed and the user has not set any options yet.
2. When the program is updated and new options have been added.
3. After resetting all options.
Whenever the default file is used, a copy will be made and stored in a local user directory.
From this point on, only the local user copy is referred to – so any changes made to the default
file at this point will NOT have any effect. If you make changes to the default file then – you
must do it after upgrading WSDL but before running it for the first time.
The other versions of the config file are stored in the “Documents and Settings” folder, under
“Local Settings” and “wmrx00” for the current logged in user account. In Windows 7 they are in
a different directory. Drill down to find the file and you’ll discover a separate directory for
each version of WSDL that has been installed on the computer. Refer to the “user.config” file
for the version of WSDL you are running – changes made to other versions will not have any
effect.
Version 4.3.1.0
It is now possible to split the measurement of temperature and humidity for internet uploads
between two sensors. Two different but related situations experienced by the author led to the
addition of this capability.
3. Discovery of a technique for improving temperature accuracy of OS sensors through
thermistor replacment also results in inaccurate RH measurements.
4. Placement of a humidity sensor within a fan-aspirated solar radiation shield can subject
it to high levels of dirt and dust which can cause failure in as little as 12 months.
A good solution to both of these problems is to use one (temperature-only) wireless sensor in
the fan-aspirated shield and a second sensor in a naturally-aspirated shield for humidity
measurements.
As a result, the WSDL options window now offers (in the Hardware tab) the ability to choose
two different sensors for internet uploads. One sensor reports temperature while the other
reports humidity.
WSDL assumes that both sensors are subjected to the same concentration of water vapor (i.e.
the dew point is identical for both sensors), but realizes that one sensor may be at a slightly
different temperature than the other. For example, the fan-aspirated sensor will often be at a
lower temperature on sunny days. Due to this temperature difference, WSDL will adjust RH
values from the “humidity sensor” to match the temperature reported by the “temperature
sensor” so that both sensors display the same dew point.
Dew Point Changes
Versions of WSDL prior to 4.3.1.0 assumed that RH values from OS sensors were relative to
vapor pressure over ice in sub-freezing temperatures. This assumption was probably incorrect.
Furthermore, WSDL computed frost point instead of dew point from this incorrect assumption.
These two factors worked in opposite directions with the net effect of small errors in dew point
computation when the reported (dry bulb) temperature was below freezing.
Starting with 4.3.1.0, WSDL assumes that reported RH values are relative to vapor pressure
over water and always computes dew point, even in sub-freezing temperatures. The difference
between these two calculations is shown in the graph below. The difference is mostly a
function of RH, with larger differences being seen at lower values of RH.
Figure 2: Dew Point Offsets prior to 4.3.1.0
For users concerned about this change in dew point values, the log file still contains the
temperature and RH values reported by the sensors (with user-specified calibration offsets
applied). As such, the dew point values in the log file are really “derived values”. The
temperature and RH values in the log can be used to re-compute correct dew point values using
any desired method.
WSDL now handles dew point an frost point in the following way:
•
WSDL assumes that RH from sensors is always with respect to saturation vapor pressure
over water – never over ice.
•
WSDL always computes dew point (not frost point) from temperature/RH values and
this data is stored in the log file and uploaded to sites like PWS Weather and Weather
Underground (CWOP and AWEKAS only get RH reports – not dew point).
•
When temperature and dew point are above freezing, dew point is always used.
•
When dew point is below freezing, a setting in the options window (Units tab)
determines whether dew point or frost point is displayed in the WSDL main window and
graphs. The default is to show dew point.
Version 4.2.8.5
•
There are several releases between this on and 4.2.3.5. Not all feature changes since
4.2.3.5 are listed here.
•
A rain gauge maintenance mode has been added.
•
The limit on number of wireless sensors has been increased from 10 to 21 for those
WxShield users who have more than 10 sensors. This is not of any use to those using OS
base consoles.
•
Support for more WxShield protocols is enabled – pulse-spacing-modulation for example
that is transmitted by AcuRite sensors and the new OS SL109-H sensor.
Version 4.2.3.5
•
There are huge changes to the way FTP uploads are configured. CSV list files are gone.
A new “Internet Options” window has been created, with five different tabs for setting
up FTP uploads.
•
WSDL will attempt to transfer your current FTP configuration into the new FTP
configuration settings. There may be bugs in this process so check FTP configuration
carefully after running this version for the first time.
•
Support for FTP to multiple sites.
•
Support for WU webcam uploads.
•
AWEKAS configuration should be easier now.
•
Support for OS version 1.0 messages from Arduino.
•
Server options have changed significantly so be sure to update all of your WSDL clients
too.
•
The server now broadcasts raw copies of log file records as they are added to the
weather log file. This is intended for 3rd party data logging applications. This capability
is largely untested in this release. These are broadcast with the identifier “F” and are
contained in structure with a single string member.
Version 4.2.1.4
•
Added an option to disable fatal upload errors. This applies to all uploads including FTP
file transfers.
•
New capability for multi-point temperature and humidity corrections is only available
right now by editing the user.config settings file. See the section on temperature, dew
point and RH processing for more information.
•
Bug fixed where graphs would not update on clients if all ten wireless sensors were
configured.
•
Graphs now display gaps if missing data is present in the weather log for more than 11
minutes (by default). The gap time limit can be changed in the “Misc” tab of the
options window (a gap limit of zero disables the graphing of gaps).
Version 4.2.1.1
Several bug fixes contained in this release:
•
Display units changes did not work with Windows 7 in some countries.
•
Copying settings from previous versions failed in some situations.
•
WMR88 was getting kick-started when not required.
•
WMR88 was reporting an unknown forecast item (5).
And some new features too:
•
Two buttons added to the FTP options tab which automatically configure AWEKAS
uploads.
•
FTP upload options have been enhanced slightly to distinguish between a single-file
upload and multiple-file uploads. Hopefully, this will make things slightly less confusing
for new users.
•
New choice for WMR88 added to hardware options.
•
Added a button to run Notepad editor on the template or CSV list file in the FTP
options window.
Version 4.2
There are a lot of enhancements and bug fixes since the last official release of WSDL (3.4.2).
This version was in beta testing for several months, getting all the bugs fixed but as always
there are undoubtedly still a few left.
Changes
Here’s a summary of the changes in this release.
•
Client/Server/Service capability added. The “Service” option is not really a Windows
service, but is capable of being started at computer boot time with nobody logged in
and runs without a display window being visible.
•
Arduino support added. This can replace the WMR100 console to receive wireless data
and includes a more accurate barometer and indoor temperature/humidity sensor.
Several documents will soon be available for download detailing how to build a shield
board for receiving wireless data from OS sensors.
•
FTP graphics can be de-coupled from the display graphics configuration.
•
Graphics layouts (number of graphs, graph types, etc.) can be stored under userdefined names and recalled later. Useful to create different layouts to analyze
different kinds of weather – storms, heat waves and so on.
•
New FTP tags for cumulative data – such as the highest or lowest temperature in the
last “d” days, or the amount of rain received in the last “n” days. New tag for rain
received on some day “d” in the past. The tags are documented in this manual.
•
Wind direction calibration offset added.
•
PWS Weather uploads added.
•
Manual rain input for those who do not use the OS rain bucket (e.g. CoCoRaHS
members).
•
AWEKAS file automatically built as part of FTP upload operation. Users only need to
include the result file as part of a multiple file upload to get AWEKAS support.
•
More options to change graph colors.
•
Barometer calibration offset in the options window.
•
WSDL client plug-in software example.
•
Documents for building the first version of an Arduino shield board.
•
Clients can copy server option settings for easy initialization.
There are so many changes and bug fixes in this release that the list above is probably not
complete, so just poke around the user interface any you may discover additional changes not
listed above.
Version 3.4.2
More bug fixes in this release:
1. The tool to write a processed log file was failing.
2. The log backup procedure got stuck in an infinite loop if the time zone had a positive
UTC offset.
3. Temperature-only wireless sensors were not properly recognized and processed.
4. Decoded temperatures above 25.5C or below -25.5C were in error by 0.1C.
Temperatures above 51.1C or below -51.1C would have been in error by 0.2C (although
it is unlikely many users actually experienced temperatures this extreme).
Version 3.4.1
Three minor fixes are in this release.
1. Dates for new and/or full moon may have been off by one day. This should be more
accurate now most of the time – but still may be off by one day occasionally. A future
release may improve on the accuracy.
2. The tool which creates a processed log file was failing.
3. If a log file backup fails, the next backup is now scheduled as if the backup had
worked. Diagnostic information about the failure will be available in the message log.
Version 3.4
User options are now stored in an invariant format (English (United States)). WSDL should be
able to read option files (user.config) which used European formatting although this has not
been tested with all language settings. Existing user.config files will not be altered, so in the
worst case, users will not lose previous option settings (they will still be contained in the
previous version of “user.config”).
These changes may also affect option settings; however there is no danger that previous
settings will be lost. If problems occur, the previous user.config file will not be damaged and
settings can be recovered. Please see the section above about Easter Eggs, and the section on
Program Options in the “Program Features” chapter for more information.
•
The biggest change is the ability to show multiple graphs in the WSDL window. Look in
the Options window under the “Misc” tab for more information.
•
Graphs are now saved as PNG files and can be uploaded via FTP. See the FTP section in
this manual for details.
•
Another large change is support for regional language settings with different numeric
formats than used in the United States of America. Specifically, many countries in
Europe (among other places) use a comma (“,”) instead of a period (“.”) to separate
the integer and fractional parts of numbers. Versions of WSDL prior to 3.4 do not work
in these situations.
•
Some new tags have been added for FTP upload. See the tag list elsewhere in this
manual for details.
•
Various bug fixes. Rain rate was not properly decoded from WMR200 weather stations.
•
Graph colors (besides temperature/dew point/RH) can now be changed, including
graph background color. However this is only available as an “Easter Egg”. See the subsection “The Graph(s)” in the Reference section of this manual for details.
•
Estimated wireless sensor communications statistics have been added to the message
log.
•
Formatting of the message log has been improved for multi-line messages and the font
used in the message panel has been changed to one with fixed spacing for better
readability. The message sub-window’s font has not been altered.
•
A bug which caused the date of the next full or new moon to be off by one day was
fixed.
Version 3.1
•
Option to compress log file backups with 7-zip added (this was an “Easter Egg” in the
original 3.0 release).
•
New option tab added for the weather station’s geographic location. Several items
were moved from the Upload and Calibration tabs, as these tabs were a bit crowded.
Data entry for latitude and longitude was modified to be a bit less confusing.
•
A couple of bugs in the options window were fixed which caused incorrect display of
user options, and/or the inability to change those options.
•
A crash bug when changing some options with an empty weather log file was fixed.
•
Bugs with display and/or web page output for daily rain totals fixed.
•
Bug with possible log file inconsistencies fixed. This might manifest as bad UV and/or
temperature/RH/dew point graph values or web page numbers. WSDL will detect and
repair any problems with the log file; there should be no loss of data from the log.
•
Web page output for temperature, RH and dew point no longer includes the units
directly with numbers. Two new tags, [TempUnits] and [RhUnits] should be used to
append units to these numbers.
•
Scrambled channel number labels in options “Hardware” tab fixed.
•
Added display of rain rate to main window.
Version 3.0
•
Support for WMR200 weather stations. Battery and forecast icon indications may not be
accurate yet, however.
•
Support for WeatherJack barometer
•
Web page (HTML) generation and FTP upload capabilities
•
Temperature and humidity calibration options
•
WSDL can compute SLP and override the WMR100’s SLP value
•
Display of weather forecast from WMR100 (requires making the WSDL window larger)
•
Full support for external UV sensors
•
Partial (might be buggy) support for THWR800 water temperature sensor
•
Auto-dial option for dial-up internet connections
•
Messages can now be viewed in a separate window (“panel”)
•
Barometer graph can show one of three different values, station pressure, altimeter
setting or sea level pressure
•
Wind gust graph can now display averaged data (as in earlier versions), a 10-minute
peak hold or raw gust data.
•
Support for 64-bit operating systems (XP, Vista and Windows 7)
•
The “Write Daily Extremes” function has been enhanced to output extremes for all
configured wireless sensors. The order of columns in the output file has also been
changed to be more compatible with a variable number of wireless sensors.
•
Many miscellaneous bug fixes.
Version 2.9.7.1
•
Fixed problems with 64-bit versions of Windows
•
Added hecto-Pascals (hPa) for barometer units
•
Changed text of meters/second from “MPS” to “m/s”
•
Several problems with temperature and relative humidity calibration settings fixed.
•
Miscellaneous other bug fixes.
•
New HTML examples.
Version 2.9.5.1 (Beta)
•
Support for WMR200
•
HTML web page generation capability with optional FTP upload
•
Adjustable timeout period for wireless sensors
•
Option to delay uploads if temperature data is stale
•
Messages can now be displayed in a separate window
•
Full support for UV sensor (display in window plus graphing)
•
Ability to compute more accurate version of SLP than WMR100
•
WeatherJack barometer support
•
Display of battery status for all optional wireless sensors (including UV)
•
Many minor tweaks and bug fixes that I forgot to write down
Version 2.8.8.1
•
Added the ability to display QNH in the barometer readout area. It is not possible to
graph QNH at this point. This displays the value that will be reported to CWOP.
•
A problem with W.U. uploads and certain types of internet connections were found.
Some proxy servers may occasionally respond to the W.U. upload request with their
own HTML instead of passing the request through to W.U. Previously WSDL considered
this to be a fatal error and disabled uploads. This has been changed to a non-fatal error
so upload attempts will continue.
•
Dew point calculations are now made using slightly better formulas. The improvement
is very slight and most users won’t notice any change at all.
•
Software name (WSDL) and version added to W.U. upload data.
Version 2.8.7.2 BETA
•
Capability to upload data to CWOP servers was added. Setup options for CWOP were
added to the “Web” tab of the options dialog.
•
Temperature and dew point upload data is now a 5-minute average of WMR100 data.
Relative humidity data uploaded is a 1-minute average. This averaging is recommended
by the CWOP.
•
Logged temperature, humidity and dew point are now 1-minute averages of data
reported by the WMR100. This helps to reduce “noise” a little bit.
•
For those with dial-up internet connections, there is an option to have the dial-up
connection dialed and then hang-up for each data upload.
•
Wind graph origin now saved in settings.
•
Temperature display age colors did not reflect the chosen sensors.
•
Increased some aging timeouts slightly to allow one missing wireless reading before
going yellow. Four readings must be missing before going red.
•
Temperature aging labels were incorrect if the default sensors being displayed were
changed. This has been fixed.
•
A single separate RH calibration setting is now available for any extra outdoor sensors
on channels 2-10.
Version 2.8
•
Support for the maximum number of wireless temperature sensors.
o
Graphic display
o
Text readouts
o
Sensor Names
o
Temperature graph colors for each sensor
•
Window size is now adjustable.
•
Rain-processed log file conversion utility.
•
Rain-rate added to precipitation graph.
•
Option to count rain bucket tips with user-specified bucket tip amount.
•
Weather Underground updates are not delayed if some information is invalid.
•
Corrupt or invalid weather log files caused the program to silently exit with no
explanation. An error dialog will pop up now to explain the problem.
•
Graphs may have shown backwards lines if the log file UTC offset was negative instead
of zero. There were probably other issues for positive offsets. These problems are
fixed.
Version 2.5
•
Changing graph time scale no longer re-loads the weather log from disk. This was
taking a long time with large log files. Instead, 30-days worth of data is kept in memory
for faster access.
•
Weather Underground upload support added.
•
Rainfall data can now be sourced from the weather log instead of what the station is
reporting. Daily rainfall (rain since midnight) is reported instead of rain over the last
24-hour period.
•
Windows Vista now supported. The sole change that allows this was moving option
settings out of the registry.
•
Rain gage and relative humidity calibration added.
•
Pressure rate is now computed over a 2-hour period instead of 15-minutes.
•
Windows 2000 USB data errors are reduced in frequency.
•
Bugs having to do with computing daily extremes from log file data fixed.
•
Dialogs added to help users with option settings. Several related problems fixed.
•
Dates/times in the daily extreme output file are now using the display time zone or
UTC offset. The naming convention for the file (GMT) has not changed.
•
The distribution is built with ZedGraph version 5.1.5.