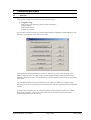
1
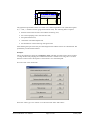
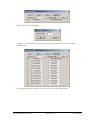
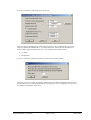
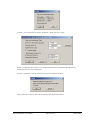
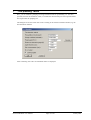
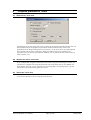
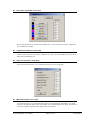
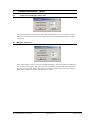
Evaluation and representation of pumping tests
GGU-PUMPTEST
VERSION 2
January 2001
Copyright and author: Prof. Johann Buß, Braunschweig
Contents:
1 Preface .................................................................................................................................. 4
2 Installation and language selection .................................................................................... 4
3 Theoretical principles .......................................................................................................... 5
3.1 Overview .......................................................................................................................... 5
3.2 Time-drawdown method .................................................................................................. 6
3.3 Distance-drawdown method............................................................................................. 9
3.4 Distance-time-drawdown method .................................................................................. 12
3.5 Theis recovery method ................................................................................................... 17
3.6 Theis type curve method ................................................................................................ 20
4 “File” menu ........................................................................................................................ 25
4.1 “New” menu item........................................................................................................... 25
4.2 “Load” menu item .......................................................................................................... 25
4.3 “Save” and “Save as” menu items.................................................................................. 25
4.4 “Read datalogger” menu item ........................................................................................ 25
4.5 “Read ASCII” menu item............................................................................................... 25
4.6 “Save ASCII” menu item ............................................................................................... 25
4.7 “Output preferences” menu item.................................................................................... 26
4.8 “Print and export” menu item......................................................................................... 26
4.9 “Exit” menu item............................................................................................................ 27
5 “Edit” menu ....................................................................................................................... 28
5.1 “Initial water level” menu item ...................................................................................... 28
5.2 “At-rest groundwater” menu item .................................................................................. 28
5.3 “Test data” menu item.................................................................................................... 28
5.4 “Edit values” menu item................................................................................................. 28
5.5 “Graphically” menu item................................................................................................ 29
5.6 “Modify” menu item ...................................................................................................... 30
5.7 Value range “manually” menu item ............................................................................... 30
5.8 “All” menu item ............................................................................................................. 31
5.9 “Fit in” menu item.......................................................................................................... 31
5.10 “Graphically” menu item................................................................................................ 31
5.11 "General" menu item ...................................................................................................... 31
5.12 “Result text” menu item ................................................................................................. 32
5.13 “Company” menu item................................................................................................... 32
6 “Evaluation” menu ............................................................................................................ 33
6.1 “Diagnosis” menu item .................................................................................................. 33
6.2 “Time-drawdown method, distance-drawdown method, etc” menu items..................... 33
6.3 “Permeability” menu item .............................................................................................. 33
6.4 “Individual values” menu item....................................................................................... 34
6.5 “Hand fit” menu item ..................................................................................................... 34
6.6 “Auto fit” menu item...................................................................................................... 34
7 “Test planning” menu ....................................................................................................... 35
GGU-PUMPTEST User Manual
Page 2 of 46
January 2001
8 “Graphics preferences” menu .......................................................................................... 36
8.1 "Preferences" menu item ................................................................................................ 36
8.2 “Refresh and zoom” menu item ..................................................................................... 36
8.3 “Zoom info” menu item ................................................................................................. 36
8.4 “Pen colour and width” menu item ................................................................................ 37
8.5 “Legend font selection” menu item................................................................................ 37
8.6 “Font size selection” menu item..................................................................................... 37
8.7 “Mini-CAD toolbar” menu item..................................................................................... 37
8.8 "Toolbar preferences" menu item................................................................................... 38
8.9 "Save preferences" menu item........................................................................................ 38
8.10 “Load” menu item .......................................................................................................... 38
9 “Output preferences” menu.............................................................................................. 39
9.1 “Page size and margins” menu item............................................................................... 39
9.2 “Margins” menu item ..................................................................................................... 39
9.3 "Texts" menu item.......................................................................................................... 40
9.4 "Position info" menu item .............................................................................................. 41
9.5 "Measured values" menu item........................................................................................ 41
9.6 "Title" menu item ........................................................................................................... 41
9.7 “Company” menu item................................................................................................... 42
9.8 "Test no., etc." menu item .............................................................................................. 42
9.9 "Appendix and report" menu item.................................................................................. 42
9.10 "Test data" menu item .................................................................................................... 43
9.11 "Result texts" menu item ................................................................................................ 43
9.12 "Evaluation range" menu item........................................................................................ 43
9.13 "System" menu item ....................................................................................................... 43
9.14 "Gauge" menu item ........................................................................................................ 44
9.15 "Reset all graphics to defaults" menu item..................................................................... 44
9.16 "Move elements" menu item .......................................................................................... 44
10 "?" menu ............................................................................................................................ 45
10.1 “Copyright” menu item .................................................................................................. 45
10.2 “Maxima” menu item ..................................................................................................... 45
10.3 “Help” menu item........................................................................................................... 45
10.4 “GGU on the web” menu item ....................................................................................... 45
10.5 “What’s new ?” menu item ............................................................................................ 45
10.6 “Translation” menu item ................................................................................................ 45
11 Index.................................................................................................................................... 46
List of tables:
Table 1 Gauge 3b data.....................................................................................................................6
Table 2 Gauges 3b, 6b and 11b data .............................................................................................10
Table 3 Gauge 6b data...................................................................................................................15
Table 4 Gauge 11b data.................................................................................................................16
Table 5 Recovery in Gauge 11b .....................................................................................................18
GGU-PUMPTEST User Manual
Page 3 of 46
January 2001
1
Preface
The GGU-PUMPTEST program allows the evaluation of pumping tests using the following
methods:
• time-drawdown method;
• distance-drawdown method;
• distance-time-drawdown method;
• Theis recovery method;
• Theis type curve method.
Besides the evaluation of pumping tests, the program allows pumping test planning (“Test
planning” menu). Here, you can simulate a pumping test using estimated values for permeability,
etc. It is then possible, based on the simulation results, to estimate the measurement precision
required and the time required for the pumping test.
Data input is in accordance with WINDOWS conventions and can therefore be learned almost
entirely without the use of a manual. Graphic output supports the true-type fonts supplied with
WINDOWS, so that excellent layout is guaranteed.
The results are graphically represented on a sheet consisting of a number of elements. These
elements can be resized and repositioned to suit your requirements. In addition, you can add your
own graphic elements using the integrated Mini-CAD module. You can insert stamp fields (e.g.
company logos) in the same manner. The default format is an A4 sheet. If required the sheet
format can be modified (e.g. A0).
The program has been thoroughly tested. No faults have been found. Nevertheless, liability for
completeness and correctness of the program and the manual, and for any damage resulting from
incompleteness or incorrectness, cannot be accepted.
2
Installation and language selection
For installation and subsequent registration of GGU software, please refer to the information in
the “Installation notes for GGU Software”, which are supplied with the program.
GGU-PUMPTEST (International version) is a bilingual program. You may choose to work in
German or English. The international version is delivered with English as the default menu and
graphics language.
If you would like to work with GGU-PUMPTEST (International version) in German, start the
program and go to “File / New” in the initial menu bar. An expanded menu bar appears. Go to the
“?” menu and there to the menu item “International version” and deactivate the switch for
translating the menus and graphics (see also Section 10.6).
GGU-PUMPTEST User Manual
Page 4 of 46
January 2001
3
3.1
Theoretical principles
Overview
The program is based on the theoretical principals described in:
• Langguth / Voigt
Hydrogeologische Methoden (Hydrogeological Methods)
Springer-Verlag
ISBN 3-540-10174-8
ISBN 0-387-10174-8
You can also acquaint yourself very quickly with the data input methods without reading the usermanual by going directly to the “File / New” menu.
Then select the evaluation method of your choice. After this, go to the “Test planning” menu.
Enter the required values according to the selected evaluation method. The program will then
simulate a pumping test and you can subsequently view the simulated values in the corresponding
menu items.
The individual methods will now be explained in more detail. In addition, an example will be
described in each case. All examples are provided as files with the program and can be loaded and
viewed.
You must enter a drawdown for all evaluation methods. These drawdown values are so-called
depth-to-(ground)water values: That is, the values must be entered as positive downwards
(measured from the at-rest water level).
GGU-PUMPTEST User Manual
Page 5 of 46
January 2001
3.2 Time-drawdown method
The theoretical principles are described in Langguth / Voigt on pages 165 to 167.
This method entails a drawdown in a well with a constant pumping rate. At the same time, the
course of the drawdown is measured in a nearby monitoring well.
The graphical representation of the test results is in a semi-logarithmic scale (drawdown against
time). The following data is required:
• distance between the extraction well and the monitoring well;
• the constant pumping rate in the extraction well;
• the aquifer thickness H;
• confined or unconfined aquifer and;
• the drawdown h against time in the monitoring well.
After defining the input values they are entered against time and the best-fit curve determined. The
permeability can then be determined.
Example:
This is the example given for Gauge 3b in Langguth / Voigt. The following values were
measured in Gauge 3b:
Time [s]
12.0
18.0
22.0
36.0
54.0
81.0
122.0
226.0
346.0
434.0
549.0
689.0
h [m]
0.050
0.100
0.150
0.250
0.350
0.450
0.550
0.700
0.800
0.850
0.900
0.950
Time [s]
861.0
1080.0
1420.0
1800.0
2160.0
2760.0
3480.0
4380.0
5280.0
8100.0
11600.0
14150.0
h [m]
1.000
1.050
1.110
1.150
1.200
1.250
1.300
1.350
1.390
1.480
1.550
1.580
Table 1 Gauge 3b data
The pumping rate in the extraction well is 0.02667 m³/s. Gauge 3b is 23.0 m from the extraction
well. The aquifer is 10.0 m thick. It is a confined aquifer.
GGU-PUMPTEST User Manual
Page 6 of 46
January 2001
Go to the "File / New" menu item.
Select the “Time-drawdown method” button. Go to the menu item “Edit / Edit values”.
Choose the "0 values to edit" button
and enter “24”, because the test comprises 24 measured values. Enter the values given in Table 1
Gauge 3b data.
GGU-PUMPTEST User Manual
Page 7 of 46
January 2001
These values represent the times and corresponding drawdown in the monitoring well relative to
the at-rest groundwater level. Navigate through the table using the “Forw.” Button in order to
enter further values. Go to the “Evaluation / Time-drawdown method” menu item.
Enter the values in the dialogue box and confirm with “OK”.
GGU-PUMPTEST User Manual
Page 8 of 46
January 2001
The “a” and “b” values describe the course of the best-fit curve through the data. The “r” value is
the correlation coefficient, representing the quality of the best-fit curve. Below this, the
permeability, the transmissivity and the storage coefficient are given. The t0 value describes the
intersection of the best-fit curve with the time axis.
The solution given in Langguth / Voigt is:
• T = 9.4 * 10-3 m²/s;
• S = 4.6 * 10-4 m²/s.
The minor differences are due to the purely visual evaluation employed by Langguth / Voigt.
3.3 Distance-drawdown method
The theoretical principles are described in Langguth / Voigt on pages 167 to 169.
This method entails a drawdown in a well with a constant pumping rate. At the same time, the
drawdown at a given time is measured in at least two nearby monitoring wells.
Abstände
GGU-PUMPTEST User Manual
H
Page 9 of 46
3 Pegel
Brunnen
h
January 2001
The graphical representation of the test results is in a semi-logarithmic scale (drawdown against
distance). The following data is required:
• distances between the extraction well and the monitoring wells (>= 2);
• the drawdown h in the monitoring wells at a given time;
• the constant pumping rate in the extraction well;
• the aquifer thickness H;
• confined or unconfined aquifer.
After defining the input values they are entered against the distances to the extraction wells and
the best-fit curve determined. The permeability can then be ascertained.
Example:
This is the example for Gauges 3b, 11b and 6b in Langguth / Voigt.
The pumping rate in the extraction well is 0.02667 m³/s. In Table 2 Gauges 3b, 6b and 11b data
the distances of the three gauges to the extraction well and the drawdown at time t = 5400 seconds
are given.
Gauge
11b
3b
6b
Distance [m]
7.40
23.00
139.60
Drawdown h [m]
1.990
1.394
0.611
Table 2 Gauges 3b, 6b and 11b data
The aquifer is 10.0 m thick. It is a confined aquifer.
Go to the "File / New" menu item.
Select the “Distance-drawdown method” button.
GGU-PUMPTEST User Manual
Page 10 of 46
January 2001
Go to the menu item “Edit / Edit values”.
Choose the "0 values to edit" button
and enter “3”, because the test comprises measured values from 3 wells. Enter the following
values:
These values represent the distances of the monitoring wells to the extraction well and the
corresponding drawdown relative to the at-rest groundwater level.
Go to the “Evaluation / Distance-drawdown method” menu item.
GGU-PUMPTEST User Manual
Page 11 of 46
January 2001
Enter the values in the dialogue box and confirm with “OK”.
The “a” and “b” values describe the course of the best-fit curve through the data. The “r” value is
the correlation coefficient, representing the quality of the best-fit curve. Below this, the
permeability, the transmissivity and the storage coefficient are given. The r0 value describes the
intersection of the best-fit curve with the distance axis.
The solution given in Langguth / Voigt is:
• T = 9.0 * 10-3 m²/s
• S = 4.8 * 10-4 m²/s.
The minor differences are due to the purely visual evaluation employed by Langguth / Voigt.
3.4 Distance-time-drawdown method
The theoretical principles are described in Langguth / Voigt on pages 169 to 171.
This method entails a drawdown in an extraction well with a constant pumping rate. At the same
time, the course of the drawdown in this well is measured in at least two nearby monitoring wells.
GGU-PUMPTEST User Manual
Page 12 of 46
January 2001
Abstände r
H
3 Pegel
Brunnen
h
The graphical representation of the test results is in a semi-logarithmic scale (drawdown against
“Time / square of distance [t/r²]”). The following data is required:
• distances (r) between the extraction well and the monitoring wells;
• the constant pumping rate in the extraction well;
• the aquifer thickness H;
• confined or unconfined aquifer and;
• the drawdown h against time in the monitoring wells.
After defining the input values they are entered against t/r² (t = time, r = distance to monitoring
well) and the best-fit curve determined.
Example:
This is the example for Gauges 3b, 11b and 6b in Langguth / Voigt. The principal boundary
conditions correspond to those of the previous two examples.
Go to the "File / New" menu item.
Select the “Distance-time-drawdown method” button. Go to the menu item “Edit / Edit values”.
GGU-PUMPTEST User Manual
Page 13 of 46
January 2001
Click the “New” button.
Enter the well name and the distance to the extraction well. Select the “Edit values” button.
Enter “24” for the number of values, because the test comprises 24 measured values for the well
“Gauge 3b”. Enter the values given in Table 1 Gauge 3b data.
Repeat this procedure for the other two gauges, “6b” and “11b”.
Gauge 6 b:
GGU-PUMPTEST User Manual
Page 14 of 46
January 2001
Table 3 Gauge 6b data
Time [s]
240.0
360.0
600.0
780.0
1140.0
1500.0
2040.0
2760.0
3900.0
4800.0
6450.0
8650.0
11450.0
13900.0
h [m]
0.140
0.200
0.250
0.290
0.350
0.400
0.450
0.500
0.550
0.590
0.650
0.710
0.760
0.800
Table 3 Gauge 6b data
Gauge 11 b:
GGU-PUMPTEST User Manual
Page 15 of 46
January 2001
Enter the values given in Table 4 Gauge 11b data.
Time [s]
17.0
21.0
27.0
35.0
53.0
85.0
168.0
220.0
281.0
330.0
450.0
540.0
720.0
1080.0
1440.0
2100.0
3000.0
3900.0
5400.0
8300.0
14600.0
h [m]
0.300
0.400
0.500
0.700
0.930
1.030
1.200
1.280
1.350
1.400
1.470
1.500
1.560
1.640
1.710
1.790
1.860
1.900
1.990
2.070
2.180
Table 4 Gauge 11b data
Go to the “Evaluation / Distance-time-drawdown method” menu item.
Enter the values in the dialogue box and confirm with “OK”.
GGU-PUMPTEST User Manual
Page 16 of 46
January 2001
The “a” and “b” values describe the course of the best-fit curve through the data. The “r” value is
the correlation coefficient, representing the quality of the best-fit curve. Below this, the
permeability, the transmissivity and the storage coefficient are given. The (t/r²)0 value describes
the intersection of the best-fit curve with the distance axis.
The solution given in Langguth / Voigt is:
• T = 8.9 * 10-3 m²/s
• S = 4.6 * 10-4 m²/s.
The minor differences are due to the purely visual evaluation employed by Langguth / Voigt.
3.5 Theis recovery method
The theoretical principles are described in Langguth / Voigt on pages 171 to 175.
This method entails a drawdown in a well with a constant pumping rate. Recovery begins after
switching off the pump in the extraction well. The recovery course is measured in a nearby
monitoring well.
GGU-PUMPTEST User Manual
H
Page 17 of 46
Pegel
Brunnen
h
January 2001
The following data is required for this method:
• the pumping duration until the pump is switched off;
• the constant pumping rate until the pump is switched off;
• the aquifer thickness H;
• confined or unconfined aquifer and;
• the course against time of the recovery h.
After defining the input values they are entered against
(dt + tp) / dt
dt = time difference until 1st measurement
tp = pumping duration
and the best-fit curve for this function determined; from this, the permeability can be calculated.
Example:
This is the example for Gauge 11b in Langguth / Voigt. After switching off the pump the
following recovery is measured in Gauge 11b:
Time [s]
14600.0
14765.0
14823.0
14871.0
14920.0
15235.0
15332.0
15600.0
15810.0
16180.0
16400.0
17300.0
17900.0
18560.0
19220.0
20700.0
23000.0
h [m]
2.180
1.030
0.950
0.900
0.850
0.690
0.650
0.590
0.550
0.470
0.440
0.350
0.300
0.260
0.230
0.170
0.090
Table 5 Recovery in Gauge 11b
GGU-PUMPTEST User Manual
Page 18 of 46
January 2001
Go to the "File / New" menu item.
Select the “Theis recovery” button. Go to the “Edit / Edit values” menu item and enter the values
from Table 5 Recovery in Gauge 11b.
Navigate through the table using the “Forw.” Button in order to enter further values. Go to the
“Evaluation / Theis recovery” menu item:
GGU-PUMPTEST User Manual
Page 19 of 46
January 2001
Enter the values in the dialogue box and confirm with “OK”.
The “a” and “b” values describe the course of the best-fit curve through the data. The “r” value is
the correlation coefficient, representing the quality of the best-fit curve. Below this, the
permeability and the transmissivity are given.
The solution given in Langguth / Voigt is:
• T = 8.4 * 10-3 m²/s
The minor differences are due to the purely visual evaluation employed by Langguth / Voigt.
3.6 Theis type curve method
The theoretical principles are described in Langguth / Voigt on pages 153 to 164.
This method entails a drawdown in a well with a constant pumping rate. At the same time, the
course of the drawdown is measured in a nearby monitoring well.
GGU-PUMPTEST User Manual
Page 20 of 46
January 2001
139.60 m
H
Pegel
Brunnen
h
The graphical representation of the test results is in a double-logarithmic scale (drawdown against
t/r², t = time, r = distance between gauge and extraction well). The following data is required:
• distance between the extraction well and the monitoring well;
• the constant pumping rate in the extraction well;
• the aquifer thickness H;
• confined or unconfined aquifer and;
• the drawdown h in the monitoring well against time.
After defining the input values they are entered against time and the best-fit curve determined. The
permeability can then be determined.
Example:
This is the example for Gauge 6b in Langguth / Voigt. The data for Gauge 6b are shown in Table
3 Gauge 6b data. The pumping rate in the extraction well is 0.02667 m³/s. Gauge 6b is 139.60 m
from the extraction well. The aquifer is 10.0 m thick. It is a confined aquifer.
Go to the "File / New" menu item.
Select the “Theis type curve” button. Go to the menu item “Edit / Edit values”.
GGU-PUMPTEST User Manual
Page 21 of 46
January 2001
Choose the "0 values to edit" button
and enter “14”, because the test comprises 14 measured values. Enter the values given in Table 3
Gauge 6b data.
Navigate through the table using the “Forw.” Button in order to enter further values.
GGU-PUMPTEST User Manual
Page 22 of 46
January 2001
Go to the “Evaluation / Theis type curve” menu item:
Enter the values in the dialogue box and confirm with “OK”. The “Displacement to type curve”
values are determined automatically or “by hand” afterwards. After input, the measured curve
must be made congruent with the type curve. Two methods can be used to do this:
• “by hand”;
• automatically.
Go to the “Evaluation / Hand fit” menu item to select the “by hand” method.
Then click on the curve within the graphic with the left mouse button and hold the button pressed.
Now displace the curve until the measured curve and the type curve are congruent. Now go to the
“Evaluation / Permeability” menu item.
GGU-PUMPTEST User Manual
Page 23 of 46
January 2001
To check, you can select the menu item “Evaluation / Theis type curve” again.
Because of the displacement of the curve, the displacement factors required for determination of
permeability have now been determined.
Go to the “Evaluation / Auto fit” menu item to select the automatic method.
The program only requires a short time to determine the displacement factors.
GGU-PUMPTEST User Manual
Page 24 of 46
January 2001
The solution given in Langguth / Voigt is:
• T = 1.1 * 10-3 m²/s
• S = 2.4 * 10-4 m²/s.
The minor differences are due to the purely visual evaluation employed by Langguth / Voigt.
4
4.1
“File” menu
“New” menu item
You can evaluate a new pumping test using this menu item.
4.2 “Load” menu item
Here you can load a file previously created file containing test data and saved to disk in a previous
session. This file can be edited, modified and re-evaluated, etc.
4.3 “Save” and “Save as” menu items
You can generate a file containing the current test data and have it available for a later session.
Subsequent loading results in exactly the same representation as at the time of saving.
4.4 “Read datalogger” menu item
W.A.S. (Braunschweig) datalogger files can be imported directly (MDSII).
4.5 “Read ASCII” menu item
ASCII data can be imported using this menu item.
4.6 “Save ASCII” menu item
Values can be saved as ASCII data using this menu item.
GGU-PUMPTEST User Manual
Page 25 of 46
January 2001
4.7 “Output preferences” menu item
You can edit printer preferences or select another printer in accordance with WINDOWS
conventions.
4.8 “Print and export” menu item
The following dialogue box appears:
“Printer”
allows graphic output of the current screen contents to the WINDOWS standard printer or to any
other printer selected using the menu item “Output preferences”. For direct output (printer), the
following dialogue box appears:
GGU-PUMPTEST User Manual
Page 26 of 46
January 2001
In the upper part of the dialogue box, the maximum dimensions that the printer can accept are
given. Below this you see the dimensions of the image to be printed. If the image is larger than the
output format of the printer it will be printed to several pages (in the above example, 2). In order
to facilitate better re-connection of the images, it is possible to enter an overlap for each page, in x
and y direction. Alternatively, it is also possible to select a smaller zoom factor, ensuring output to
one page (“Fit to page” button). Following this, you can enlarge to the original format on a
copying machine, to ensure true scaling. Furthermore, you may enter the number of copies to be
printed.
“DXF file”
allows output of the graphics to a DXF file. DXF is a common file format for transferring graphics
between a variety of applications.
“GGUCAD file”
allows export of the current screen contents to a file, in order to enable further processing with the
GGUCAD program.
“Clipboard”
The current screen contents are copied to the WINDOWS clipboard. From there, they can be
imported into other WINDOWS programs for further processing, e.g. into a word processor.
“Metafile”
allows output of the current screen contents to a file, in order to be further processed with third
party software. Output is as a standardised EMF file. Using the metafile format guarantees the best
possible quality when transferring graphics.
„MiniCAD“ / „GGUMiniCAD“
allows export of the graphics to a file in order to enable importing into different GGU applications
with the MiniCAD modules (see menu).
4.9 “Exit” menu item
After a confirmation prompt, you can quit the program.
GGU-PUMPTEST User Manual
Page 27 of 46
January 2001
5
5.1
“Edit” menu
“Initial water level” menu item
Normally, the at-rest water level is the reference level and has the value “0.0”. If you need to enter
your data with an at-rest water level <> “0.0”, enter the at-rest water level here (depth-to-water,
measured from top, positive downwards).
5.2 “At-rest groundwater” menu item
If, during a test, the at-rest groundwater level changes for reasons unconnected to the pumping test
(e.g. tidal influence), but is superimposed upon it, you can define a polygon course here that
describes this change as a function of time, e.g.:
5.3 “Test data” menu item
Using this menu item you can enter further test data.
The data entered here have no influence on the test evaluation! They are descriptive only. Only if
entries are made here is anything entered in the table at the bottom of the graphic.
5.4 “Edit values” menu item
This is the central menu item for data input. Depending on the test evaluation method a dialogue
box opens. The details are more thoroughly described in the examples in Section 3.
GGU-PUMPTEST User Manual
Page 28 of 46
January 2001
5.5 “Graphically” menu item
Using this menu item it is possible to edit values or to add and delete values. To do this, switch to
diagnosis mode. Go to the “Evaluation / Diagnosis” menu item.
Then go to the menu item "Edit / Graphically".
Now select the type of modification needed. You can then move, set or delete the values.
GGU-PUMPTEST User Manual
Page 29 of 46
January 2001
5.6 “Modify” menu item
You can modify the values in a wide variety of ways using this menu item. Using the “Roughen
values” button, for example, you can roughen simulated values (see “Test planning” menu item)
and thus give them an “impression of authenticity”.
5.7 Value range “manually” menu item
You can define the representation range for the graphic, and the evaluation range. The
representation range does not influence the test evaluation. Using the figures given for the
evaluation range, it is possible to exclude test values at the beginning and end of the test from the
evaluation. The evaluation range is marked by two vertical lines in the graphic.
GGU-PUMPTEST User Manual
Page 30 of 46
January 2001
5.8 “All” menu item
After selecting this menu item the graphic is adjusted so that all data points are visible. In addition,
the evaluation range is adjusted to include all values in the evaluation (also see Section 5.7).
5.9 “Fit in” menu item
After selecting this menu item the graphic is adjusted so that all data points are visible. The
evaluation range is not altered by this (also see Section 5.7).
5.10 “Graphically” menu item
You can define a new evaluation range (also see Section 5.7).
5.11 "General" menu item
You can enter general information on the pumping test; these are displayed in the graphic. You
can alter further settings by going to “Output preferences / Texts”; this also allows the descriptive
texts to be edited (at the left of the dialogue box).
GGU-PUMPTEST User Manual
Page 31 of 46
January 2001
5.12 “Result text” menu item
Once the permeability has been calculated the program proposes a result text to be used in the
graphic. You can edit the result text using this menu item. You can also open this dialogue box by
double-clicking in the corresponding area of the graphic.
5.13 “Company” menu item
You can enter a four-lined text to be included in the graphic. You can also open this dialogue box
by double-clicking in the corresponding area of the graphic. The integrated Mini-CAD module
provides a far greater variety of options (with company logo) (see separate user-manual).
GGU-PUMPTEST User Manual
Page 32 of 46
January 2001
6
6.1
“Evaluation” menu
“Diagnosis” menu item
You can perform a data diagnosis using this menu item. However, the diagnosis is visual only.
Each axis can be diagnosed using one of four options, independent of the other. A further
speciality is the option of including the derivation of the curve in the graphic. Often, irregularities
in the measurement data can be better identified on the basis of the derivation curve.
6.2 “Time-drawdown method, distance-drawdown method, etc” menu items
The title of this menu item varies according to the selected evaluation method. The details are
more thoroughly described in the examples in Section 3.
6.3 “Permeability” menu item
The program calculates the permeability.
The dialogue box for this menu item varies according to the selected evaluation method. The
proposed result text can be included in the graphic by clicking “Yes”.
GGU-PUMPTEST User Manual
Page 33 of 46
January 2001
6.4 “Individual values” menu item
You can determine information for individual data points, e.g.:
6.5 “Hand fit” menu item
This menu item is only accessible if you are using the “Theis type curve” method for evaluation.
See Section 3.6 for details.
6.6 “Auto fit” menu item
This menu item is only accessible if you are using the “Theis type curve” method for evaluation.
See Section 3.6 for details.
GGU-PUMPTEST User Manual
Page 34 of 46
January 2001
7
“Test planning” menu
Here, you can simulate a pumping test using estimated values for permeability, etc. It is then
possible, based on the simulation results, to estimate the measurement precision required and the
time required for the pumping test.
The dialogue box for this menu item varies according to the selected evaluation method, e.g. the
time-drawdown method:
After confirming with “OK” the simulated values are displayed.
GGU-PUMPTEST User Manual
Page 35 of 46
January 2001
8
“Graphics preferences” menu
8.1 "Preferences" menu item
The dialogue box for this menu item varies according to the selected evaluation method. You can
define preferences for the graphical representation of the measured values. If the at-rest
groundwater level changes during the test (see Section 5.2), the level can be represented against
time together with the values. If the test evaluation includes a regression calculation, the
regression curve can also be represented. In addition, you can specify the units for the time axis
(hours, minutes, etc.).
8.2 “Refresh and zoom” menu item
If, for example after using the zoom function (see below), only part of the image is visible, you
can achieve a complete view using this menu item. The zoom factor may be user-defined. It is
much simpler, however, to get a complete overview using [ESC]. Using the [F2] key, you can
refresh the screen without altering the zoom factor.
8.3 “Zoom info” menu item
You will see information on activating the zoom function.
GGU-PUMPTEST User Manual
Page 36 of 46
January 2001
8.4 “Pen colour and width” menu item
By selecting the buttons on the left of the dialogue box you can edit the pen colours. Furthermore,
you can define pen widths.
8.5 “Legend font selection” menu item
With this menu item you can switch to a different True-type font. All available true-type fonts are
displayed in the dialogue box.
8.6 “Font size selection” menu item
By choosing this menu item you can edit the font sizes for use in the graphic.
8.7 “Mini-CAD toolbar” menu item
Using this menu item you can annotate the graphic at will and add lines and bitmaps. For details
please see the supplied “Mini-CAD” user-manual. A non-modal dialogue box opens, the functions
of which are further explained in the “Mini-CAD” user-manual.
GGU-PUMPTEST User Manual
Page 37 of 46
January 2001
8.8 "Toolbar preferences" menu item
When the program starts a toolbar appears at the top right of the program window.
By clicking on these tools you can directly reach most of the program functions. If you would
rather work with a horizontal popup window, you can specify your preferences using this menu
item. The Smarticons can also be switched off. The preferences will be saved, among others, in
the “PUMPTEST.alg” file (see menu item “Save preferences”), and will be active when the
program is started next.
8.9 "Save preferences" menu item
All data entered using the three previous menu items can be saved to a file. If you select GGUPUMPTEST.alg as file name, and save the file on the same level as the program, the data will be
automatically loaded the next time the program is started and need not be entered again.
8.10 “Load” menu item
You can reload a graphics preferences file into the program, which was saved using the “Save
graphics preferences” menu item. Only the corresponding data will be refreshed.
GGU-PUMPTEST User Manual
Page 38 of 46
January 2001
9
9.1
“Output preferences” menu
“Page size and margins” menu item
The graphic dimensions can be edited. The default sheet format is A4. If you need to use other
dimensions to the default you may have to alter the positions of the individual graphic elements
(see below).
9.2 “Margins” menu item
If the “With borders” switch is activated an additional border is drawn around the area defined in
the “Page size and margins” menu item. This may occasionally be undesirable, particularly when
printing on an A4 printer. With a little testing, the values for “Left margin” and “Lower margin”
allow you to position the graphic optimally for your printer.
GGU-PUMPTEST User Manual
Page 39 of 46
January 2001
9.3 "Texts" menu item
You can edit a wide range of texts for use in the graphic. You can change the graphic heading and
change “Report” to “Report no.”, for example.
By activating or deactivating the checkboxes for “Line 1”, etc., the corresponding lines are either
displayed or subdued in the graphic. The “Test data” text appears in the dialogue box in the menu
item “Edit / Test data”.
Only if entries are made here is anything entered in the table at the bottom of the graphic.
GGU-PUMPTEST User Manual
Page 40 of 46
January 2001
9.4 "Position info" menu item
The graphic consists of a total of 10 freely positionable elements. The size of almost all the
elements can also be modified.
The info box provides information on the positioning of the elements.
9.5 "Measured values" menu item
This refers to the graphic frame containing the representation of the test results.
You can alter the position of this element using the x and y values. The dx and dy values define
the width and height of the element. You can also specify a background colour. The default values
are recalled using the “Reset” button.
9.6 "Title" menu item
This refers to the graphic frame containing the representation of the diagram heading.
GGU-PUMPTEST User Manual
Page 41 of 46
January 2001
On the whole, the settings here correspond to the previous menu item. In addition, the title can be
subdued by deactivating the “Title display” checkbox. If you deactivate the “With outline”
checkbox, no frame will be drawn around the element. If you deactivate the “With background
colour” checkbox, the element will be transparent. The “Background col.” Button allows you to
select a different background colour for the element.
9.7 “Company” menu item
GGU mbH
Am Hafen 22
38112 Braunschweig
Tel.: 0531 / 312895
See Section 9.6 for details.
9.8 "Test no., etc." menu item
See Section 9.6 for details.
9.9 "Appendix and report" menu item
See Section 9.6 for details.
GGU-PUMPTEST User Manual
Page 42 of 46
January 2001
9.10 "Test data" menu item
Bezeichnung: Pegel 3b
Anzahl Brunnen = 3
Anzahl Messwerte: 59
Aquifer ist gespannt
Aquifermächtigkeit = 10.0 m
Pumprate = 2.66667E-2 m³/s
See Section 9.6 for details.
9.11 "Result texts" menu item
See Section 9.6 for details.
9.12 "Evaluation range" menu item
See Section 9.6 for details.
9.13 "System" menu item
Abstände r
H
3 Pegel
Brunnen
h
See Section 9.6 for details.
GGU-PUMPTEST User Manual
Page 43 of 46
January 2001
9.14 "Gauge" menu item
Pegel 3b (24 Werte / r = 23.00 m)
Pegel 6b (14 Werte / r = 139.60 m)
Pegel 11b (21 Werte / r = 7.40 m)
This menu item is only active in conjunction with the “distance-time-drawdown method”. This
element serves as a legend for the values from the individual wells. See Section 9.6 for details.
9.15 "Reset all graphics to defaults" menu item
Using this menu item you can reset all elements to their original values.
9.16 "Move elements" menu item
You can position all elements using the mouse. Go to this menu item. Move the mouse over the
element to be moved and press the left mouse button. Move the element with the left mouse button
pressed. If you move the mouse across one of the four boundaries you can also alter the height or
width with the mouse. If you move the mouse across one of the corners you can alter the height
and width simultaneously.
GGU-PUMPTEST User Manual
Page 44 of 46
January 2001
10 "?" menu
10.1
“Copyright” menu item
You will see a copyright message and the version number.
10.2 “Maxima” menu item
You will see the following information:
10.3 “Help” menu item
You will see this manual as a Windows Help file.
10.4 “GGU on the web” menu item
Using this menu item you can access the GGU Software website: www.ggu-software.com.
Keep in touch with new program versions and the regular “download” offers.
10.5 “What’s new ?” menu item
You will see information on program improvements and bug fixes in comparison to older
versions.
10.6 “Translation” menu item
In the international version of GGU-PUMPTEST, this menu item allows you to switch the menus
and the graphics from German to English and vice versa. To work in German, activate the two
switches “translate dialogs, menus” and “translate graphics”.
Alternatively, you can work bilingually, e.g. with German dialogue boxes but with graphic output
in English.
GGU-PUMPTEST User Manual
Page 45 of 46
January 2001
11
Index
A
L
Auto fit ...................................................... 24
AutoCAD .................................................. 27
Language, choice of ..................................45
M
C
MDSII .......................................................25
Choice of language...................................... 4
Clipboard................................................... 27
D
Datalogger................................................. 25
Depth-to-water values ................................. 5
Displacement factors................................. 24
Displacement to type curve ....................... 23
Distance-drawdown method........................ 9
Distance-time-drawdown method ............. 12
E
Edit values................................................. 28
Evaluation range ....................................... 30
Examples..................................................... 5
F
Font sizes .................................................. 37
O
Output........................................................26
P
Printer........................................................26
R
Recovery method ......................................17
Representation range.................................30
Roughen values .........................................30
T
Theoretical principles..................................5
Time-drawdown method .............................6
Title ...........................................................41
Translation ............................................4, 45
Type curve method....................................20
G
GGUCAD ................................................. 27
W
WINDOWS conventions...........................26
H
Hand fit ..................................................... 23
GGU-PUMPTEST User Manual
Page 46 of 46
January 2001