1
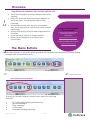
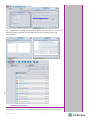
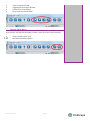
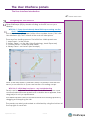
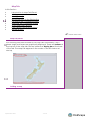
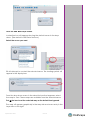
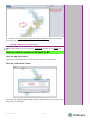
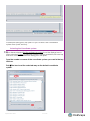
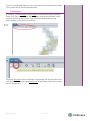
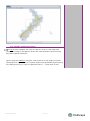
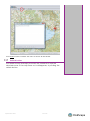
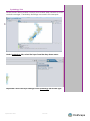
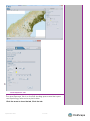
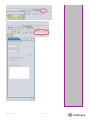
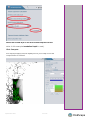
UI GUIDE FOR RISKSCAPE RiskScape is a joint GNS and NIWA project to develop a natural hazard impact and risk modelling tool for New Zealand. http://riskscape.org.nz/ This guide is aimed at new users of RiskScape and provides an introduction to the User Interface (UI) of RiskScape. This guide follows on from the Quick Start guide. You can work through this guide at your own pace once you have successfully installed RiskScape onto your PC. Contents Overview ......................................................................................................................................................................... 2 Key differences between this version and the last. ........................................................................................ 2 The Menu Buttons .......................................................................................................................................................... 2 The General Feature Buttons ............................................................................................................................. 2 Module Builder Menu .......................................................................................................................................... 3 Module Editor Menu ............................................................................................................................................ 4 The User Interface panels............................................................................................................................................. 5 The User Interface Introduction .......................................................................................................................... 5 Navigating the User Interface ........................................................................................................................... 5 Map Tab .................................................................................................................................................................. 7 Map Tab/Panel ..................................................................................................................................................... 7 Adding a map ...................................................................................................................................................... 7 Adding a Shapefile or other Layer ................................................................................................................... 9 Show/ Hide information on the display bar. ................................................................................................. 10 Changing the Coordinate system .................................................................................................................. 10 Selecting the Coordinate system .................................................................................................................... 11 Zoom buttons ...................................................................................................................................................... 12 Pan, Identify and Extent buttons ..................................................................................................................... 13 Refresh button .................................................................................................................................................... 14 The Layer, Symbology and Asset Exposure Tabs ........................................................................................... 15 layer Tab .............................................................................................................................................................. 15 Symbology Tab ................................................................................................................................................... 16 Asset Exposure Tab ............................................................................................................................................ 17 Analysis and Library Tabs ................................................................................................................................... 19 The Analysis Tab .................................................................................................................................................. 19 The Library Tab .................................................................................................................................................... 19 The Console Tab .................................................................................................................................................. 19 The Console ......................................................................................................................................................... 19 Layer, Symbology and Asset Exposure Tab Example ................................................................................... 20 Example using the Library, Layer, Symbology and Asset Exposure Tabs - Viewing Exposed Assets After a Risk Analysis ..................................................................................................................................................... 20 September 2015 1 of 22 Overview Key differences between this version and the last. The UI has changed and looks different from older versions Built-in RS tools and quick link buttons appear on the main menu, including help and module manager. The module builder tools are now accessable from the UI (in previous versions they were loaded seperately). Styling and viewing of layers and maps based on Geotools More user input/choice in display options Better visual integration of modules and functionality If you get stuck the RiskScape team are available: For more information about RiskScape software or installation [email protected] For general RiskScape enquires [email protected] The Menu Buttons The three sections on the Menu Buttons toolbar are General Features (yellow), Module Builder (orange) and Module Editor (red) The General Feature Buttons The buttons on the General Features menu open the following features: RS Configuration Dialog (Preferences) Module Manager Filter Manager Online Help Helpdesk and Bug reporting September 2015 2 of 22 Please make notes RS Configuration Dialog (Preferences) gives the user options to view or alter the proxy settings along with Resources, Licensing and Log Information Module Builder Menu The buttons on the Module Builder menu open the following features: September 2015 3 of 22 Asset Module Builder Aggregation Module Builder Hazard Module Builder Resource Module Builder Module Editor Menu The buttons on the Module Editor menu open the following features: Asset Modification Tool Module Metadata Editor September 2015 4 of 22 The User Interface panels The User Interface Introduction Navigating the User Interface Open RiskScape (RS) by double clicking on the RS icon on your desktop Wiki link 1. If you do not already have RiskScape running see the Quick Start Guide. The screen below will appear (without the numbers shown). This is the User Interface (UI). This is where all the work will take place. There are four docking spaces. The initial four visible panels are: 1. Map Panel – in the centre 2. Layers, Panel – on the right (also Symbology, Asset Exposures) 3. Console Panel – under the Map Panel 4. Library Panel – on the left (also Analysis) Note: If the map doesn’t load then there is a problem with the LINZ server (or connection to it) see next section on loading a map. Wiki link 2. Initial Map Load error - see troubleshooting Panels can be adjusted to suit the user. To do this, hover your curser over the border between panels until a double arrow appears, then drag/adjust to suit your preference. The tabbed panels can be moved between the docking spaces by dragging and dropping the tab. The panels can also be relocated or minimised by using the buttons at the top right of each Tab. September 2015 5 of 22 Please make notes When minimised, the panel will show up at top left under the main tool bar. Some tabs are closable (these will have an X on the tab to close), others are not closable and can only be minimised. DESCRIBE TABS IN USER MANUAL MOVE TO TROUBLE SHOOTING The user will have to select map again from the add WMS layer button and accept the default (which is the LINZ layer) ERROR MESSAGES IN CONSOLE PANEL AND COORDINATE SYSTEMS September 2015 6 of 22 Map Tab In this Section Introduction to Map Tab/Panel Adding a Map Adding a Layer Show/Hide info on the Display Bar Changing the Coordinate system Selecting the Coordinate System Zoom and Extent Buttons Pan, Identify and Extent buttons Refresh button Map Tab/Panel The following instructions relate to the map Tab functionality. This is where Maps and layers are graphically displayed. There are buttons at the top left of the Map tab and an interactive display bar at the base of the tab. The Map tab appears in the centre of the RS window at start up Adding a map September 2015 7 of 22 Please make notes Click the Add WMS Layer button. A selection box will appear showing the default server in the drop down. (The default is LINZ Data Services). Select the server you want. RS will attempt to contact the selected server. The loading symbol will appear in the display bar. From the drop down menu in the selection box that appears, select the map to view. These maps are available from the selected server. Tick the box to set the selected map as the default background. The map will appear graphically in the Map tab and as an entry in the Layer tab on the right. September 2015 8 of 22 The section on Symbology, Layer and Asset Exposure tabs will illustrate the ways you can change the view of the map layer. Adding a Shapefile or other Layer Add a .shp layer from file using the add layer button on the Map tab. TABLE OF TYPES OF LAYERS ACCEPTABLE TO RS Click the Add Layer button. Select the .shp shapefile to load from the selection dialog box. Click the “Select a File” button The layer will appear graphically in the Map tab and as an entry in the Layer tab on the right September 2015 9 of 22 NOTE: Remember when loading JPG georeferenced files that there must be a jpgw (world file) in the same location and with the same name for RiskScape to use to locate the file. Also true for PNG and TIFF. The section on Symbology, Layer and Asset Exposure tabs will illustrate the ways you can change the view of the layer. Show/ Hide information on the display bar. The display bar shows information about the Coordinates of the cursor position, the Extent of the data, and the coordinate system (CRS). Tick to show or untick to hide these features on the Display Bar. Use Set number decimal digits to change the length of the numbers displayed. Changing the Coordinate system Use the button EPSG… at the bottom right of the Map tab to select “Set the reference system…” option September 2015 10 of 22 A selection Dialog box will open for you to select the coordinate system from (next section). Selecting the Coordinate system If you have selected Set the reference system from the display bar or have selected Other coordinate systems during Installation/first start up then the coordinate selection dialog box will open. Type the number or name of the coordinate system you want in the top text box. Tick the box to set the selected map as the default coordinate system. September 2015 11 of 22 The two coordinate systems most often used for NZ are 27200 NZ Map Grid, and 2193 NZ Transverse Mercator. Zoom buttons A close up of the Buttons on the Map Tab shows the Select, Zoom In, Zoom Out, Pan, Identify, Full Extent, Add Layer and Add WMS Layer buttons. Hovering the mouse over a button reveals the tool tip (information on the button function). Click the Zoom In button and draw a rectangle. RS will zoom the view to fit the box. After selecting Zoom out, single clicks widen the view by about 50 percent. September 2015 12 of 22 Pan, Identify and Extent buttons The Pan button enables the user to hold left click on the map and move the image in the panel. When the user releases the left mouse key the image is released. When using the Identify function, click a point on the map to reveal information in a pop up box. Further options are available as buttons in this dialog box (e.g. Copy to clipboard, Save…, Clear and Close). September 2015 13 of 22 The Extent button widens the view to show all the data. Refresh button The refresh button attempts to restore the connection with the selected server. If the map times out or disappears, try clicking the refresh button. September 2015 14 of 22 The Layer, Symbology and Asset Exposure Tabs layer Tab The Layer tab is located at the right of the RS Window. Beside the layer name are the icons for Visibility and Selection. These can be toggled on or off. The Remove Layer icon will delete the layer. View Table displays the fields and data for the layer. Click on the table icon to bring up the attributes table in the bottom docking area. September 2015 15 of 22 Please make notes Symbology Tab Download an Asset module. Preview the module and minimise or close module manager. Canterbury buildings was used in this example Under Symbology tab, select the layer form the drop down menu Adjust the colour and style settings in the Symbology tab on the right September 2015 16 of 22 Asset Exposure Tab The Asset Exposure Tab is on the RHS docking space near the Layers and Symbology Tabs and may be hidden. Click the arrow to show the tab, Click the tab. September 2015 17 of 22 September 2015 18 of 22 Analysis and Library Tabs Please make notes Please make notes The Analysis Tab The Library Tab The Console Tab The Console The console tab at the bottom of the RS window displays process messages and errors. September 2015 19 of 22 Layer, Symbology and Asset Exposure Tab Example Example using the Library, Layer, Symbology and Asset Exposure Tabs - Viewing Exposed Assets After a Risk Analysis This example can be completed after an analysis has been run. See tutorial 1 to run an analysis View the assets used in the analysis (from the Library Tab) View the results of the hazard model (from the Library Tab) The assets and hazard model used in the run will appear in the Layers tab. Click on the Symbology tab. September 2015 20 of 22 Please make notes In the Select Layer field, click on the assets used in your analysis run Note: In this example the Hawke’s Bay Buildings NZMG is the asset layer. Click on Construction Type in the Select Attribute field, Click Apply. The assets will be displayed on your map by type, distinguished using the legend/colour-bar. Click on the Asset Exposures tab. Select the asset layer in the associated dropdown menu Note: in this example the Hawke’s Bay Buildings NZNG is the asset layer. September 2015 21 of 22 Select the hazard layer in the associated dropdown menu Note: in this example Inundation Depth is used). Click Compute. The exposed assets will be displayed on your map once the computation is finished. September 2015 22 of 22