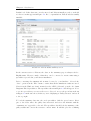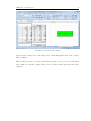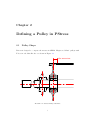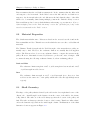
1
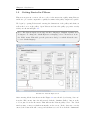
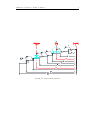
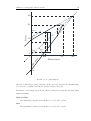
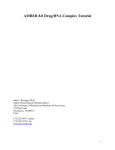
PStress R Pulley Stress Analysis Software Users Manual* Issued: October 29, 2013 *For PStress V3.2.3 CONVEYOR DYNAMICS, INC. 1111 West Holly St. Bellingham, WA, 98225 (USA) Phone: +1 (360) 671-2200 Contents Contents i Symbols ii 1 Introduction 1.1 What is Pstress? . . . . . . . . . . . . . . . . . . . . . . . . . . . . . . . . 1.2 Getting Started in PStress . . . . . . . . . . . . . . . . . . . . . . . . . . . 1 1 2 2 Defining a Pulley in PStress 2.1 Pulley Shape . . . . . . . . . . . . . . . . . . . . . . . . . . . . . . . . . . 2.2 Material Properties . . . . . . . . . . . . . . . . . . . . . . . . . . . . . . . 2.3 Shaft Geometry . . . . . . . . . . . . . . . . . . . . . . . . . . . . . . . . . 5 5 6 6 3 Interpreting PStress Results 3.1 PStress Output Summary . . . . . . . . . . . . . . . . . . . . . . . . . . . 3.2 Fatigue Analysis using a Goodman Diagram . . . . . . . . . . . . . . . . . 8 8 9 i Symbols σr Stress in Radial Direction (MPa) σp Stress in Tangential Direction (MPa) σx Stress in Axial Direction (MPa) τ Shear Stress (MPa) Su Ultimate Tensile Strength (MPa) Sy Yield Strength (MPa) Se Endurance Limit Strength (MPa) ii Chapter 1 Introduction 1.1 What is Pstress? PStress is a proprietary program developed at CDI. The first version was created in 1984. This version used a closed-form analytical method to solve for the stresses in a pulley. The program was based on the work of H. Lange (1963) and W. Schmoltzi (1974). In 1993 CDI expanded the number of shapes PStress could model by added a relatively small number of finite elements to the pulley simulation. This allowed us to preserve the speed of the close-form analytical analysis, while adding the ability to model complex geometries. Xiangjun Qiu and Vinit Sethi published CDI’s new simulation method (and comparisons between our method and full ANSYS simulations) in a paper titled A New Pulley Stress Analysis Method Based on Modified Transfer Matrix. This paper appeared in Bulk Solids Handling volume 13, issue 4. PStress V3.2.3 calculates stresses that can be used for fatigue analysis at various locations that are provided as inputs to the program. Two Fourier approximations are used to describe the loading on the pulley. One Fourier series is used to describe the loading in the tangential direction while a second Fourier series is used to approximate the loading distribution in the axial direction. The advantages of this program include its ease of use coupled with a short execution time, making it a valuable design tool which allows the designer to review the effect of a design change on the stress distribution in a short period of time. 1 Chapter 1. Introduction 1.2 2 Getting Started in PStress This section gives an overview of how to solve for the stresses in a pulley using PStress, and how to process the output file to quickly determine if the pulley design is acceptable. We begin by opening PStress and entering the dimensions of the pulley and shaft, as well as the forces on the pulley. Open PStress and enter the pulley properties exactly as they are shown in Figure 1.1. Note: The PStress input screen supports three languages– English, Spanish, and Portuguese. To change the default input screen language, select “Preferences” from the “Edit” menu. This will open the preferences dialog box which allows the user to set a default language. Figure 1.1: PStress Input Screen After entering all the data shown in the Figure 1.1 save the file by selecting ”Save as” from the “File” menu. Once the file is saved click the “Simulate Pulley” button on the tool bar just below the file menu. This will run the PStress pulley solver. Two black windows may or may not flash momentarily on the screen. If the data was correctly entered, the solution should converge in less than a second. Now click the “Summarize Chapter 1. Introduction 3 Results” tab. If the data was correctly entered, and PStress install properly, you should see the screen that appears in Figure 1.2. If so, congratulations, PStress was successfully installed. Figure 1.2: PStress Results Summary Screen In the current version of PStress, the data on the summary page is always scaled to English units. However, much of this sheet can be converted to metric units using a spreadsheet provided in your PStress installation. Before converting the summary file it must be saved to your hardrive. Selected the “Save” option from the “File” menu to ensure that all the simulation results are saved. Next, from the Windows “Start” menu select the “CDI” folder and open the “Goodman Diagrams” Excel spreadsheet. The spreadsheet shown in Figure 1.3 should appear. Note: to use this spreadsheet you must enable macros. If you do not see the green button shown in Figure 1.3 make sure the work sheet you are displaying is “Pulley Stresses” and scroll to the top right. To load the summary data into the excel spreadsheet click the green button. Navigate to the folder where the pulley data was saved and select the filename with the “-summary.out” appended to the end. The speadsheet should load the summary of the pulley results and convert the stresses to metric units. It will also plot the oscillating Chapter 1. Introduction 4 Figure 1.3: PStress Postprocessing stresses in the critical area of the pulley in Goodman Diagrams found on the “Pulley GD” worksheet. This concludes our brief overview of the PStress software. A deeper review of the input data required by and the output data produced by this software appears in successive chapters. Chapter 2 Defining a Pulley in PStress 2.1 Pulley Shape PStress is designed to compute the stresses in CEMA “Engineered Class” pulleys with T-Section end disks like the one shown in Figure 2.1 Dist. Weld to Disk Figure 2.1: PStress Pulley Schematic 5 Chapter 2. Defining a Pulley in PStress 6 PStress assumes that the end disk is symmetrical. It also assumes that the fillet radii end tangent to the horizontal. If the fillet between the hub and the end disk is not tangent to the horizontal where the end disk meets the hub than the shape of the fillet will need to be manually defined using multiple points in the “Disk Geometry” section. PStress will interpolate between disk thickness values using a power function. Note: to define multiple points in the “Disk Geometry” section the “# Radial pts (<10)” value must be incremented in the “Disk” section. 2.2 Material Properties The default materials known to PStress are listed in the materials.txt file found in the PStress installation folder. This file is a text file which the user can edit to add additional materials. The Ultimate Tensile Stength and the Yield Strength of the materials in a pulley are usually easy to find. However, the endurance limit is not usually listed in suppliers tables. The PStress solver does not use endurance limit to compute the stresses in the pulley. However, this number is used by PStress to predict the onset of fatigue. CDI recommends using the following endurance limits, Se , when evaluating pulleys: Disk and Hub The endurance limit strength is ±24% of yield strength in base metal and ±18% of yield strength in welded zones. Rim The endurance limit strength is ±15% of yield strength (note, there is a butt weld across the entire face of the pulley which will rotate through all high stress regions). 2.3 Shaft Geometry The shape of the pulley shaft is defined by the table in the lower right hand corner of the “Input” tab. “Axial Length” is the distance from the center of the shell to the feature being defined. The 4th row of the table always specifies the location of the pulley end disk. The 8th row always specifies the location of the bearing. Turndown “fillet radius” end at the dimension specified in the axial length column. An illustration of the shaft dimension locations appears in Figure 2.2. Chapter 2. Defining a Pulley in PStress Figure 2.2: PStress Shaft Schematic 7 Chapter 3 Interpreting PStress Results 3.1 PStress Output Summary The PStress output summary contains the following results of the pulley stress analysis: 1. Input Specifications 2. Output Specifications (a) Wrap Angle (b) Total Bear Load (c) Total Torque (d) Bending Moment (e) Locking Device Slip Check (f) Stiffness of the various pulley components 3. For each End Disk, Hub, Locking Device, Rim, Rim (center), Disk-Rim Weld: (a) Max Stresses (b) Von Mises Yield Ratio (c) Max Shear Stresses (d) Tresca Yield Ratio (e) Principal Stresses (f) Locations of largest range of principle stresses, and the max and min stress at these locations (used in fatigue analysis) 4. Shaft (at each of the 11 locations specified in the input file): 8 Chapter 3. Interpreting PStress Results 9 (a) Bending Moment (b) Torque (c) Transverse Force (d) Bending Stress (e) Shear Stress (f) Transverse Shear (g) Max Shear (h) Max Von-Mises Stress The stresses are tabulated for both sides of the pulley component surfaces. In PStress the “Inside” column refers to the interior of the pulley, and the “Outside” column refers to the exterior of the pulley. In the summary file, the following nomenclature is used: SIGMAR: Radial stresses SIGMAP: Tangtial stresses SIGMAZ: Axial stress TAURP: Shear stress (hub, Disk, locking device) TAUZP: Shear stress (Rim) 3.2 Fatigue Analysis using a Goodman Diagram As the pulley rotates, the rim and the disk are subject to fluactuating stresses which can cause high-cycle fatigue failure in these parts. The Goodman diagram is used to determine is the various parts of the pulley will fatigue to failure. This diagram is shown in Figure 3.1. To use this diagram we define the following parameters: σmin = minimum stress σmax = maximum stress σa = stress amplitude = (σmax − σmin )/2 σm = stress mean = (σmax + σmin )/2 The Goodman Diagram shows all the strengths and limiting values of the stress components for a particular mean stress. Failure is defined by the heavy outline. The endurance limit strength, Se , is the point at which fatigue failure will not occur regardless of the number of cycles of loading applied to the part. The value of Se is a Chapter 3. Interpreting PStress Results 10 Su Sy r a Se x Ma ss e r . st a Stress max 45° min 0 Sy Su Mean stress Mi n. str ess m Se Figure 3.1: Goodman Diagram function of material properties (discussed in the previous chapter), the manufacturing processes, the operating environment, and the design of the part. In addition to the fatigue stress checks, CDI recommends adopting the following maximum stress limits: Disk and Hub The maximum combined stress should not exceed 70% of yield. Rim The maximum combined stress should not exceed 50% of yield.