1
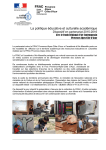
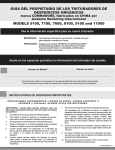
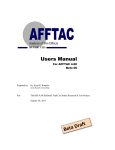
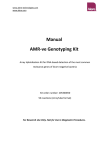
V. VOJTA et al., Development and Verification of the Control System for Fed-Batch, Chem. Biochem. Eng. Q. 16 (2) 59–67 (2002) 59 Development and Verification of the Control System for Fed-Batch Phenol Degradation Processes V. Vojta+, J. Náhlík, J. Páca*, and E. Komárková* Department of Computing and Control Engineering, *Department of Fermentation Chemistry and Bioengineering, Institute of Chemical Technology, Prague, Technická 5, 166 28 Prague 6, Czech Republic + E-mail: [email protected] Original scientific paper Received: September 15, 2001 Accepted: February 8, 2002 The structure of a control system for the control of the fed-batch phenol degradation is described. In the software environment of MFCS/win and MS Excel, a control strategy for phenol dosing on basis of measuring the saturation of the medium by dissolved oxygen, was designed. This strategy is able to prevent the substrate inhibition and to keep the biodegradation process in operation as long as possible. In addition, it enables the operator to change important parameters such as the amount of the dose of carbon and energy source and the control level of dissolved oxygen during the cell cultivation. The program was experimentally verified under conditions of oxygen excess and oxygen limitation in fed-batch cultivations of the yeast Candida tropicalis. A correlation between the phenol degradation rate and the amount of phenol dose was especially studied. The system is commonly used at Department of Fermentation Chemistry and Bioengineering (ICT, Prague). Keywords: Control strategy, aerobic degradation, fed-batch, Candida tropicalis, phenol. Introduction In the twentieth century phenol pollutes the environment considerably. It is present in many kinds of industrial waste, from which it is eliminated by expensive but often ineffective physical or chemical methods. A biodegradation has been studied as a possible alternativ, due to relatively low expenses and complete xenobiotic mineralization. On the other hand it is nonapplicable to solve the cases with high contamination level. Many scientists deal with phenol biodegradation. Ruiz-Ordaz et al.1 showed in his study that Candida tropicalis has high allowance against phenol. They show that growth of yeast can be inhibited by phenol, or it can even cause break-up of cells or their parts. Lallai and Mura2 also deal with inhibition and inhibition models of phenol degradation process. They state that it is necessary to consider temporary biomass growth on reactor walls while modeling. Wang and Loh3 point out in his research, significance of metabolic intermediates in kinetics of phenol biodegradation. They demonstrate that intermediates play a critical role in modeling of these processes. Many researchers also deal with immobilized systems. The advantage of immobilized cells is that they are not washed out from the reactor and it was proved that immobilized cells degrade phenol better at dilution rate D > 0.3 h–1.4 Most scientists are engaged in batch or continuous phenol biodegradation. This study belongs to the one that deals with fed-batch phenol biodegradation.5,6 Brack et al.7 treat, especially, models and optimal control of fed-batch reactors for phenol biodegradation. Other research workers come up with another ways of the control, e.g. Léonard et al.8 laid hold of the fact that semialdehyde of 2-hydroxymuconic acid (the main intermediate of phenol biodegradation) colors the medium yellow. The production of this dye directly correlates with the biodegradation rate. This relation between the change of the color and metabolic activity was used to propose the control strategy for optimal phenol degradation. The PI controller was applied to maintain stable concentration of phenol in the reactor at setpoint 0.1 g l–1 (it corresponds with specific growth rate of 0.3 h–1). Schröder et al.9 used CO2 concentration in exhaust gases as controlled variable, and dilution rate as manipulated variable, to control this process. Hughes and Cooper10 deal with self-cycling fermentation processes. They put to use values of fraction media saturation by oxygen, which was continually monitored, to control this bioprocess. The next cycle always began after complete utilization of phenol in the previous cycle. This state was distinguished just from the course of medium satu- 60 V. VOJTA et al., Development and Verification of the Control System for Fed-Batch, Chem. Biochem. Eng. Q. 16 (2) 59–67 (2002) ration by oxygen. At this moment one half of reactor content was changed by fresh medium. This work deals with implementation of a suitable method for the fed-batch phenol biodegradation. The goal was to create a user-friendly and widely applicable control system that allows controlling the fed-batch phenol degradation in a way that it prevents the substrate inhibition. The proposed control strategy is based on dosing of phenol according to on-line measurements of dissolved oxygen tension in the medium. The main idea of this strategy can be described as follows. When the phenol dose is added, the cells start to utilize it as carbon source, they respire and wO2 decreases. Subsequent increase of wO2 indicates total substrate depletion, so the conditions for addition of the next dose, are fulfilled. For this phenol fed-batch biodegradation control strategy a control program was developed and implemented in MFCS/win software package. Because the user interface of the MFCS/win program version 1.1 that was used, does not allow the operator easily to change the parameters in the program during the experiment, another cooperating application was designed in MS Excel, that allows changes of the important parameters in MFCS/win, during the experiments from new user displays. These parameters are for example the amount of substrate dose and the level of oxygen when the next substrate dose is added. The control system was experimentally verified under conditions of excess and limitation of oxygen in phenol fed-batch degradation by the yeast Candida tropicalis. Furthermore, correlation between the rate of phenol biodegradation and the amount of dose was studied. In this paper the control system, which was developed for this purpose, will be described, followed by the results achieved in testing experiments. Materials and methods Microorganisms, medium and culture conditions In the experiments the yeast Candida tropicalis Ct2 from the biodegradation laboratory collection of prof. Páca (Department of Fermentation Chemistry and Bioengineering, Institute of Chemical Technology, Prague) was used. The yeast was isolated from the soil contaminated by phenol substances. The cells were subsequently long-range adapted to higher phenol concentrations. The inoculum was prepared in two steps by cultivation in YNB medium with glucose and phenol (YNB base 1.7 g l–1, (NH4)2SO4 5 g l–1, KH2PO4 1 g l–1, MgSO4 0.5 g l–1, NaCl 0.1 g l–1, solution of amino acid 1 ml l–1, glucose 4 g l–1, phenol 350 mg l–1). The cultivation proceeded in Erlenmeyer flasks (500 ml – 100 ml of medium) on shakers at the temperature of 30 °C. The first cultivation was inoculated by resting cells from an agar solid medium and proceeded 36 hours. This cell suspension was used for inoculation of twelve Erlenmeyer flasks containing the same medium. The second cultivation proceeded 24 hours only. The biomass was centrifuged and washed by sterile water. For the fed-batch experiments the BSM medium was used, the composition of which is: KH2PO4 (4.30 g l–1), K2HPO4 (3.40 g l–1), (NH4)2SO4 (2.00 g l–1), MgCl2 · 6 H2O (0.34 g l–1); plus trace elements (1 ml l–1): FeSO4 · 7 H2O (0.5 mg l–1), ZnSO4 · 7 H2O (0.5 mg l–1), MnSO4 · 7 H2O (0.1 mg l–1), CuSO4 · 5 H2O (0.1 mg l–1), CoCl2 · 6 H2O (0.1 mg l–1), NaBO2 (0.1 mg l–1), Na6Mo2O7 (0.1 mg l–1). Conditions during the experiments The threshold level of pwO2 for the substrate dosing was set to 90 %. The initial volume of the medium was 1.5 l. The temperature was kept at 30 °C and pH value at 5.2. The aeration was 0.5 and 1 L–1 min–1 and the stirrer speeds were 400, 600 and 800 min–1. The mass concentration of phenol water solution was 50 g l–1. The doses of phenol were 0.4, 1.33, 1.8, 2.4, 3, 3.6, 4 and 4.2 ml. The NaOH solution for pH value control had the concentration 0.1 mol l–1. Note: The doses of phenol were so small so that the substrate inhibition would not occur. Measurement and control system The control system (Fig. 1) consists of the digital control unit Micro-DCU 300, controlling a 2-litre bioreactor Biostat 2A (B. Braun Biotech International), and the personal computer with processor AMD K6-2/266 MHz and 64 MB of operation memory. Both parts are connected through a serial interface RS-422. Micro-DCU 300 provides standard functions such as temperature and pH measurement and control, stirring and dosing. The control software MFCS/win (Multi-Fermenter Control System for Windows NT) is installed on the PC in Windows NT 4.0 Workstation operating system environment. It is a 32-bit Windows application, which can exchange data with other Windows applications using Dynamic Data Exchange (DDE) protocol.12 This software is used together with MS Excel program for the automatic bioprocess control. The fermenter was equipped with a combined pH electrode, the oxygen electrode Mettler Toledo, the temperature resistance sensor Pt100, and the V. VOJTA et al., Development and Verification of the Control System for Fed-Batch, Chem. Biochem. Eng. Q. 16 (2) 59–67 (2002) 61 Results The control strategy and requirements for the control program F i g . 1 Measurement and control system stirrer. Two peristaltic pumps for dosing the NaOH and phenol dilutions into the fermenter, were installed. A hollow needle and a plastic hypodermic needle guaranteed the sampling. Heating was provided by external heating wrapper, cooling by the flow of water through the inner construction. The airflow was measured by means of the flow meter and set manually. The oxygen electrode was calibrated by means of the sulfite dilution (wO2 = 0) and the level of oxygen saturation in the fermenter under the aeration conditions of the cultivation, was set up. Considering the formation of the acid intermediates during the cultivation, the pH value was controlled by the addition of NaOH solution only according to the signal of the pH electrode. The biomass concentration was determined by a gravimetric method and a photometric method by the analyzer Spekol 11 (Carl Zeiss, Germany), measuring the absorption of diluted cell suspension at the wavelength 500 nm. The probes (thermometer, pH electrode, wO2 electrode) in the fermenter are connected to Micro-DCU 300, and through this unit their signals are consecutively monitored on the user displays in system MFCS/win and in MS Excel on PC monitor, and archived in memory files. Software MFCS/win 1.1, which is installed on the control computer, controls through Micro-DCU 300 the pumps of substrate and base, and sends setpoint values of temperature, pH and stirrer speed into this unit.11 The proposed control strategy is based on on-line measurements of dissolved oxygen tension in the medium and works as follows. The yeast is in the bioreactor without phenol in the beginning and so it does not have a source of carbon and energy, does not grow and does not consume oxygen. The saturation of media by oxygen wO2/% is increasing to 100 %. Next, the first phenol dose is added, the cells start to utilize it, they respire and wO2 decreases. Subsequent increase of wO2 indicates full substrate depletion and so the possibility for adding its next dose. The manner of dosing is shown in figure 2. In this particular example the level of wO2, at which the next dose of substrate was added, was set on 80 %. In case of exceeding this level, the phenol dose was added, which caused decrease of wO2 to approximately 30 %. After utilizing the substrate, dose wO2 started to increase again, and the whole cycle was repeated. The advantage of this manner of dosing is in the easy determination of the moment before the next dose, when the concentration of phenol in the reactor is zero. Since the next phenol dose of an appropriate size is added just upon the previous one is completely consumed by the yeast, this strategy prevents the substrate inhibition. F i g . 2 The course of dissolved oxygen during the control The automatic dosing of substrate is therefore the main requirement for the control program, which has to guarantee that the next dose is added just upon the previous one is completely utilized. The operator must be able also to change process control parameters simply, such as the control of wO2 level, when the next substrate dose is added, and the quantity of individual dose. Another required function ensures that the user can simply switch off and switch on the automatic quantitatively constant substrate dosing, and in the meantime he can add through the user’s interface several doses of various amounts according to his own consideration. 62 V. VOJTA et al., Development and Verification of the Control System for Fed-Batch, Chem. Biochem. Eng. Q. 16 (2) 59–67 (2002) Implementation of the program in MFCS/win To eliminate the substrate inhibition, it was necessary to apply the sequential control approach in the program, because phenol dosing, according to the requirements above mentioned, required differentiation of several states within the dosing cycle. The sequential dosing cycle (depicted as sequential diagram in Fig. 3) runs over always with every next substrate dose. After adding the first phenol dose, wO2 decreases and then increases after depletion of substrate again. Exceeding of the adjusted wO2 level shows that all phenol was consumed, and the cycle comes to the state 1 again etc. This ensures that phenol does not accumulate in the medium, and therefore substrate inhibition does not occur. F i g . 3 Sequential diagram States description: – S1: the program comes to the state S1 in the beginning automatically (starting state) – S2: S2 takes on when the operator enables to add the next dose automatically – S3: S3 is the so called dosing state; it is active in the time when substrate is added – S4: after the end of the dose, the cycle comes to the state S4. The cycle waits in the state S4 up to saturation by oxygen decreases bellow 88 % (generally wO2 control level minus 2 %). Then it comes to the state S1. In this manner, it is ensured that the program does not respond to momentary overshoot around the 90% level, but it waits for a real fall un- der 90 % (wO2 level, that was used during the real experiments). The control strategy described above was realized by the program in MFCS/win system. The program was written by defining on-line calculations, which are calculated every 5 seconds, and their results are stored to the controller variables and the cyclic variables. Every 5 seconds, the program in MFCS/win sends the control signal to the pump if to dose or not. The upgrade of the control program in MS Excel Unfortunately the user interface of program MFCS/win in version 1.1 does not allow the operator to change parameters of the control program easily, but this function is essential during the experiments. These changes can be performed from MS Excel application cooperating with MFCS/win by means of DDE communication. Since the communication is a two-way kind, it is not only possible to operate the control system, but also to display actual and historical values on the displays in MS Excel according to the specific requirements. Therefore the next goal was to create a suitable user interface for the simple and intuitive work with this program. For cooperation of both the programs it is necessary, while creating the input variables in the MFCS/win, to determine from which cell and from which file of MS Excel will be its value acquired. All measured variables (pH value, wO2, stirrer speed, temperature, amount of added phenol and NaOH) and the cultivation time are sent from MFCS/win to MS Excel. The operator commands are sent in the opposite direction. The commands can be: switch on or off of the automatic dosing, change the control level of dissolved oxygen, change the amount of phenol dose, and finally the manual dosing (Fig. 4). Moreover, in MS Excel environment the operator can monitor the actual state of all measured variables, the cultivation and real time on the historical file display, (Fig. 5) and a graphical display. He is able to choose any group of the displayed variables and set their logging periods. (The system MFCS/win creates its own historical file and measured variables are stored every minute there. The variables and the interval can be set only prior to the beginning of the experiment.) Next, the user is allowed to choose the variables, which will be in the graph plotted against cultivation time. Finally, the operator can choose an appropriate time span for the display of data. One of the choices is to draw all recorded data, the next allows to comprehend to the graph the certain number of the last V. VOJTA et al., Development and Verification of the Control System for Fed-Batch, Chem. Biochem. Eng. Q. 16 (2) 59–67 (2002) F i g . 4 Control display for operation of the control application F i g . 5 Historical file display 63 64 V. VOJTA et al., Development and Verification of the Control System for Fed-Batch, Chem. Biochem. Eng. Q. 16 (2) 59–67 (2002) values only, and the last choice is to display data from the selected past time interval. The course of the variables is drawn after activation of the list that names Graph. This graphical interface enables to the operator to operate the cultivation only through the displays in the created MS Excel application. The experiments Several experiments of phenol fed-batch degradation by the yeast Candida tropicalis were carried out. Besides testing the software control system the aim was to study the influence of the amount of phenol dose on the degradation rate in BSM medium. Here we will describe two experiments. The first cultivation was carried out under the conditions of oxygen limitation, while the second one under the conditions of oxygen in excess. Both experiments ran approximately 50 hours and the level of the dissolved oxygen, at which the next substrate dose was automatically added, was set to 90 %. The measured variables were stored every minute to the memory file. These variables were as follows: total amount of added phenol, total amount of added NaOH, saturation of the medium by dissolved oxygen, temperature, pH value and stirrer speed. F i g . 6 The course of dissolved oxygen T a b l e 1 Conditions of the experiment 1 Stirrer speed 400 min–1 Aeration 0.5 L L–1 min–1 Concentration of phenol water 50 g l–1 The amount of degraded phenol 15.21 g (161.81 mmol) Initial solid 1.1 g l–1 Final solid 3 g l–1 Cultivation No. 1 The goal of this cultivation was to examine the dependence of the specific phenol degradation rate on the quantity of the individual doses under the conditions of oxygen limitation. That is why we added so high phenol doses so that the saturation by the oxygen during the degradation always decreased close to zero or to zero. The effect of the gradually lowering substrate doses was investigated. In the beginning the 3 ml phenol dose was selected. It ensured the concentration of phenol in the fermenter immediately after the dose to be equal to 100 mg l–1. Because phenol is fully consumed by the yeast before the next dose, the 100 mg l–1 concentration will never be exceeded. In this way the dosing does not cause the substrate inhibition. The saturation by oxygen decreased to 0 %, progressively, and that is why the F i g . 7 Specific consumption rate of phenol (dotted line) and the calculated concentration of phenol in the reactor after the dose (solid lines) following doses could be reduced to 2.4 ml of phenol. That caused the resultant concentration equal to 71.7 mg l–1 after the dose. During the rest of the cultivation, the 1.33 ml (39 mg l–1), a 0.4 ml (11 mg l–1) doses, were examined. See figure 7 for the calculated phenol concentrations after the dose taking into account the changes of medium volume caused by dosing and sampling. Figure 6 shows the course of saturation by oxygen during the cultivation, given by the implemented control strategy. Figure 7 shows specific phenol consumption rate against time, together with the progress of the calculated phenol concentration after dosing. Table 2 presents the average values attained in the individual sections of cultivation. The effect of the oxygen limitation is manifested by a high difference of phenol specific consumption rate before and after 4.6 hours of the cultivation time. As we can V. VOJTA et al., Development and Verification of the Control System for Fed-Batch, Chem. Biochem. Eng. Q. 16 (2) 59–67 (2002) 65 T a b l e 2 Phenol specific and total consumption rate Dosage m mg l –1 g Medium Phenol volume consumption l mmol h–1 q phenol –1 mmol g q’ phenol –1 h mmol l–1 h–1 100 1.88 1.53 17.42 2.03 2.49 95 3.12 1.62 30.08 0.66 1.28 71.7 4.32 1.69 12.87 0.52 1.32 39 5.16 1.75 35.00 0.41 1.22 11 5.77 1.80 10.24 0.32 1.04 see in the table 2, the phenol specific consumption rate decreases with the decreasing quantity of the dose. However, the intermediates accumulated in the reactor might cause the inhibition of the degradation, too. So, it is not possible to state, with the certainty, that the phenol specific consumption rate decreases with reducing amount of the dose. F i g . 8 The course of dissolved oxygen Cultivation No. 2 The goal of this cultivation was to find out the relation between the phenol degradation rate and the amount of the individual doses, under the conditions of oxygen in excess. To eliminate the simultaneous effect of the quantity of doses and other effects on the biodegradation rate, we first decreased the quantity of dosage and then increased it again. T a b l e 3 Conditions of the experiment 2 Stirrer speed 800; 600 min–1 Aeration 1 L L–1 min–1 Concentration of phenol water 50 g l–1 The amount of degraded phenol 32.33 g (343.94 mmol) Initial solid 1 g l–1 Final solid 7 g l–1 To be able to add comparable substrate dosage, as it was done in the previous experiment, and also to prevent the oxygen limitation, it was necessary to level up the aeration to 1 L L–1 min–1 and stirrer speed to 600 min–1. The initial dose was 3 ml again. In this case the final concentration of phenol after the dose in the fermenter was 100 mg l–1. Next, the doses 1.8 ml (51.9 mg l–1), 3.6 ml (108.4 mg l–1) a 4.2 ml (123 mg l–1) were examined. See figure 9 for the calculated phenol concentrations after the dose taking into account the changes of medium volume caused by dosing and sampling. Several manual phenol doses were added in the beginning of the experiment, before the saturation by oxygen declined under the “executing” level F i g . 9 Specific consumption rate of phenol (dotted line). The calculated concentration of phenol in the reactor after the dose (solid lines) (90 %) to allow the system to take control over substrate dosing. At 800 min–1, however, extensive foaming took place and the cells entered the foam. That is why it was necessary to add the antifoam oil, which distinctively affects KLa, lower the stirrer speed, and recalibrate the oxygen electrode. With respect to higher oxygen supply, the degradation rate was much higher than in the previous cultivation. Thus increments of phenol and NaOH were higher then before and increase of the medium volume was serious. Therefore, a part of the suspension content was taken off to achieve the initial volume of 1.5 l in the cultivation time of 23.5 hours. The figure 8 shows the course of saturation of the medium by oxygen during the cultivation. Interesting course of “envelope of the wO2 declines” is probably caused by a number of influences. For instance, increasing KLa with increasing volume could have the effect on the course of the wO2 de- 66 V. VOJTA et al., Development and Verification of the Control System for Fed-Batch, Chem. Biochem. Eng. Q. 16 (2) 59–67 (2002) clines in cultivation time of 14–23 hours. The effect of the addition of the antifoam agent is also evident (e.g. in 25th hours). The table 4 presents the average values attained in the individual sections of cultivation defined by different dosing conditions. The phenol specific consumption rate decreases during the whole cultivation as before, disregarding the increasing amount of dose in the second half of the experiment. This observation supports the idea that the rate of phenol degradation does not depend on amount of doses when dosing in the range without limitation of oxygen and without phenol limitation, but on other parameters as intermediate accumulation. T a b l e 4 Phenol specific (q) and total (q’) consumption rates Dosage m mg l–1 100 g Medium Phenol volume consumption l 1.81 1.56 mmol h–1 q phenol q’ phenol mmol g–1 h–1 mmol l–1 h–1 14.28 3.46 4.01 92.3 2.42 1.67 25.27 3.19 4.62 51.9 3.82 1.65 142.31 2.12 4.89 94.9 6.20 1.61 16.62 0.99 3.81 108.4 7.16 1.67 18.72 0.88 3.77 101.33 0.64 3.73 123 10.45 1.79 Discussion In this study, the main functions of the control program in MFCS/win system, controlling the dosing of phenol in a way that prevents the substrate inhibition during its biodegradation, were described. Next, an upgrade to this system was developed. Its benefit for the user is to change parameters easily, such as the amount of dose and the control level of oxygen, by means of the displays in the MS Excel program. The system was successfully tested in several actual cultivations. The experiments proved full functionality of the control program, including the communication of the MFCS/win system with the MS Excel application. The designed system enables easier and more sophisticated research of the fed-batch biodegradations and it can also be used for various types of biodegradations. It is commonly in use at Department of Fermentation Chemistry and Bioengineering (Institute of Chemical Technology, Prague). Although, the system was originally developed for solving a special problem, its applicability is much higher. It can be applied not only for fed-batch cultivation that requires this sort of process control, but after little adjustment also in cases where there is a need to expand the scope of MFCS/win by a new nonstandard functions of computational, operational, and also visual character. During experiments it was experimentally verified that the oxygen supply has a significant effect on the phenol degradation rate. For a high degradation rate, it is necessary to eliminate the limitation by oxygen. It is easy to control the biodegradation so that the limitation by oxygen does not occur only by the suitable setting of the amount of dose by using suggested control strategy. From the experimental results it can be seen that the phenol specific consumption rate (Tab. 2, 4) does not depend much on the amount of phenol dose. This rate gradually lowered in the course of degradation, although, the control strategy managed to keep the concentration of phenol in the medium, during the whole cultivation on the levels, when the substrate inhibition did not occur. Sequential decrease of the degradation rate was caused by other effects. One of them could be the accumulation of intermediates in the reactor3. Using proposed control strategy in the excess of oxygen, the average specific phenol consumption rate 1.63 mmol g–1 h–1 was achieved, and the average total phenol consumption rate during the whole experiment was 3.97 mmol g–1 h–1. These results are fully comparable with data mentioned in literature, where the average total phenol consumption rates are between 0.62 and 8.42 for different microorganisms and methods of cultivation.4,8,9 Fed-batch process of phenol degradation controlled by automatic dosing according to the saturation of the medium by oxygen would be transformed to the process similar to continuous one. Always, before adding the next dose, when the concentration of phenol in the medium is zero, the amount of medium without the cells (complete cells recycle) of a quantity that equals the previous dose, would be taken away. For improved efficiency of the process, the possibility to set automatically the amount of phenol doses during the cultivation, would contribute greatly. The amount of the next phenol dose could be determined on-line in order to reach the prespecified minimal value of dissolved oxygen concentration between two consecutive doses. At the current level of computer control this method is easy to apply. ACKNOWLEDGEMENT The work was financially supported by the Grant Agency of the Czech Republic – Grant No. 104/00/0575, by the fund No MSM 223400007 of Czech Ministry of Education and by the European Commission Fifth Framework Programme under contract No. QLK3-CT-1999-00004. V. VOJTA et al., Development and Verification of the Control System for Fed-Batch, Chem. Biochem. Eng. Q. 16 (2) 59–67 (2002) Nomenclature wO2 – dissolved oxygen tension in the medium, % qphenol – phenol specific consumption rate, mmol g–1 h–1 q’phenol – phenol total consumption rate, mmol l–1 h–1 m – biomass dry mass, g DCU – Digital Control unit DDE – Dynamic Data Exchange GUI – Graphical User Interface MFCS/win – Multi-Fermenter Control System for Windows NT S1, S2, S3, S4 – states of the control program SCADA – Supervisory Control And Data Acquisition References 1. Ruiz-Ordaz, N., Hernández-Manzano, E., Ruiz-Lagúnez, C. J., Cristiani-Urbina, E., Galíndez-Mayer, J., Biotechnol. Prog. 14 (1998) 966 2. 3. 67 Lallai, A., Mura, G., Chem. Eng. J. 53 (1994) B47-B55 Wang, S., Loh, K., Enzyme Microb. Technol. 25 (1999) 177 4. Mordocco, A., Kuek, C., Jenkins, R., Enzyme Microb. Technol. 25 (1999) 530 5. Moreno, J., Buitrón, G., Water Sci. Technol. 38 (1998) 219 6. Dikshitulu, S., Baltzis, B. C., Lewandowski, G. A., Biotechnol. Bioeng. 42 (1993) 643 7. Brack, G., Volk, N., Roser, M., Neuking, F., Chem. Tech. 46 (1994) 186 8. Léonard, D., Youssef, C. B., Destruhaut, C., Lindley, N. D., Queinnec, I., Biotechnol. Bioeng. 50 (1999) 407 9. Schröder, M., Müller, C., Posten, C., Deckwer, W. D., Hecht, V., Biotechnol. Bioeng. 54 (1997) 567 10. Hughes, S. M., Cooper, D. G., Biotechnol. Bioeng. 51 (1996) 112 11. Braun B., Biotech International Gmbh. Micro-DCU 300 user manual. (1996) 12. Braun B., Biotech International Gmbh. MFCS/win 1.1 user manual. (1996)