1
Standard Operating Procedure
Road Condition Evaluations (Visual Observations and Dry Material Sampling)
p. 3 of 5
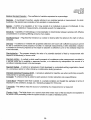
d. Determine direction (right, left, center crown) and degree (high, moderate, low) of road segment
tilt. Tilt is the cross section slope (axis perpendicular to the flow of traffic, along the width of the
segment) and describes the routing of stormwater from the drive lane to the road shoulder.
i. Direction is the dominant side to which stormwater flows from the drive lane.
1. Left, Right: looking downslope, or the view described in step 3b above.
2. Center Crown: water is routed equally to both road shoulders.
3. Possible field indicators include:
• Relative size of flow paths (dominant side is larger)
• Presence/absence of stabilization features (e.g., curb and gutter) (dominant side more
likely stabilized)
• Evidence of flow (dominant side more likely to have flow)
ii. Degree describes the percentage of flow routed to the dominant side.
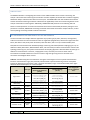
1. High: 95-100% of runoff is directed to one side.
2. Moderate: 75-95% of runoff is directed to one side.
3. Low: Runoff is evenly distributed (50%) or up to 75% of runoff is directed to one side.
e. Determine road surface integrity (high, moderate, low). Observe overall integrity of road segment
surface pavement, observing distribution and intensity of cracks, pocks, etc.
i. High: Less than 10% of surface shows signs of deterioration.
ii. Moderate: 10-25% of surface shows signs of deterioration.
iii. Low: Greater than 25% of surface shows signs of physical deterioration.
f. Visually assess the percent of the road segment area that is distressed and note dominant
distress type.
i. Block: Cracking pattern that divides asphalt into rectangular pieces
ii. Crack: Long, narrow deteriorations in asphalt, can be longitudinal or transverse
iii. Pock: Circular depressions in pavement surface (e.g., potholes)
g. Determine relative traffic density (high, moderate, low).
i. High: Very busy road; cars passed every 1-2 minutes.
ii. Moderate: Busy road; cars passed every 4-5 minutes.
iii. Low: Quiet road; cars passed every 5-10 minutes.
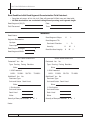
4. Record road shoulder observations for both left and right road shoulders.
a. Record presence/absence of road shoulder protection and type of protection. Road shoulder
protection includes any structural improvements made to minimize human and/or automobile
disturbance of native soils and subsequent erosion along the side of the road. Types include:
• Boulders
• Fencing
• Paving
• Slope (dropoff)
• Slope (hill)
b. Record presence/absence of road shoulder stabilization and type of stabilization. Road shoulder
stabilization includes any improvements made to minimize erosion on road shoulder within
dominant flow path along road shoulder. Types include:
• AC Dike
• Curb and Gutter
• Rock-lined Channel
c. Record degree (high, moderate, low) of erosion in road shoulder flow path and average depth
(ft) of channel.
i. Degree of erosion.
1. High: Deep channel (>6”) and/or active signs of erosion (gullying, bank cuts, etc.).
2. Moderate: Shallow channel (<6”) and few signs of active erosion.
3. Low: No channel development and no signs of erosion.
ii. Use stadia rod to determine average channel depth of road shoulder flow path.
Road Condition Visual Observations:
Note: Road condition observations and assessment is performed during every road segment visit.
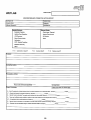
1. Identify side code. Verify road segment metadata collected during initial road segment
characterization and note any changes on field datasheet.
321 Frederick Street Santa Cruz CA 95062 (p) 831.426.9119 (f) 831.426.9023 w.2ndnaturellc.com