1
ENERGYPLUS™
Auxiliary EnergyPlus Programs
To Increase Your Efficiency at
Using EnergyPlus
Date: April 23, 2005
COPYRIGHT © 1996-2005 THE BOARD OF TRUSTEES OF THE UNIVERSITY OF ILLINOIS AND THE REGENTS OF THE
UNIVERSITY OF CALIFORNIA THROUGH THE ERNEST ORLANDO LAWRENCE BERKELEY NATIONAL LABORATORY.
ALL RIGHTS RESERVED. NO PART OF THIS MATERIAL MAY BE REPRODUCED OR TRANSMITTED IN ANY FORM OR BY
ANY MEANS WITHOUT THE PRIOR WRITTEN PERMISSION OF THE UNIVERSITY OF ILLINOIS OR THE ERNEST ORLANDO
LAWRENCE BERKELEY NATIONAL LABORATORY.
ENERGYPLUS IS A TRADEMARK OF THE US DEPARTMENT OF ENERGY.
2
TABLE OF CONTENTS
Introduction ...................................................................................................................1
Weather Converter Program ........................................................................................2
Background ..................................................................................................... 2
New Weather Format for Simulation Programs .............................................. 3
Weather Data Availability ................................................................................ 4
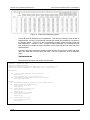
Table 1. Comparison of E/E with ESP-r, DOE-2, and BLAST Weather Data Formats 5
Weather Converter Use .................................................................................. 6
Figure 1. Main menu screen of the Weather Converter Utility ........................ 6
File Menu .................................................................................................. 6
Figure 2. Delta DB Trigger Selection ............................................................... 7
Converting Data ........................................................................................ 8
Figure 3. Convert Data Screen selections ....................................................... 8
Table 2. Input File Extensions with implied Data types ................................... 9
Table 3. LST File Structure............................................................................ 10
Help......................................................................................................... 11
Definitions File & Custom File Processing .................................................... 11
Table 4. Definitions File Details ..................................................................... 12
Expected Formats for &location .............................................................. 13
Expected Formats for &miscdata ............................................................ 13
Expected Formats for &wthdata .............................................................. 13
Table 5. Input File Type Values ..................................................................... 14
Table 6. Data Element Naming Conventions ................................................ 14
Expected Formats for &datacontrol......................................................... 16
Def File Examples ................................................................................... 16
Reports/Files Produced by the Weather Converter ...................................... 18
Audit / Log File ........................................................................................ 18
Statistical Report File .............................................................................. 19
4/23/05
I
TABLE OF CONTENTS
Figure 4. Graph of Spreadsheet Data............................................................ 25
Design Day Calculations Output ............................................................. 25
Köppen Climate Classification ...................................................................... 27
Table 7. Köppen Climate Classification -- Major Groups............................... 27
Tropical Moist Climates (A) ..................................................................... 27
Dry Climates (B)...................................................................................... 28
Moist Subtropical Mid-Latitude Climates (C) ........................................... 28
Moist Continental Mid-latitude Climates (D) ............................................ 28
Polar Climates (E) ................................................................................... 28
Highlands Areas (H)................................................................................ 28
Figure 5. World viewed as Köppen Climate Zones ....................................... 29
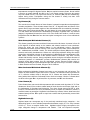
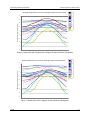
Figure 6. Monthly Dry Bulb Temperatures in Köppen Climates (Northern Hemisphere) 30
Figure 7. Monthly Dew Point in Köppen Climates (Northern Hemisphere) ... 30
ASHRAE Climate Classification .................................................................... 31
EnergyPlus Weather File (EPW) Data Dictionary ......................................... 31
Table 8. Weather File Date Field Interpretation............................................. 31
Data Field Descriptions ........................................................................... 37
Table 9. Present Weather Observation Values ............................................. 40
Table 10. Weather Codes Field Interpretation............................................... 40
CSV Format (In/Out) ..................................................................................... 43
Location Header/Data (CSV) .................................................................. 43
Design Conditions Header/Data (CSV) ................................................... 43
Typical/Extreme Periods Header/Data (CSV) ......................................... 43
Ground Temperatures Header/Data (CSV)............................................. 44
Holiday/Daylight Saving Header/Data (CSV) .......................................... 44
Comment 1 Header/Data (CSV) ............................................................. 44
4/23/05
II
TABLE OF CONTENTS
Comment 2 Header/Data (CSV) ............................................................. 44
Data Period Header/Data (CSV) ............................................................. 44
Data Records (CSV) ............................................................................... 44
Missing Weather File Data ............................................................................ 45
Table 11. Missing weather replacement values ............................................ 45
Source Weather Data Formats ..................................................................... 46
Data Set vs. Data Format........................................................................ 46
SAMSON Data Set/Format ..................................................................... 46
TMY2 Data Set/Format ........................................................................... 46
TMY3 Format .......................................................................................... 47
WYEC2 Data Set/Format ........................................................................ 47
Canadian Weather for Energy Calculations (CWEC).............................. 47
International Weather for Energy Calculations (IWEC) ........................... 47
Typical Meteorological Year (TMY) ......................................................... 48
California Climate Zones 2 (CTZ2) ......................................................... 48
Solar and Wind Energy Resource Assessment (SWERA)...................... 48
Spanish Weather for Energy Calculations (SWEC) ................................ 48
Italian Climatic data collection "Gianni De Giorgio" (IGDG) .................... 49
Chinese Typical Year Weather (CTYW).................................................. 49
Other Formats ......................................................................................... 49
Custom Format ....................................................................................... 49
Solar Data ............................................................................................... 49
Table 12. Summary of Downloadable Weather Data by Type ...................... 50
Data Sources/Uncertainty ............................................................................. 50
Table 13. Key to Data Source and Uncertainty Flags ................................... 50
Table 14. Solar Radiation and Illuminance Data Source Flag Codes ............ 51
4/23/05
III
TABLE OF CONTENTS
Table 15. Solar Radiation and Illuminance Data Uncertainty Flag Codes ..... 52
Table 16. Meteorological Data Source Flag Codes........................................ 52
Table 17. Meteorological Uncertainty Flag Codes......................................... 53
Interface to the EPlusWth.dll......................................................................... 53
Files used by EPlusWth.dll...................................................................... 53
Public calls to EPlusWth.dll..................................................................... 54
Table 18. Trigger Limit Call Values................................................................ 55
Table 19. Valid Input File Types for "ProcessWeather" call .......................... 56
Table 20. Valid Output File Types for the "ProcessWeather" call ................. 56
References.................................................................................................... 57
Web Resources............................................................................................. 58
Ground Heat Transfer in EnergyPlus .........................................................................59
Caution.......................................................................................................... 59
Introduction ................................................................................................... 59
Use of the Ground Temperatures with Slabs ................................................ 60
Figure 8. Daily Temperature Profiles (Slab) .................................................. 62
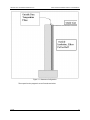
Slab configuration Drawing ........................................................................... 63
Figure 9. Slab-in-grade illustration................................................................. 63
Important Files for Ground Heat Transfer with Slabs.................................... 63
Description of the Objects in the E+SlabGHT.IDD........................................ 64
Materials.................................................................................................. 64
MatlProps ................................................................................................ 65
BoundConds ........................................................................................... 65
BldgProps Object .................................................................................... 66
Insulation Object ..................................................................................... 68
EquivSlab Object..................................................................................... 69
4/23/05
IV
TABLE OF CONTENTS
EquivAutoGrid Object.............................................................................. 69
Figure 10. Illustration of Slab Thickness vs Outside Temperature................ 70
Additional Objects ................................................................................... 70
Sample IDF File – Slab Program ............................................................ 71
Using Ground Temperatures With Basements ............................................. 73
Figure 11. Basement Configuration ............................................................... 74
Figure 12. Output from Basement program ................................................... 75
The Basement idd ................................................................................... 75
Description of the Objects in the BasementGHT.idd..................................... 78
SimParameters Object ............................................................................ 78
MatlProps Object..................................................................................... 79
SurfaceProps Object ............................................................................... 79
BldgData Object ...................................................................................... 79
ComBldg Object ...................................................................................... 80
EquivSlab Object..................................................................................... 80
EquivAutoGrid Object.............................................................................. 80
Important Files for Ground Heat Transfer with Basements........................... 80
Sample idf File - Basement ..................................................................... 81
Using the Interface Surface Temperature Results in EnergyPlus................. 82
Multiple Ground Temperatures ..................................................................... 83
References.................................................................................................... 84
VCompare...................................................................................................................86
VCompare Usage.......................................................................................... 86
Table 21. VCompare Output Files and Descriptions ..................................... 87
Transition ....................................................................................................................89
Table 22. Transition files for current release ................................................. 89
4/23/05
V
TABLE OF CONTENTS
Table 23. Transition Output Files and Descriptions....................................... 90
HVAC System Templates...........................................................................................91
Template Structure and Usage ..................................................................... 91
Overall Template Structure ..................................................................... 91
Figure 13. HVAC Template Structure ............................................................ 92
Using the Templates as a Pre-Processing Tool ...................................... 93
Using the Templates Directly in the Input File......................................... 93
Autosized vs. Fully Specified Template Commands ............................... 93
Template Commands.................................................................................... 93
BasicCommands ..................................................................................... 93
Syntax Rules ........................................................................................... 94
Example Files.......................................................................................... 95
HVAC IDF Segments .............................................................................. 95
Describing Typical HVAC Systems Using the HVAC Templates .................. 95
Purchased Air System............................................................................. 95
Packaged Furnace with DX Cooling System........................................... 95
Four-Pipe Fan Coil System ..................................................................... 95
Single-Duct VAV System with Outside Air Option................................... 95
Purchased Hot Water/Chilled Water Supply Plant .................................. 96
Single Chiller Supply Plant...................................................................... 96
Single Boiler Supply Plant....................................................................... 96
System Macro Commands............................................................................ 96
ZoneThermostat-Autosize[ ] and ZoneThermostat ................................. 96
PurchAirZone-Autosize[ ] and PurchAirZone[ ] ....................................... 97
4PipeFanCoilZone-Autosize [ ] and 4PipeFanCoilZone[ ]....................... 98
VAVZone-Autosize[ ] and VAVZone[ ] .................................................. 100
4/23/05
VI
TABLE OF CONTENTS
DirectAirZone-Autosize[ ] and DirectAirZone[ ] ..................................... 102
VAVAirLoop-Autosize[ ] and VAVAirLoop[ ] .......................................... 102
UnitaryAirLoop-Autosize[ ] and UnitaryAirLoop[ ].................................. 109
FanCoilLoops-Autosize[ ] and FanCoilLoops[ ]..................................... 115
ChilledWaterDemand-Autosize[ ] and ChilledWaterDemand[ ] ............. 115
HotWaterDemand-Autosize[ ] and HotWaterDemand[ ]........................ 116
PurchasedSupplyWithBypass-Autosize[ ] (Not implemented yet) and
PurchasedSupplyWithBypass[ ] ............................................................ 117
BoilerSupply1-Autosize[ ] (Not implemented yet) and BoilerSupply1[ ]. 119
BoilerSupply1WithBypass-Autosize[ ] and BoilerSupply1WithBypass[ ] 119
ChillerSupply1-Autosize[ ] (Not implemented yet) and ChillerSupply1[ ]122
ChillerSupply1WithBypass-Autosize[ ] and ChillerSupply1WithBypass[ ]122
Condenser1-Autosize[ ] (Not implemented yet) and Condenser1[ ]...... 125
Condenser1WithBypass-Autosize[ ]...................................................... 125
Chilled Water Loop Parameter Group ................................................... 128
Hot Water Loop Parameter Group ........................................................ 128
Condenser Water Loop Parameter Group ............................................ 129
Chilled Water Pump Parameter Group ................................................. 130
Hot Water Pump Parameter Group ....................................................... 130
Condenser Water Pump Parameter Group ........................................... 131
Boiler Parameter Group ........................................................................ 132
Chiller Parameter Group ....................................................................... 133
Cooling Tower Parameter Group .......................................................... 133
WinEPDraw...............................................................................................................135
Introduction ................................................................................................. 135
Figure 14. WinEPDraw Main Screen ........................................................... 135
File Menu .............................................................................................. 135
4/23/05
VII
TABLE OF CONTENTS
Options Menu........................................................................................ 136
View Menu ............................................................................................ 136
Help Menu............................................................................................. 136
Figure 15. Dialog for WinEPDraw File Selection ......................................... 137
Input Macros .............................................................................................................138
Introduction ................................................................................................. 138
Incorporating External Files ........................................................................ 138
Selectively Accepting or Skipping Lines of Input......................................... 139
Defining Blocks of Input .............................................................................. 141
Arithmetic Operations............................................................................ 142
Macro Debugging and Listing Control......................................................... 144
Listing Format ............................................................................................. 146
HVAC Diagram .........................................................................................................147
Introduction ................................................................................................. 147
Figure 16. HVAC Diagram -- SVG Drawing................................................. 147
Table 24. HVAC Diagram Object Names (primary sort) Colors .................. 147
Table 25. HVAC Diagram Object Names and Color (primary sort) ............. 149
CoeffConv/CoeffCheck.............................................................................................152
CoeffConv ................................................................................................... 152
CoeffCheck ................................................................................................. 152
ExpandObjects..........................................................................................................154
Introduction ................................................................................................. 154
CSVproc....................................................................................................................157
4/23/05
VIII
INTRODUCTION
BACKGROUND
Introduction
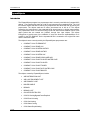
This document will describe several of the “auxiliary programs” of the EnergyPlus system in
more detail. These programs include:
Weather Converter Program (aka “Weather”)
Ground Heat Transfer in EnergyPlus -- Procedure for Ground Temperature creation
VCompare – To compare two Idd files
Transition – to convert input files from one version to another upon release of a new version
HVAC System Templates – Used to assist you in creating HVAC systems
WinEPDraw – Create DXF files from your input files
Input Macros – Use a macro language to increase efficiency in creating EnergyPlus input
files
HVAC Diagram – Use a post processing program to diagram your HVAC inputs.
CoeffConv/CoeffCheck – Convert DOE-2 temperature dependent curves (Fahrenheit) to
EnergyPlus temperature curves (Centigrade/Celsius)
ExpandObjects – Use the Compact HVAC objects for easy HVAC object entry.
CSVproc – Get simple statistics from CSV output files.
4/23/05
1
WEATHER CONVERTER PROGRAM
BACKGROUND
Weather Converter Program
The Weather Converter program is stored in the EnergyPlus folder area under “PreProcess”
and subsequently in the “WeatherConverter” folder.
To perform annual/run period simulations in EnergyPlus, one needs weather data. Most
weather data is still issued in an hour by hour (hourly) format though as you will see,
EnergyPlus and its weather converter can accept data that has a finer resolution on the data
(such as every 10 or 15 minutes).
The special weather format (EPW) used in EnergyPlus is a simple, ascii format as is common
in the rest of the inputs for EnergyPlus.
Background
All building simulation programs employ some means of representing local climatic conditions
relative to the building models. For example, Radiance (Ward 1996) needs a description of
sky conditions and illuminance values to calculate solar distribution through a window and
within a space. Three of the widely used energy simulation programs in the UK and US,
ESP-r (ESRU 1999), BLAST (UI 1998), and DOE-2 (Winkelmann et al. 1993) also use
weather conditions to simulate the response of a building. But even after 30 years of
significant development advances in simulation capabilities, these programs use the same
climate representations as in the past—a simple set of hourly temperature, humidity, wind
speed and direction, and atmospheric pressure and solar radiation or cloud cover data.
These data are often ‘typical’ data derived from hourly observations at a specific location by
the national weather service or meteorological office. Examples of these typical data include
TMY2 (NREL 1995) and WYEC2 (ASHRAE 1997) in the United States and Canada and TRY
(CEC 1985) in Europe. The TMY2 and WYEC2 typical weather years contain more solar
radiation and illumination data than older formats such as TMY (NCDC 1983), WYEC
(ASHRAE 1985), and TRY (NCDC 1981) in the U.S. Crawley (1998) demonstrated that the
methods used to select data for the US TMY2 and European TRY data sets better fits the
long-term climate patterns.
Radiation and illumination data are becoming increasingly necessary in simulation programs.
Anyone who has ever attempted to measure daylight factors will be familiar with the
fluctuations in lighting levels under partly cloudy conditions. The expansion and contraction of
lightweight building components also shares sensitivity to rapid fluctuations in solar radiation.
Single-sided ventilation is dependant on wind pressure fluctuations and pedestrians in many
cities are acquainted with the disarming tendency of the wind to guest and change direction.
It is increasingly the case that design questions touch on such issues.
In a research context, the advent of tools such as LabVIEW (National Instruments
Corporation 1999) have made it possible for increasing numbers of researchers to acquire
and process test-cell data. The increasing use of building energy management systems
(BEMS) has also provided high frequency information from which simulation could be used
as a predictive tool for future control strategies. Other issues of control, particularly of
advanced daylighting control require sub-hourly illumination data to ensure that possible
control regimes are tested under realistic conditions. Janak (1997) observed that the
differences between 5 minute and hourly illumination data could result in prediction variations
approaching 40%.
Thus far, projects that mix empirical and simulation-based work have had to store and access
such data via temporal database facilities (ESRU 1999). As the number of high quality
datasets increases so does the need to encapsulate such information in a form that can be
broadly distributed. The simulation community must also consider the uncertainty in high
4/23/05
2
WEATHER CONVERTER PROGRAM
NEW WEATHER FORMAT FOR SIMULATION PROGRAMS
frequency performance predictions that are based on boundary conditions that have been
sampled at one or two magnitudes less temporal resolution.
The simulation community must also consider practitioner demands and issues of quality
assurance. Someone who is not a native of Copenhagen may not know that there are three
or four recognizable patterns of winter weather that should be included in detailed
assessments. A data set that lacks documentation or is dependent on separately held lists of
assumptions can be effectively useless.
In the absence of data within the weather data format, the simulation programs must
calculate these data often with older calculation methods. As the simulation programs have
become more capable, data at hourly resolution is no longer enough—interpolating between
hourly observations does not accurately represent weather conditions that change much
more frequently such as illumination.
We have developed a new, generalized weather data format for use by energy simulation
programs has been developed and adopted by both ESP-r (in the UK) and EnergyPlus (in the
US). Anticipating the need for data at time steps less than one hour, the format includes a
minute field to facilitate the use of sub hourly data. The data include basic location identifiers
such as location name, data source, latitude, longitude, time zone, elevation, peak design
conditions, holidays, daylight saving period, typical and extreme periods, ground
temperatures, period(s) covered by the data and space for descriptive comments. The time
step data include dry bulb and dew point temperature, relative humidity, station pressure,
solar radiation (global, extraterrestrial, horizontal infrared, direct, and diffuse), illuminance,
wind direction and speed, sky cover, and current weather.
New Weather Format for Simulation Programs
For these reasons, we developed a new generalized weather data format for use with two
major simulation programs—ESP-r and EnergyPlus (Crawley et al. 1999). All the data are in
SI units. The format is simple, text-based with comma-separated data. It is based on the
data available within the TMY2 weather format but has been rearranged to facilitate visual
inspection of the data. The TMY2 data are a strict, position-specific format—filling missing
data with nines and zero values with zeroes. The new weather data format contains commas
to facilitate data reading and analysis with spreadsheet programs. By eliminating redundant
‘fill’ values, the size of each file is only slightly larger than the original TMY2 format. Details
about the TMY2 format can be found in the TMY2 User’s manual (see references at the end
of this section).
The traditional distribution of data source and uncertainty flags within the raw data fields
carries with it not only the need for many field separators, it obfuscates the relationships
between non-numerical data. In a set of minute data, which could easily require hundreds of
thousands of records, the space penalty is considerable. In the E/E file format, all data source
and uncertainty fields have been clumped together as a single field immediately following the
day and time stamp. For applications where uncertainty is not an issue such data can be
easily ignored. When it is important, a single text field is conceptually and computationally
easy to parse.
Another difference between the EnergyPlus/ESP-r (E/E) format and TMY2 is the addition of
two new data fields—minute and infrared sky. The minute field facilitates use of data
observed at intervals of less than one hour such as measured data from a research study of
energy efficiency for a particular building. This will allow easier and more accurate calibration
of a simulation model to measured data than possible in the past. The infrared sky field
allows the programs to calculate the effective sky temperature for re-radiation during
nighttime.
The last difference is that a full year of data (such as 8760 hours) is not required—subsets of
years are acceptable. Which periods are covered by the data is described in the files.
Periods of typical weather patterns based on analysis of the data are also included within the
4/23/05
3
WEATHER CONVERTER PROGRAM
WEATHER DATA AVAILABILITY
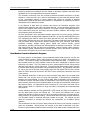
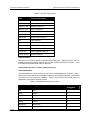
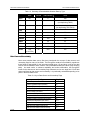
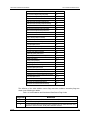
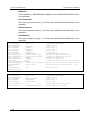
format. A side-by-side comparison of data included in the E/E weather format with data
previously used by ESP-r, DOE-2, and BLAST is shown in Table 1. A deficiency noted
within ESP-r for example is the lack of correcting air volumes for elevation change—many of
the users of ESP-r are in relatively low elevations. For DOE-2 and BLAST, neither program
used illumination data in daylighting calculations or infrared sky temperatures—it was always
recalculated at time of use.
By including the uncertainty and data source information found in TMY2, users now can
evaluate the potential impact of weather variability on the performance of the building.
McDonald and Strachan (1998) are introducing uncertainty analysis into ESP-r.
We use the EnergyPlus data dictionary format to describe the E/E weather data set. (See the
end of this document). Each line in the format is preceded by a keyword such as
LOCATION, DESIGN CONDITIONS, followed by a list of variables beginning either with A or
N and a number. A stands for alphanumeric; N for numeric. The number following A/N is the
sequence of that number in the keyword list. Commas separate data. (Refer to the IDD
Conventions document in “Getting Started” for further explanation of the format). The header
information consists of eight lines (keywords):
LOCATION, DESIGN CONDITIONS,
TYPICAL/EXTREME PERIODS, GROUND TEMPERATURES, HOLIDAYS/DAYLIGHT
SAVINGS, COMMENTS 1, COMMENTS 2, and DATA PERIODS. This is followed by the
time step data.
The first eight lines or header within each E/E weather file define basic location information
such as longitude, latitude, time zone, elevation, annual design conditions, monthly average
ground temperatures, typical and extreme periods, holidays/daylight saving periods, and data
periods included. There is also space for users to document any special features or
information about the file such as sources of data.
Weather Data Availability
Typically, acquisition of weather data has been a user’s burden. Though this will remain the
case in many instances for EnergyPlus users, the EnergyPlus team has been successful in
making a wealth of US, Canadian and International data available to our users. To
summarize, the weather data for 914 locations is available at the EnergyPlus web site:
www.energyplus.gov
In specific, you may download data files for locations:
295 USA (a mixture of TMY2, TMY, CTZ and CTZ2 data)
The 237 USA locations in the TMY2 Data Set, 38 locations from the TMY data set that
were not duplicated when the TMY2 data set was produced, and 4 locations from the
CTZ data set that were not duplicated when the CTZ2 data set was produced.
16 California Climate Zones
The 16 locations in the California Climate Zone Revision 2 (CTZ2) data set.
55 Canada (CWEC data)
The 55 locations from the CWEC data set.
>550 International
2 locations from the TMY2 data set. 4 locations from the TMY data set that were not
duplicated in the TMY2 data set. 227 locations from the IWEC data set. 156 from the
SWERA data set. 52 from the SWEC data set. 66 from IGDG data set. 57 from CTYW
data set.
This data has been selected with the energy simulation user in mind. All the data (as well as
the statistical reports – described later in this document) is downloadable for individual
locations.
4/23/05
4
WEATHER CONVERTER PROGRAM
WEATHER DATA AVAILABILITY
Location (name, latitude, longitude, elevation, time zone)
Data source
Commentary
Design conditions
Typical/extreme periods
Data periods
Holiday/Daylight Saving
Solar Angles/Equation of Time Hours
Degree Days
Year
Month
Day
Hour
Minute
Data source and uncertainty flags
Dry bulb temperature
Wet bulb temperature
Dew point temperature
Atmospheric station pressure
Humidity ratio
Relative humidity
Enthalpy
Density
Wind Speed
Wind Direction
Infrared Sky Temperature
Solar Radiation (global, normal, diffuse)
Illuminance (global, normal, diffuse)
Sky cover (cloud amount)
Opaque sky cover
Visibility
Ceiling height
Clearness (monthly)
Ground temperatures (monthly)
Present weather observation and codes (rain, snow)
Precipitable water
Aerosol optical depth
Snow depth
Days since last snowfall
4/23/05
X
X
X
X
X
X
X
X
X
X
X
X
X
X
X
X
X
X
X
X
X
X
X
X
X
X
X
X
X
X
X
X
X
X
X
X
X
X
X
X
X
X
X
X
X
X
X
X
X
X
X
X
X
X
X
X
X
X
X
X
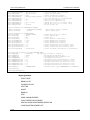
E/E
ESP-r
BLAST
Data Element
DOE-2
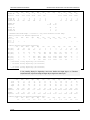
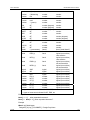
Table 1. Comparison of E/E with ESP-r, DOE-2, and BLAST Weather Data Formats
X
X
X
X
X
X
X
X
X
X
X
X
X
X
X
X
X
X
X
X
5
WEATHER CONVERTER PROGRAM
WEATHER CONVERTER USE
Weather Converter Use
We developed a utility for the E/E format to read standard weather service file types such as
SAMSON and newer ‘typical year’ weather files such as TMY2, WYEC2, and IWEC. The
utility also reads ESP-r (CLM format), DOE-2 (fmt format) and BLAST (Ascii format) files.
The utility translates and extends typical weather data into the E/E format. The processor
makes the calculations necessary for supplying data (when data is missing) and calculates
the Horizontal Infrared Radiation Intensity values—not typically currently an observed value
reported by the meteorological offices through the world. The utility also prepares an
statistical summary of the weather data set as part of the processing. An additional “output
format” from the utility is a comma-delimited file that can easily be imported into a
spreadsheet program such as Excel™ for further user perusal, charting and/or editing.
The utility consists of two parts: a user interface that executes on standard Wintel systems
and a DLL that does the work of the processing. The DLL interface will be described in a
later section for those developers who might wish to access it directly.
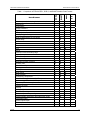
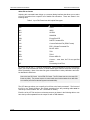
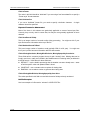
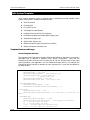
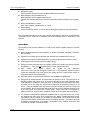
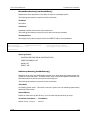
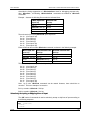
The user front end is a simple to use program with standard graphical user interface menus.
For convenience, it automatically opens with the “convert” option.
Figure 1. Main menu screen of the Weather Converter Utility
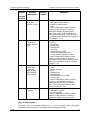
File Menu
The file menu has four options:
4/23/05
6
WEATHER CONVERTER PROGRAM
WEATHER CONVERTER USE
Fix Out of Range Data
This is a toggle option that once selected is saved in the registry with other options (for
example, screen size) for the program. As shown in the IDD type description of the Weather
Data, there are minimum and maximum values for several of the fields. The weather
converter program can ignore these (and just report them) or it can try to fix them with
appropriate values. If the option is “checked”, then the processor will try to fix the data; if it is
blank, the processor will not fix the data though it will report any out of range data that it finds.
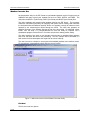
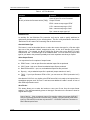
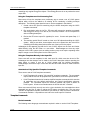
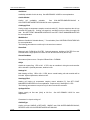
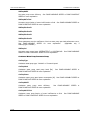
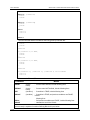
Select Delta DB Trigger
Depending on the quality control and accuracy of the weather data collection, time period
(usually hour to hour) changes in some data values may make the data suspect for that time
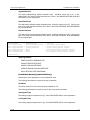
period. This selection brings up the screen shown below and will allow the user some control
over the actual value reporting. Note that this data is not “fixed”, merely reported by the
program in the audit output file.
Figure 2. Delta DB Trigger Selection
Though only one “trigger” value is selected from this screen, consecutive values of dry-bulb
temperature, dew-point temperature and wind speed are reported using appropriate
calculated values. Both dew-point and wind speed use a calculated value based on mean of
their values over the entire data period and standard deviation from that mean, heuristically
derived.
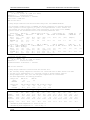
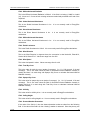
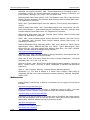
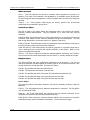
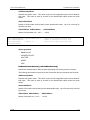
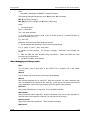
An excerpt from the audit file is illustrative:
Average Delta DB Change= 0.78°C ; Std Dev= 0.83°C
Average Delta DP Change= 0.68°C ; Std Dev= 0.78°C
Average Delta Relative Humidity Change= 4.02% ; Std Dev= 4.22%
Average Delta Wind Speed Change= 0.91m/s ; Std Dev= 0.88m/s
Hourly Dry Bulb temperature change trigger = minimum of 12.13°C and 10.°C
12.13°C = calculated trigger based on mean change in dry-bulb temperature and standard deviation
shown above
10.°C = trigger set by user
Here the calculated DB trigger would be 12.13°C, but the user chosen trigger is 10°C.
Changes >= 10°C will be reported.
- Delta DB/DP Range Triggered for Apr 30
Change in DB= 11.60°C, Hour=14
4/23/05
7
WEATHER CONVERTER PROGRAM
WEATHER CONVERTER USE
Such detail allows the user to hand edit the incoming data, if desired.
Delete File
You may use this menu option to browse your computer and delete files.
Exit
This choice exits the program.
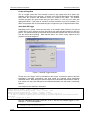
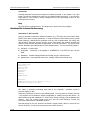
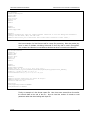
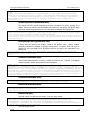
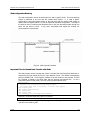
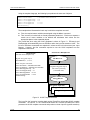
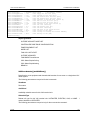
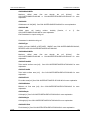
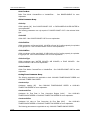
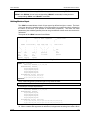
Converting Data
This screen is automatically shown when you start the program – it will allow you to select
raw data for processing, change the default type (based on file extension), select the kind of
conversion you want, select where and what name to store for the processed data, and
process the data. An “almost” completed screen shows:
Figure 3. Convert Data Screen selections
The screen is navigated by choosing the following buttons on the left portion of the screen.
Interpretation from the program is shown in the status boxes on the right portion of the
screen.
4/23/05
8
WEATHER CONVERTER PROGRAM
WEATHER CONVERTER USE
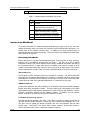
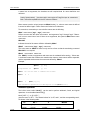
Select File to Convert
Selecting this command button brings up a common dialog interface that allows you to select
a file for conversion from a specific set of default file extensions. These are shown in the
following table.
Table 2. Input File Extensions with implied Data types
File Extension
Implicit Data File Type
TM2
TMY2
IWC
IWEC
WY2
WYEC2
DAT
SAMSON
EPW
EnergyPlus E/E
FMT
DOE-2 Formatted File
CSV
Comma Delimited File (EPW Format)
CLM
ESP-r Climate Formatted File
ASC
BLAST ASCII
TMY
TMY
TM3
TMY3
WEA
Ecotect WEA file
<any>
Custom – must have “def” file as specified
below
LST
Processing List of Files
Of course, the “all files” (*.*) may be used as well. If the file selected is not one of the above
types, you will be cautioned to use the “override default type” button to select the correct type
before proceeding. Most of the data file types are described in other publications and won’t
be described in detail here.
Note on the input CSV format: It is the EPW CSV format. The CSV format must mirror the output CSV
format very closely. The processor expects a Location header record and the headers for the data fields
as a minimum (as well as the data that supports those header fields).
The LST data type allows you to specify a list of files to be “batch processed”. The format of
this file is very simple (however, the default extensions from the preceding table must be
used or you must include a “def” file – see below for details).
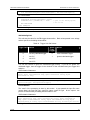
Each line of the LST file can have a columnar structure as shown in the following table or can
have the input file separated from the output file with a TAB character.
4/23/05
9
WEATHER CONVERTER PROGRAM
WEATHER CONVERTER USE
Table 3. LST File Structure
Columns
Contents
1-45
Name of Input File to be Processed
46-105 (or follow the first name with a {TAB})
Output File with:
EPW – same as output type “EPW”
CSV – same as output type “CSV”
Both – same as output type “both”
Rpt – same as output type “rpt”
Definitions File
An auxiliary file, the Definitions File (extension .def) can be used to specify additional or
replacement characteristics for the incoming data. This file is fully described in the section
“Definitions File & Custom File Processing” later in this document.
Override Default Type
This button is used as described above to select the correct data type for a file that might
have one of the standard “default” extensions but may, in fact, be a data file of an entirely
different type. For example, the BLAST ASCII files as they exist on the BLAST CD have
extensions of .dat – our default type for the SAMSON data. You must select the proper data
type for your data or the processor probably won’t work anywhere near what you expect.
Select Output Format
You may select from four options of output format:
EPW Format -- both an epw file and a statistical report file are produced
CSV Format – both a csv file and a statistical report file are produced
Both EPW and CSV – epw, csv, and statistical report files are produced
Rpt only – only a statistical report file is produced (output extension is “stat”)
TMY2 – if your input file was a EPW or CSV, you can save as a TMY2 (extension “tm2”)
format
Note that the CSV file is very similar to the EPW format file but is ready to be imported into a
spreadsheet program such as Excel™ and has some additional “header” records in front of
each EPW style header record
Save File As…
This button allows you to select the location to save your file set from the output format
selection. The utility automatically places a “data type” extension on the file name to show its
original data file type.
Note on Save As… Since you select the “save as” file name from a dialog, the processor DOES NOT
warn you of overwriting previous files of the same name. In addition, if you have previously saved several
types (e.g. EPW and CSV) but this time only save the RPT – it DOES NOT create new of the others nor
does it delete the previous ones.
4/23/05
10
WEATHER CONVERTER PROGRAM
DEFINITIONS FILE & CUSTOM FILE PROCESSING
Convert File
Pressing this button causes the processing of the data to proceed. If you choose a “.lst” input
format, you will see messages as each once is completed and/or has errors. If you choose a
single data file, you will see a similar message box once the processing is done (or has
terminated due to errors).
Help
No online help is yet implemented. This brings up an “about” box for the program.
Definitions File & Custom File Processing
Description of “Def” input file
Some of the data formats have inherent omissions (e.g. TMY does not have location data,
BLAST ASCII does not have elevations). In order to overcome this limitation and to provide
further flexibility, a definitions file (extension must be .def) is implemented. By naming this
with the same “file name” as your input file (in the same folder), the weather converter will
read the format and use that data, as appropriate, in the file conversions. The .def file uses
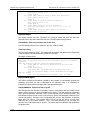
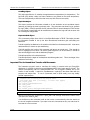
Fortran “Namelist” input fields as shown in the example below. The set of namelist groups is:
&location – Location data
&miscdata – Comments to be applied to “COMMENT2” in the EPW file and “Source
Data”
&wthdata – weather data specifications including file type, custom formats
&datacontrol – user specified control over “missing” data (Custom format only)
&location
City='Hong Kong'
StateProv=' '
Country='CHN'
InLat=22.75
InLong=115
InTime=8
InElev=0
InWMO=450040
/
&miscdata
Comments1='This file was given to us by....'
SourceData=’Original xyz data’
/
The “slash” (/) character terminating each block is very important – omissions results in
incorrect reading of data.
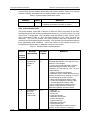
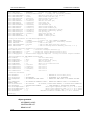
Definitions File Details are shown in the following table. You may leave out a field if you wish
– the program will use whatever default is applicable (or usable) from the data format. All
data formats accept this additional file. Only Custom format currently uses the &datacontrol
element. And only Custom format input type uses the Data Elements, Format and
Conversion factors from the &wthdata element.
Note that strings in the “def” should be enclosed in single quotes if there is more than one
word in the string – if only one word, quotes do not need to be used.
4/23/05
11
WEATHER CONVERTER PROGRAM
DEFINITIONS FILE & CUSTOM FILE PROCESSING
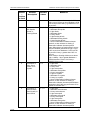
Table 4. Definitions File Details
Field Description
Field Name
Type
&location
Name of City
City
String
State or Province
StateProv
String
Country Code
Country
String (3 characters)
Latitude (N+/S-)
InLat
Numeric
Longitude (W-/E+)
InLong
Numeric
Time Zone (GMT +/-)
InTime
Numeric
Elevation (meters)
InElev
Numeric
WMO #
InWMO
Numeric or
characters)
String for Comments 1 header
Comments1
String
String for Comments 2 header
Comments2
String
String for Source
Location header
SourceData
String
Input File Type
InputFileType
String
Number of records per hour
NumInHour
Integer
Data Element Names
DataElements
Strings
Data Units
DataUnits
Strings
DataConversionFactors
Numeric
Format for input
InFormat
Format String or “delimited”
Delimiter Character
DelimiterChar
String
(6
&miscdata
Data
in
&wthdata
Multiplicative
Factors for Data
Conversion
&datacontrol
4/23/05
Records to Skip
NumRecordsToSkip
Integer
Records to Read
MaxNumRecordsToRead
Integer
Missing Data Action
MissingDataAction
Missing Wind Direction Action
MissingWindDirAction
Missing Wind Direction Value
MissingWindDirValue
Missing Opaque Sky Cover
Action
MissingOpaqueSkyCoverAction
Missing Opaque Sky Cover
Value
MissingOpaqueSkyCoverValue
Real
Real (Fraction 0.0 to 1.0)
12
WEATHER CONVERTER PROGRAM
DEFINITIONS FILE & CUSTOM FILE PROCESSING
Expected Formats for &location
Fields: City, StateProv, Country
These fields are string variables. If Country is not included, an attempt to use the State/Prov
entry may be used to determine country. Otherwise, these fields are not validated and are
used to create part of the “location” header record in the EPW file. City can be up to 30
characters in length; StateProv up to 15 characters; Country up to 10 characters (standard 3
character abbreviation preferred).
Fields: InLat, InLong
These fields are decimal equivalent for Latitude and Longitude. The convention is North
Latitude is positive; South is negative. Likewise, East Longitude is positive; West Longitude
is negative. That is, if your latitude is N 30° 15’ (North 30 degrees, 15 minutes) then your
input is +30.25.
Field: InTime
This field is the decimal equivalent for the Time Zone value. The convention is GMT +/-.
That is, if your time zone is “behind” GMT time by 6 hours, your input would be –6.
Field: InElev
This field is the location elevation in meters. Range can be from –300 to 6096. (These are
the values from EnergyPlus – there is no validation of these in the weather converter.)
Field: InWMO
This field is the WMO (World Meterological Organization) number for the location. Though
not validated per se, if found in the “design conditions” auxiliary files, the Design Day
information can be generated.
Expected Formats for &miscdata
Fields: Comments1, Comments2
These are strings. After concatenation, they become part of one of the Comment header
lines in the EPW headers, depending on Input file Type. Up to 150 characters each is
allowed.
Field: SourceData
This is a string that is applied to the “Source Data” field in the Location Header. Up to 60
characters is allowed.
Expected Formats for &wthdata
Field: InputFileType
You can always use this field and def file to “override” the default input format type that
depends on the extension of your file (see Table 2. Input File Extensions with implied Data
types). A complete set of valid values for Input File types is shown in the following table.
Data Files are described more fully in the section Source Weather Data Formats that occurs
later in this document.
4/23/05
13
WEATHER CONVERTER PROGRAM
DEFINITIONS FILE & CUSTOM FILE PROCESSING
Table 5. Input File Type Values
Value
File Type Description
Tmy or ,tm2
TMY2 Data File
Iwec or iwc
IWEC Data File
Samson or dat
SAMSON Data File
wyec2 or wy2
WYEC2 Data File
Fmt or txt
DOE-2 FMT File
Clm or esp-r
ESP-r Formatted (CLM) data file
Blast or asc
BLAST ASCII Data File
Tmy
TMY Data File
Epw
EPW Data File
Csv
EPW - CSV Data File
Wea
Ecotect wea Data File
tmy3 or tm3
TMY3 (SWERA) Data File
Custom or User
Custom Data File
Field: NumInHour
This field can be used to specify multi-interval (per hour) files. Without this field, the only
formats that can have multiple intervals per hour are the EPW and CSV file formats – using
the header record DataPeriods value for that field.
Fields below only used in “Custom” format processing
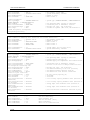
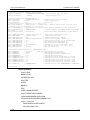
Field: DataElements
The specifications for these fields must come from a standardized list of names. (See ).
Since these names cannot have embedded spaces (or the namelist read fails), underscores
are used in the “long” names for readability. “Ignore” can be used to skip a field that is not
applicable to the weather converter formats.
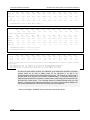
Table 6. Data Element Naming Conventions
4/23/05
Short Name
Long Name
Used by
EnergyPlus
year
year
n
month
month
y
day
day
y
hour
hour
y
minute
minute
n
datasource
datasource
n
drybulb
dry_bulb_temperature
y
14
WEATHER CONVERTER PROGRAM
DEFINITIONS FILE & CUSTOM FILE PROCESSING
Short Name
Long Name
Used by
EnergyPlus
dewpoint
dew_point_temperature
y
relhum
relative_humidity
y
atmos_pressure
atmospheric_pressure
y
exthorrad
extraterrestrial_horizontal_radiation
n
extdirrad
extraterrestrial_direct_normal_radiation
n
horirsky
horizontal_infrared_radiation_intensity_from_sky
y
glohorrad
global_horizontal_radiation
n
dirnorrad
direct_normal_radiation
y
difhorrad
diffuse_horizontal_radiation
y
glohorillum
global_horizontal_illuminance
n
dirnorillum
direct_normal_illuminance
n
difhorillum
diffuse_horizontal_illuminance
n
zenlum
zenith_luminance
n
winddir
wind_direction
y
windspd
wind_speed
y
totskycvr
total_sky_cover
n
opaqskycvr
opaque_sky_cover
n
visibility
visibility
n
ceiling_hgt
ceiling_height
n
presweathobs
present_weather_observation
y
presweathcodes
present_weather_codes
y
precip_wtr
precipitable_water
n
aerosol_opt_depth
aerosol_optical_depth
n
snowdepth
snow_depth
y
days_last_snow
days_since_last_snow
n
Field: DataUnits
There should be as many DataUnits entries as DataElement entries. These are not generally
used but may be used in the future for automatic conversions. The exception to this is
“temperature” fields. Use “f” for Fahrenheit, “k” for Kelvin temperatures. Note that the
DataConversionFactor for this field will be applied prior to conversion. (Many formats use
integer numbers to represent values that are in tenths, for example.)
Field: DataConversionFactors
There should be as many DataConversionFactors entries as DataElement entries. These
factors are multiplicative factors (i.e. the input value is multiplied by this factor) and can be
used to process input data into the values used in the EPW weather files.
4/23/05
15
WEATHER CONVERTER PROGRAM
DEFINITIONS FILE & CUSTOM FILE PROCESSING
Field: InFormat
The value in this field should be “delimited” if you are using a free format data file or specify a
“Fortran style” format statement.
Field: DelimiterChar
If you use a “delimited” format file, you need to specify a delimiter character.
character should be specified.
A single
Expected Formats for &datacontrol
Most of the items in this element are particularly applicable to custom format input files.
Currently, they are only used in custom files, but may be more generally applicable in future
releases.
Field: NumRecordsToSkip
This is an integer number of records to skip during processing. You might use this if your
input file has some information at the top of the file.
Field: MaxNumRecordsToRead
This is an integer number of records to read (typically 8760 for a full year). You might use
this if your input file has some information after the data records.
Fields: MissingDataAction, MissingWindDirAction, MissingOpaqueSkyCoverAction
These fields tell the converter program what to do with “missing” data. Missing data can be
found in two forms: totally not included in the DataElements or a missing value (as defined in
the EPW format). Valid values for these fields are:
DEFAULT – use the default processing that the weather converter already uses – starts
off with a specific value and updates if data is found.
CONSTANT – use a constant value to replace all missing data
RANDOM – use a random number to generate the missing data
Fields: MissingWindDirValue, MissingOpaqueSkyCoverValue
The values specified in this field are used with the action fields previously mentioned.
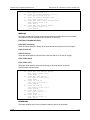
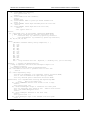
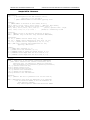
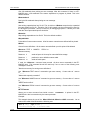
Def File Examples
Here’s an example of a file used to “enhance” a DOE-2 FMT file:
4/23/05
16
WEATHER CONVERTER PROGRAM
DEFINITIONS FILE & CUSTOM FILE PROCESSING
&location
City='Kelburn'
StateProv='Wellington'
Country='NZL'
InWMO=934360
InLat=-42.3333
InLong=174.8
InElev=8
InTime=1
/
&wthdata
NumInHour=1
InputFileType='FMT'
/
&miscdata
Comments1='Standard Data Files for Computer Thermal Simulation of Solar Low Energy Non-residential
Buildings; ven der Werff, Amor, and Donn 1990'
Comments2='Full Actual year of dataSource data is TRY format converted to DOE-2 format,'
/
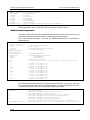
Here’s an example of a fixed format used for custom file processing. Note that random sky
cover is used, to facilitate calculating Horizontal IR from Sky that is used in EnergyPlus.
Also, random wind direction is used because the data set does not contain wind direction.
&location
City='Torino-Caselle'
StateProv=' '
Country='ITA'
InWMO=160590
InLat=45.18333
InLong=7.65
InElev=282
InTime=1
/
&wthdata
NumInHour=1
InputFileType='CUSTOM'
InFormat='(I2, I2, I2, F7.2, F7.2, F5.1, F5.1, F5.1)'
DataElements=Month,Day,Hour,DirNorRad,DifHorRad,DryBulb,Wind_Speed,Relative_Humidity
DataUnits=,,,'kJ/M2','kJ/M2','C','m/s','%'
DataConversionFactors=1,1,1,.2777778,.2777778,1,1,1
/
&miscdata
Comments1='Italian Climate Data Set Gianni de Giorgio'
Comments2='Period of record 1951-1970'
SourceData=’IGDG Data Set’
/
&datacontrol
MissingOpaqueSkyCoverAction=RANDOM
MissingWindDirAction=RANDOM
/
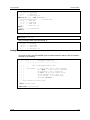
Finally, an example of a free format custom file. Here, there were several lines of text after
the numeric data at the end of the file – thus we used the number of records to read
parameter rather than hand editing each input file.
4/23/05
17
WEATHER CONVERTER PROGRAM
REPORTS/FILES PRODUCED BY THE WEATHER CONVERTER
&location
City='Beijing'
StateProv='Beijing'
Country='CHN'
InWMO='545110'
InLat=39.92
InLong=116.27
InElev=55
InTime=8
/
&miscdata
Comments1='China Data Set - Zhang/Huang'
/
&wthdata
NumInHour=1
InputFileType='CUSTOM'
InFormat='DELIMITED'
DataElements=Ignore,Year,Month,Day,Hour,Ignore,DryBulb,DewPoint,Ignore,Relative_Humidity,Ignore,DirNorRad,
DifHorRad,WindDir,Wind_Speed,OpaqSkyCvr,Atmos_Pressure
DataUnits=x,x,x,x,x,x,'k','k',x,'%',x,'wh/m2','wh/m2','deg','m/s',x,'Pa'
DataConversionFactors=1,1,1,1,1,1,.1,.1,1,1,1,1,1,1,.1,.1,10
DelimiterChar=' '
/
&datacontrol
NumRecordsToSkip=0
MaxNumRecordsToRead=8760
/
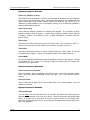
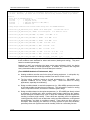
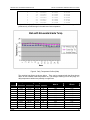
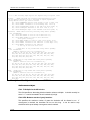
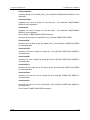
Reports/Files Produced by the Weather Converter
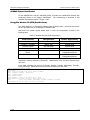
Minimally, two outputs are produced for every weather converter run: an audit / log file and a
statistical report file. The audit / log file shows details of the processing (including any errors)
as well as the statistical report. The statistical report produced from the weather conversion
process is a short, but complete, picture of the weather data on the file. A single file (.stat
extension) is produced of the “statistics” about the data file. A feature of the weather
converter is to look in several design condition files for possible design conditions for the
location from the stored design condition files (source: ASHRAE Handbook of Fundamentals,
2001). If found (WMO (World Meteorological Organization) id is used for matching), these
will be shown in the report as well as included in the output data files (EPW and CSV, as
applicable). In addition, the Köppen classification scheme is used to characterize the climate
based on the data file’s contents. Other statistics are given as well to help you visualize the
data.
In the “reporting” section of the file, each line contains “tab-delimited” elements. This will
allow you to easily place the data into a spreadsheet program for further refinement but the
tabs are not as intrusive for “normal viewing” as commas.
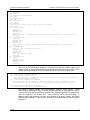
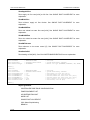
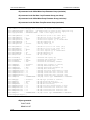
Audit / Log File
As an example, the initial portion of an audit file is shown (illustrating the error reporting):
4/23/05
18
WEATHER CONVERTER PROGRAM
REPORTS/FILES PRODUCED BY THE WEATHER CONVERTER
-Input File Type=WY2, with FileName=D:\DevTests\Release\WeatherData\04772.wy2
-Out of Range Data items will NOT be corrected.
Warning ** Dew Point=
5.00°C > Dry Bulb=
4.90°C on date= 5/ 1 at hour= 4
Warning ** Dew Point=
4.80°C > Dry Bulb=
4.40°C on date= 5/ 1 at hour= 5
Warning ** Dew Point=
4.70°C > Dry Bulb=
3.80°C on date= 5/ 1 at hour= 6
Warning ** Suspected missing data line after processing
365 days
Month=
0 Day=
0 Hour=
0
Processing continues but may be in error
Warning ** Suspected Blank line after processing
365 days
** Remaining records, if any, will be ignored
Warning ** Missing Data Found on Source Weather Data File
** Missing (and corrected) Aerosol Optical Depth, Number of items= 8760
Warning ** Out of Range Data Found on Weather Data File
** Out of Range Dew Point Temperatures > Dry Bulb Temperatures, Number of items=
3
- Start Date/End Date for Weather Source
Start Date=Jan 1; End Date=Dec 31
- Actual Data Years for Monthly Data**
Jan
Feb
Mar
Apr
May
Jun
Jul
1966
1980
1964
1964
1968
1970
1977
- ** Not all weather data sources represent contiguous years.
- ** Monthly data values may come from different years.
Aug
1981
Sep
1979
Oct
1969
Nov
1974
Dec
1960
- Data Sources should be checked for relevancy to these statistics.
Average Delta DB Change= 0.76°C ; Std Dev= 0.73°C
Average Delta DP Change= 0.62°C ; Std Dev= 0.69°C
Average Delta Relative Humidity Change= 3.50% ; Std Dev= 3.63%
Average Delta Wind Speed Change= 0.93m/s ; Std Dev= 0.88m/s
Hourly Dry Bulb temperature change trigger = minimum of 11.07°C and 10.°C
11.07°C = calculated trigger based on mean change in dry-bulb temperature and standard deviation
shown above
10.°C = trigger set by user
-Output File Type=epw, with FileName=D:\DevTests\Release\WeatherData\Out\CAN_OttawaInternational_Airport_CWEC.epw
-Output File Type=csv, with FileName=D:\DevTests\Release\WeatherData\Out\CAN_OttawaInternational_Airport_CWEC.csv
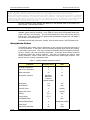
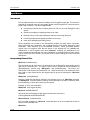
Statistical Report File
As will be seen in comparison with a “statistical” report shown following, the audit file may
contain some details about the data that the statistical report does not (such as the data
years for the weather data). Some basic statistics are shown first:
4/23/05
19
WEATHER CONVERTER PROGRAM
REPORTS/FILES PRODUCED BY THE WEATHER CONVERTER
Statistics for AUS_Sydney_IWEC-V1
Location -- SYDNEY AUS
{S 33° 57'} {E 151° 10'} {GMT +10.0 Hours}
Elevation -3m above sea level
Standard Pressure at Elevation -- 101289Pa
Data Source -- IWEC Data
WMO Station 947670
- Using Design Conditions from "World Climate Design Data 2001 ASHRAE Handbook"
-
If the design condition source is ASHRAE, the design conditions are carefully generated
from a period of record (typically 30 years) to be representative of that location and
be suitable for use in heating/cooling load calculations. If the source is not ASHRAE,
please consult the referenced source for the reasoning behind the data.
Design Stat
HDB 99.6%
HDB 99%
WS 1%
CM MDB 1%
MWS 99.6%
StdDB Max
X StdDB Min
Units
{°C}
{°C}
{m/s}
{m/s}
{m/s}
{Degree}
{°C}
{°C}
HEATING 5.8
6.8
11.3
9.9
39.3
3.1
2.9
1.9
Design Stat
MDB .4%
E WB 1%
2%
HR 2%
MDB 2%
Units
{°C}
{g/kg} {°C}
COOLING 32.2
16.4
24.8
X WS 1% X WS 2.5%
X WS 5% CM WS .4%
PWD 99.6%
MWS .4% PWD .4% X MnDB Max
CM MDB .4%
X MnDB Min
{m/s}
{°C}
8.8
{m/s}
{°C}
11.1
{°C}
{m/s}
{°C}
{m/s}
{Degree}
14.2
9.1
13.4
1.1
320
CDB .4% C MWB .4%
CDB 1% C MWB 1%
E MDB 1%
E WB 2% E MDB 2%
DP .4%
DB Range
{°C}
{°C}
{°C}
{°C}
{°C}
{°C}
{°C}
{g/kg} {°C}
{°C}
{g/kg} {°C}
20
29.5
19.7
27.9
20.1
23
21.1
15.8
24.3
20.6
15.3
23.9
5.3
CM
X
300
CDB 2% C MWB 2%
HR .4% MDB .4% DP 1%
E WB .4%
E
HR 1%
MDB 1% DP
{°C}
{°C}
28
6.7
{°C}
{°C}
{°C}
{°C}
{°C}
22.3
26.2
21.7
25.3
21.7
Or, if the weather converter must calculate the design stats:
Statistics for SAU_Jiddah
Location -- JEDDAH_ 1980
{N 21° 30'} {E 39° 12'} {GMT +3.0 Hours}
Elevation -0m above sea level
Standard Pressure at Elevation -- 101325Pa
WMO Station *unknown*
- Using Design Conditions calculated from this weather file.
-
The following design temperature statistics are calculated based on THIS weather file ONLY
and may not be representative of a long-term period of record normally used for
design temperatures. Also, note that dew point temperatures are listed where
wet-bulb temperatures are normally presented.
Design Stat
Units
HEATING
HDB 99.6%
{C}
16.0
17.1
HDB 99%
{C}
Design Stat
Units
COOLING
CDB .4% CDB 1% CDB 2% CDP .4% CDP 1% CDP 2%
{C}
{C}
{C}
{C}
{C}
{C}
40.1
40.1
39.0
27.6
27.2
26.6
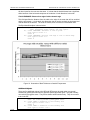
These are followed by groupings of Monthly data.
- Monthly Statistics for Dry Bulb
Jan
Feb
Mar
Maximum
41.4
34.4
30.0
Day:Hour
8:05
4:05
16:03
Minimum
15.0
10.2
13.0
Day:Hour
13:20
18:18
20:19
Daily Avg
23.0
22.6
20.6
temperatures °C
Apr
May
Jun
27.0
26.4
22.7
28:02
6:05
8:05
8.8
6.7
5.0
11:20
17:20
22:20
18.7
- Maximum Dry Bulb temperature of
- Minimum Dry Bulb temperature of
4/23/05
15.8
13.0
41.4°C on Jan
3.8°C on Aug
Jul
26.0
24:03
3.9
6:20
Aug
25.7
14:05
3.8
8:20
Sep
28.3
30:02
7.6
10:20
Oct
35.0
9:03
8.6
10:20
Nov
36.0
20:04
9.6
2:20
Dec
37.3
26:05
13.0
15:19
12.3
13.6
15.3
18.1
19.7
21.2
8
8
20
WEATHER CONVERTER PROGRAM
REPORTS/FILES PRODUCED BY THE WEATHER CONVERTER
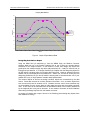
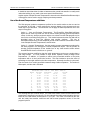
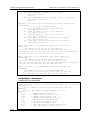
For the dry-bulb temperatures, an average hourly report, by month, is also given:
- Average Hourly Statistics for Dry Bulb temperatures °C
Jan
Feb
Mar
Apr
May
Jun
Jul
0:01- 1:00
5.0
7.5
8.4
10.0
14.0
17.5
19.4
1:01- 2:00
4.8
7.0
8.0
9.3
13.2
16.7
18.4
2:01- 3:00
4.5
6.6
7.8
8.7
12.4
15.9
17.3
3:01- 4:00
4.1
6.5
7.5
8.0
11.5
15.1
16.2
4:01- 5:00
4.0
6.2
7.0
8.4
12.6
15.9
17.2
5:01- 6:00
3.9
6.0
6.8
8.8
13.7
16.7
18.1
6:01- 7:00
3.8
5.7
7.4
9.2
14.8
17.6
19.1
7:01- 8:00
4.8
6.3
9.3
11.5
16.9
19.9
21.6
8:01- 9:00
5.8
7.9
11.2
13.9
19.0
22.1
24.2
9:01-10:00
6.8
9.8
13.0
16.2
21.1
24.4
26.7
10:01-11:00
8.2
11.5
14.5
17.5
22.7
26.0
28.7
11:01-12:00
9.7
13.1
15.9
18.9
24.3
27.7
30.7
12:01-13:00 11.1
14.2
16.9
20.2
25.9
29.3
32.8
13:01-14:00 11.4
14.8
17.2
20.7
26.4
29.9
33.4
14:01-15:00 11.8
15.2
17.5
21.2
26.9
30.5
34.0
15:01-16:00 12.1
15.1
17.3
21.8
27.4
31.1
34.7
16:01-17:00 10.6
14.1
15.8
20.3
25.9
29.9
33.5
17:01-18:00
9.0
12.4
13.8
18.8
24.5
28.8
32.3
18:01-19:00
7.5
10.9
12.6
17.4
23.1
27.6
31.2
19:01-20:00
6.9
10.0
11.6
15.8
21.3
25.4
28.6
20:01-21:00
6.4
9.4
10.6
14.4
19.5
23.2
26.1
21:01-22:00
5.8
9.0
10.1
12.9
17.7
21.0
23.6
22:01-23:00
5.5
8.6
9.5
11.8
16.2
19.5
21.7
23:01-24:00
5.2
8.1
8.9
10.9
15.0
18.5
20.4
Max Hour
16
15
15
16
16
16
16
Min Hour
7
7
6
4
4
4
4
Aug
18.2
17.3
16.3
15.4
15.9
16.3
16.8
19.9
23.0
26.2
28.3
30.4
32.5
33.1
33.6
34.2
32.4
30.7
29.0
26.6
24.3
22.1
20.3
19.1
16
4
Sep
17.1
16.2
15.4
14.8
14.0
13.2
14.4
17.0
19.4
21.8
24.3
26.5
28.4
29.7
30.3
30.6
30.0
27.9
25.0
22.8
21.3
20.2
19.2
18.1
16
6
Oct
12.5
11.9
11.2
10.9
10.4
10.0
11.6
14.5
17.3
19.7
21.7
23.1
24.4
25.2
25.4
24.7
22.3
19.9
18.0
16.5
15.3
14.3
13.5
12.8
15
6
Nov
8.4
7.9
7.5
7.4
7.1
6.8
6.9
8.5
10.5
12.6
14.2
15.4
16.4
16.9
16.7
15.9
14.1
12.8
11.6
10.9
10.3
9.7
9.3
8.9
14
6
Dec
5.0
4.8
4.6
4.5
4.5
4.6
4.3
4.4
5.5
7.2
8.8
10.3
11.4
12.3
12.8
12.3
10.2
8.9
7.8
7.0
6.4
6.0
5.6
5.2
15
7
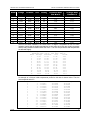
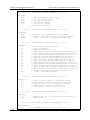
This is followed by the remainder of the monthly displays:
- Monthly Statistics for Dew Point temperatures °C
Jan
Feb
Mar
Apr
May
Jun
Maximum
12.6
11.8
14.5
12.1
16.0
13.3
Day:Hour
15:16
16:11
9:13
5:19
19:19
9:16
Jul
15.5
17:19
Aug
16.1
4:19
Sep
12.6
5:01
Oct
13.4
17:23
Nov
13.2
19:23
Dec
12.9
20:16
Minimum
Day:Hour
-9.9
25:22
-10.1
5:10
-11.2
1:20
-6.0
24:19
-13.8
6:16
-6.6
3:24
-7.4
27:16
-4.3
18:01
-7.0
8:15
-8.0
2:23
-11.9
10:20
-15.9
11:07
Daily Avg
2.3
1.9
4.6
3.8
5.3
6.3
6.9
7.8
5.5
3.2
2.6
1.9
- Maximum Dew Point temperature of 16.1°C on Aug 4
- Minimum Dew Point temperature of -15.9°C on Dec 11
4/23/05
21
WEATHER CONVERTER PROGRAM
REPORTS/FILES PRODUCED BY THE WEATHER CONVERTER
- Monthly Statistics for Wind Chill/Heat Index temperatures °C **
Jan
Feb
Mar
Apr
May
Jun
Jul
Aug
Minimum WC
-10
-7
-8
-2
1
4
Day:Hour
29:10
9:24
12:04
21:04
6:04
9:07
Average WC
Avg Del WC
# Hours WC
1
4
516
2
5
381
4
3
264
4
4
164
6
2
39
Sep
5
4
8
Maximum HI
Day:Hour
30
17:20
30
4:20
28
0
8
28
0
12
Average HI
Avg Del HI
# Hours HI
2
27:02
Oct
-1
24:06
Nov
-12
13:08
Dec
-10
16:08
7
3
20
6
2
81
2
4
286
1
4
533
- **WindChill/HeatIndex Temps -- statistics...only those different from Air Temps
- Monthly Statistics for Extreme temperatures °C
#Days
Jan
Feb
Mar
Apr
May
Jun
Max >= 32
8
16
Max <= 0
Min <= 0
5
1
Min <=-18
- Monthly Heating/Cooling Degree Days/Hours
Jan
Feb
Mar
Apr
May
HDD [10C]
96
24
13
0
0
HDD [18C]
340
229
198
107
22
Jun
Jul
24
Jul
Aug
23
Aug
Sep
17
Sep
Oct
Nov
Dec
4
Oct
2
8
0
6
0
0
0
0
0
13
0
51
Nov
25
207
Dec
90
333
CDD [10C]
CDD [18C]
4
0
19
0
63
0
133
0
292
66
388
154
478
230
442
194
347
119
216
19
58
0
6
0
CDH [20C]
CDH [23C]
CDH [27C]
0
0
0
12
0
0
74
7
0
426
153
11
1860
1036
382
3243
2088
1000
4727
3273
1737
4088
2768
1406
2694
1668
735
1054
517
139
85
8
0
0
0
0
- 2446 annual cooling degree-days (10°C baseline)
- 249 annual heating degree-days (10°C baseline)
- 782 annual cooling degree-days (18°C baseline)
- 1505 annual heating degree-days (18°C baseline)
In the preceding display for degree-days, users more familiar with degree days to a Fahrenheit
temperature base, may wish to multiply the degree day or degree hour values by 9/5.
- Monthly Average Daily Relative Humidity %
Jan
Feb
Mar
Apr
May
4am
85
71
78
67
67
10am
78
64
58
46
40
3pm
61
46
49
35
27
10pm
80
66
75
58
50
Jun
53
35
26
45
Jul
53
31
20
39
Aug
57
34
22
44
Sep
54
38
23
42
Oct
58
39
27
49
Nov
70
57
47
66
Dec
80
73
56
77
Maximum
Day:Hour
100
1:10
100
16:01
100
8:12
89
7:07
93
21:22
90
9:07
80
19:04
81
31:04
90
28:06
93
14:12
100
13:08
100
20:14
Minimum
Day:Hour
15
25:13
12
26:14
10
1:13
15
3:16
5
6:16
6
2:16
5
13:13
11
8:15
7
8:15
8
5:14
10
2:14
15
11:13
- Monthly Indicators for Precipitation/Moisture (kPa)
Jan
Feb
Mar
Apr
May
Jun
0.8
0.7
0.9
0.9
0.9
1.0
Jul
1.0
Aug
1.1
Sep
0.9
Oct
0.8
Nov
0.8
Dec
0.8
4/23/05
22
WEATHER CONVERTER PROGRAM
REPORTS/FILES PRODUCED BY THE WEATHER CONVERTER
- Monthly Statistics for Solar Wh/m²
Jan
Feb
Mar
Apr
Direct Avg
2587
3868
4934
6992
May
8206
Jun
8832
Jul
10020
Aug
8917
Sep
7883
Oct
5853
Nov
3491
Dec
2351
Direct Max
Day
5653
5
8231
28
9156
23
10173
30
11433
6
11424
11
10752
13
9893
8
9286
8
7691
11
6840
1
5601
22
833
1043
1538
1893
2072
2119
1800
1562
1203
1054
883
751
- Monthly Average Daily Wind Direction ° {N=0 or 360,E=90,S=180,W=270}
Jan
Feb
Mar
Apr
May
Jun
Jul
Aug
Sep
235
194
205
222
196
185
179
194
196
Oct
239
Nov
224
Dec
194
Diffuse Avg
- Maximum Direct Solar of 11433 Wh/m² on May
- Monthly Statistics for Wind Speed m/s
Jan
Feb
Mar
Apr
Maximum
13.4
19.6
17.5
19.6
Day:Hour
28:22
14:16
9:05
9:13
6
May
11.3
12:19
Jun
11.3
27:10
Jul
9.3
8:16
Aug
10.8
18:22
Sep
14.4
28:14
Oct
12.4
18:06
Nov
16.5
20:14
Dec
16.0
17:03
Minimum
Day:Hour
0.0
7:01
0.0
7:02
0.0
3:20
0.0
16:01
0.0
1:01
0.0
17:22
0.0
3:01
0.0
4:04
0.0
3:03
0.0
4:16
0.0
3:19
0.0
7:18
Daily Avg
3.8
5.4
3.9
4.2
3.7
4.1
3.7
3.6
3.6
4.1
4.0
4.0
- Monthly Calculated "undisturbed" Ground Temperatures** °C
Jan
Feb
Mar
Apr
May
Jun
Jul
0.5 m
-7.4
-8.7
-6.4
-2.8
6.5
13.7
18.6
2.0 m
-2.7
-5.0
-4.5
-2.6
3.6
9.3
13.8
4.0 m
1.2
-1.1
-1.6
-0.9
2.6
6.4
9.9
Aug
20.0
16.2
12.3
Sep
17.5
15.7
12.9
Oct
11.9
12.5
11.5
Nov
4.5
7.4
8.5
Dec
-2.5
1.9
4.8
- Maximum Wind Speed of
- Minimum Wind Speed of
19.6 m/s on Feb 14
0.0 m/s on Jan 7
- **These ground temperatures should
floor losses.
The temperatures for 0.5 m depth
The temperatures for 4.0 m depth
Calculations use a standard soil
NOT BE USED in the GroundTemperatures object to compute building
can be used for GroundTemperatures:Surface.
can be used for GroundTemperatures:Deep.
diffusivity of 2.3225760E-03 {m**2/day}
As noted in the above statistics calculation, the “undisturbed” ground temperatures calculated by the weather
converter should not be used in building losses but are appropriate to be used in the
GroundTemperatures:Surface and GroundTemperatures:Deep objects. The reasoning (for building losses) is
that these values are too extreme for the soil under a conditioned building. For best results, use the Slab or
Basement program described in this document to calculate custom monthly average ground temperatures (see
the Ground Heat Transfer section). This is especially important for residential applications and very small
buildings. If one of these ground temperature preprocessors is not used, for typical commercial buildings in the
USA, a reasonable default value is 2C less than the average indoor space temperature.
And then the Köppen, ASHRAE and typical/extreme period calculations:
4/23/05
23
WEATHER CONVERTER PROGRAM
REPORTS/FILES PRODUCED BY THE WEATHER CONVERTER
- Climate type "BSk" (Köppen classification)
- Mid-latitude dry semiarid (e.g. Great Plains of USA, lat. 15-60°N)
- Unbearably hot dry periods in summer, but passive cooling is possible
- Monthly Statistics for Dry Bulb temperatures °C
Jan
Feb
Mar
Apr
Daily Avg
10.7
9.6
11.4
Maximum
17
17
18.8
Minimum
3.6
2.8
4
- Maximum Dry Bulb temperature of 36.0°C on Aug 1
- Minimum Dry Bulb temperature of 1.0°C on Dec 12
May
15.1
25
4.6
Jun
19.7
33.4
9
Jul
24.6
35.8
14.6
Aug
27.3
35
20.4
Sep
27.2
36
20
Oct
23.7
34
15
Nov
19.1
28
12
Dec
14.5
22.2
5.9
11.2
19.2
1
- Climate type "5B" (ASHRAE/90.1 classification)
- Mid-latitude dry semiarid (e.g. Great Plains of USA, lat. 15-60°N)
- Typical/Extreme Period Determination
- Summer is
Extreme
Extreme
Typical
Typical
Jun:Aug
Summer Week (nearest maximum temperature for summer)
Hot Week Period selected: Jul 13:Jul 19, Maximum Temp= 36.70°C, Deviation=|11.068|°C
Summer Week (nearest average temperature for summer)
Week Period selected: Aug 17:Aug 23, Average Temp= 20.89°C, Deviation=| 0.541|°C
- Winter is
Extreme
Extreme
Typical
Typical
Dec:Feb
Winter Week (nearest minimum temperature for winter)
Cold Week Period selected: Dec 8:Dec 14, Minimum Temp= -23.30°C, Deviation=|14.529|°C
Winter Week (nearest average temperature for winter)
Week Period selected: Jan 27:Feb 2, Average Temp= -0.71°C, Deviation=| 0.603|°C
- Autumn is Sep:Nov
Typical Autumn Week (nearest average temperature for autumn)
Typical Week Period selected: Oct 27:Nov 2, Average Temp= 10.38°C, Deviation=| 0.557|°C
- Spring is Mar:May
Typical Spring Week (nearest average temperature for spring)
Typical Week Period selected: Apr 5:Apr 11, Average Temp=
8.77°C, Deviation=| 0.463|°C
As this data is all tab-delimited, putting in a spreadsheet and displaying is not difficult:
And these can be easily used to produce graphs:
4/23/05
24
WEATHER CONVERTER PROGRAM
REPORTS/FILES PRODUCED BY THE WEATHER CONVERTER
Daily Dry Bulb Statistics
40
35
30
Degrees C
25
Daily Avg
Maximum
Minimum
20
15
10
5
0
Jan
Feb
Mar
Apr
May
Jun
Jul
Aug
Sep
Oct
Nov
Dec
Month
Figure 4. Graph of Spreadsheet Data
Design Day Calculations Output
Using the WMO field (or determining it from the WBAN field), the Weather Converter
performs table look up in the Design Condition files to see if there are recorded design
conditions for the subject location. If this location is found, then design day objects are
produced on the resultant design day object (ddy extension) file – ready for inclusion into an
EnergyPlus input data file. If no design conditions are located, then the design day object file
will still include a location object for inclusion with EnergyPlus. However, statistics using the
weather file are now displayed to the statistics file – these “can” be used to create your own
design day definitions but you should read the warning that is issued and take care if your
weather file is only a “single instance” weather data representation.
The location objects as well as the design condition objects are constrained by the data
source. Some data sources do not have elevation information – thus, a location object from
such a source will have an elevation of 0.0. Likewise, the time zone of some locations may
not be available from the source data nor other data resources that the weather converter
uses. A time zone will be estimated from the standard meridian of the location (determined
by the longitude) but it may not be accurate. A user needs to be aware of these limitations
when taking the design day files from the weather converter.
An excerpt of a design day output is shown in the following (actual design day objects have
been deleted for brevity):
4/23/05
25
WEATHER CONVERTER PROGRAM
REPORTS/FILES PRODUCED BY THE WEATHER CONVERTER
! The following Location and Design Day data are produced as possible from the weather data source.
! No special attempts at re-creating or determining missing data parts (e.g. Wind speed or direction)
! are done. Therefore, you should look at the data and fill in any incorrect values as you desire.
Location,
Ottawa Int'l_ON_CAN
45.32000
,
-75.67000
,
-5.000000
,
114.0000
;
WYEC2-B-04772,
!- Location Name
!- Latitude {N+ S-}
!- Longitude {W- E+}
!- Time Zone Relative to GMT {GMT+/-}
!- Elevation {m}
! Using Design Conditions from "Canada Climate Design Data 2001 ASHRAE Handbook"
! Ottawa Int'l_ON_CAN Heating 99.6%, MaxDB= -24.80 Wind Speed=
3.90 Wind Dir= 290.00
! Ottawa Int'l_ON_CAN Heating 99%, MaxDB= -22.20 Wind Speed=
! Ottawa Int'l_ON_CAN Cooling (DB=>MWB) .4%, MaxDB=
4.50 Wind Dir= 250.00
30.10 MWB=
21.30
! Ottawa Int'l_ON_CAN Cooling (DB=>MWB) 1%, MaxDB=
28.50 MWB=
20.50
! Ottawa Int'l_ON_CAN Cooling (DB=>MWB) 2%, MaxDB=
26.80 MWB=
19.50
! Ottawa Int'l_ON_CAN Cooling (WB=>MDB) .4%, MDB=
28.00 WB=
22.80
! Ottawa Int'l_ON_CAN Cooling (WB=>MDB) 1%, MDB=
26.40 WB=
21.80
! Ottawa Int'l_ON_CAN Cooling (WB=>MDB) 2%, MDB=
25.30 WB=
20.80
! Ottawa Int'l_ON_CAN Cooling (DP=>MDB) .4%, MDB=
25.50 DP=
21.10 HR=
0.02
! Ottawa Int'l_ON_CAN Cooling (DP=>MDB) 1%, MDB=
24.60 DP=
20.20 HR=
0.02
! Ottawa Int'l_ON_CAN Cooling (DP=>MDB) 2%, MDB=
23.70 DP=
19.20 HR=
0.01
Design day “definitions” originate in the ASHRAE Handbook of Fundamentals. Prior to 1997,
these conditions were described for winter and summer (heating and cooling). They were
based on seasonal percentages.
Beginning in 1997, and continuing (the latest version was published in 2001), the design
condition data is based on annual percentages. In addition, only locations with long-term
hourly observations data (on which to form the basis) are included.
[From ASHRAE Handbook of Fundamentals, 2001]:
4/23/05
Heating conditions are often used in the sizing of heating equipment. In cold spells, drybulb temperatures below the design conditions can last for a week or more.
The first cooling conditions, based on dry-bulb temperatures (i.e., DB=>MWB), often
represent conditions on hot, mostly sunny days. These are useful for cooling
applications, especially air-conditioning.
Design conditions based on wet-bulb temperatures (i.e., WB=>MDB) represent extremes
of the total sensible plus latent heat of outdoor air. This information is useful for cooling
towers, evaporative coolers, and fresh air ventilation system design.
Design conditions based on dew-point temperatures (i.e., DP=>MDB) are directly related
to extremes of humidity ratio, which represent peak moisture loads from the weather.
Extreme dew-point conditions may occur on days with moderate dry-bulb temperatures
resulting in relatively high humidity. These values are especially useful for applications
involving humidity control, such as desiccant cooling and dehumidification, cooling-based
dehumidification, and fresh air ventilation systems. These values are also used as a
checkpoint when analyzing the behavior of cooling systems at part load conditions,
particularly when such systems are used for humidity control as a secondary function.
26
WEATHER CONVERTER PROGRAM
KÖPPEN CLIMATE CLASSIFICATION
Köppen Climate Classification
Various attempts have been made to classify the climates of the earth into climatic regions.
One notable, yet ancient and misguided example is that of Aristotle's Temperate, Torrid, and
Frigid Zones. However, the 20th century classification developed by German climatologist
and amateur botanist Wladimir Köppen (1846-1940) continues to be the authoritative map of
the world climates in use today.
Introduced in 1928 as a wall map co-authored with student Rudolph Geiger, the Köppen
system of classification (map) was updated and modified by Köppen until his death. Since
that time, it has been modified by several geographers.
The modified Köppen Climate Classification System is the most widely used system for
classifying the world's climates. Its categories are based on the annual and monthly averages
of temperature and precipitation. The Köppen system recognizes six major climatic types;
each type is designated by a capital letter.
In addition to the major climate types, each category is further sub-divided into subcategories based on temperature and precipitation. There are only 24 sub-categories
possible – making the general schemes quite easy to comprehend.
For example, the U.S. states located along the Gulf of Mexico are designated as "Cfa." The
"C" represents the "mild mid-latitude" category, the second letter "f" stands for the German
word feucht or "moist," and the third letter "a" indicates that the average temperature of the
warmest month is above 22°C. Thus, "Cfa" gives us a good indication of the climate of this
region, a mild mid-latitude climate with no dry season and a hot summer.
The Köppen classification code (and some statistics) was adapted (with permission of Peter
Schild) from the COMIS weather program code.
Table 7. Köppen Climate Classification -- Major Groups
Köppen
Climate Type
Description
A
Tropical Moist Climates: all months have average temperatures above 18
degrees Celsius
B
Dry Climates: with deficient precipitation during most of the year
C
Moist Mid-latitude Climates with Mild Winters
D
Moist Mid-Latitude Climates with Cold Winters
E
Polar Climates: with extremely cold winters and summers
H
Highland areas: Due to mountainous areas, this classification can
encompass any of the previous five.
More details on each of the major categories and sub-categories follow:
Tropical Moist Climates (A)
Tropical moist climates extend northward and southward from the equator to about 15 to 25
degrees of latitude. In these climates all months have average temperatures greater than 18
degrees Celsius. Annual precipitation is greater than 1500 mm. Three minor Köppen climate
types exist in the A group and their designation is based on seasonal distribution of rainfall.
Af or tropical wet is a tropical the climate where precipitation occurs all year long. Monthly
temperature variations in this climate are less than 3 degrees Celsius. Because of intense
surface heating and high humidity cumulus and cumulonimbus clouds form early in the
afternoons almost every day. Daily highs are about 32 degrees Celsius while night time
4/23/05
27
WEATHER CONVERTER PROGRAM
KÖPPEN CLIMATE CLASSIFICATION
temperatures average 22 degrees Celsius. Am is a tropical monsoon climate. Annual rainfall
is equal to or greater than Af, but falls in the 7 to 9 hottest months. During the dry season
very little rainfall occurs. The tropical wet and dry or savanna (Aw) has an extended dry
season during winter. Precipitation during the wet season is usually less than 1000
millimeters and only during the summer season.
Dry Climates (B)
The most obvious climatic feature of these climates is potential evaporation and transpiration
exceeds precipitation. These climates extend from 20 - 35 degrees North and South of the
equator and in large continental regions of the mid-latitudes often surrounded by mountains.
Minor types of this climate include: Bw - dry arid (desert) is a true desert climate. It covers 12
% of the earth's land surface and is dominated by xerophytic vegetation. Bs - dry semiarid
(steppe) is a grassland climate that covers 14% of the earth's land surface. It receives more
precipitation than the Bw either from the inter-tropical convergence zone or from mid-latitude
cyclones.
Moist Subtropical Mid-Latitude Climates (C)
This climate generally has warm and humid summers with mild winters. Its extent is from 30
to 50 degrees of latitude mainly on the eastern and western borders of most continents.
During the winter the main weather feature is the mid-latitude cyclone. Convective
thunderstorms dominate summer months. Three minor types exist: Cfa - humid subtropical;
Cs - mediterranean; and Cfb - marine. The humid subtropical climate (Cfa) has hot muggy
summers and mainly thunderstorms. Winters are mild and precipitation during this season
comes from mid-latitude cyclones. A good example of a Cfa climate is the southeastern USA.
Cfb, marine, climates are found on the western coasts of continents. They have a humid
climate with short dry summer. Heavy precipitation occurs during the mild winters because of
continuous presence of mid-latitude cyclones. Mediterranean climates (Cs) receive rain
primarily during winter season from the mid-latitude cyclone. Extreme summer aridity is
caused by the sinking air of the subtropical highs and may exist for up to 5 months. Locations
in North America are from Portland, Oregon to all of California.
Moist Continental Mid-latitude Climates (D)
Moist continental mid-latitude climates have warm to cool summers and cold winters. The
location of these climates is pole ward of the C climates. The warmest month is greater than
10º C, while the coldest month is less than -30º C. Winters are severe with snowstorms,
strong winds, bitter cold from Continental Polar or Arctic air masses. Like the C climates there
are three minor types: Dw - dry winters; Ds - dry summers; and Df - wet all seasons.
Polar Climates (E)
Polar climates have year-round cold temperatures with warmest month less than 10º C. Polar
climates are found on the northern coastal areas of North America and Europe, Asia and on
the landmasses of Greenland and Antarctica. Two minor climate types exist. ET or polar
tundra is a climate where the soil is permanently frozen to depths of hundreds of meters, a
condition known as permafrost. Vegetation is dominated by mosses, lichens, dwarf trees and
scattered woody shrubs. EF or polar ice caps has a surface that is permanently covered with
snow and ice.
Highlands Areas (H)
Highland areas can encompass any of the previously mentioned major categories –- the
determining factor is one of altitude (temperature decreases roughly 2º C for every increase
of 305 m). This is a complex climate zone. Highland regions roughly correspond to the
major categories change in temperature with latitude – with one important exception.
4/23/05
28
WEATHER CONVERTER PROGRAM
KÖPPEN CLIMATE CLASSIFICATION
Seasons only exist in highlands if they also exist in the nearby lowland regions. For example,
although A climates have cooler temperatures at higher elevations, the seasonal changes of
C, D and E climates are not present.
The following shows an overview of the world and its Köppen classifications.
Figure 5. World viewed as Köppen Climate Zones
And a more basic view with monthly dry bulb temperature and dew point temperatures for
these zones (Northern Hemisphere).
4/23/05
29
WEATHER CONVERTER PROGRAM
KÖPPEN CLIMATE CLASSIFICATION
Monthly DB Temperatures for 20 Locations Using Koppen Climate Classification System
40
Monthly Average Dry-Bulb Temperature (C)
30
20
10
Af
Am
Aw
BSh
BSk
BWh
Cfa
Cfb
Cfc
Csa
Csb
Dfa
Dfb
Dfc
Dwa
Dwb
Dwc
Dwd
ET
H
0
Jan
Feb
Mar
Apr
May
Jun
Jul
Aug
Sep
Oct
Nov
Dec
-10
-20
-30
-40
-50
Figure 6. Monthly Dry Bulb Temperatures in Köppen Climates (Northern Hemisphere)
Monthly DP Temperatures for 20 Locations Using Koppen Climate Classification System
30
Monthly Average Dewpoint Temperature (C)
20
10
0
Jan
Feb
Mar
Apr
May
Jun
Jul
Aug
Sep
Oct
Nov
Dec
Af
Am
Aw
BSh
BSk
BWh
Cfa
Cfb
Cfc
Csa
Csb
Dfa
Dfb
Dfc
Dwa
Dwb
Dwc
Dwd
ET
H
-10
-20
-30
-40
-50
Figure 7. Monthly Dew Point in Köppen Climates (Northern Hemisphere)
4/23/05
30
WEATHER CONVERTER PROGRAM
ASHRAE CLIMATE CLASSIFICATION
ASHRAE Climate Classification
For the ASHRAE 90.1 and 90.2 standards (2004), a climate zone classification scheme was
introduced, similar to the Köppen classification. The methodology is described in two
ASHRAE Transactions papers – Briggs – 2002.
EnergyPlus Weather File (EPW) Data Dictionary
The “data dictionary” for EnergyPlus Weather Data is shown below. Note that semi-colons
do NOT terminate lines in the EnergyPlus Weather Data.
Note that in the header records where “date” is used, the interpretation is shown in the
following table.
Table 8. Weather File Date Field Interpretation
Field Contents
Interpretation
<number>
<number> / <number>
<number> Month
Month <number>
<number> Weekday in
Month
Last Weekday In Month
Julian Day of Year
Month / Day
Day and Month
Day and Month
Numbered weekday of month
Header Applicability
All date fields
All date fields
All date fields
All date fields
Holiday,
DaylightSavingPeriod
Last weekday of month
Holiday,
DaylightSavingPeriod
In the table, Month can be one of (January, February, March, April, May, June, July, August,
September, October, November, December). Abbreviations of the first three characters are
also valid.
In the table, Weekday can be one of (Sunday, Monday, Tuesday, Wednesday, Thursday,
Friday, Saturday). Abbreviations of the first three characters are also valid.
!ESP(r)/EnergyPlus Weather Format
!April 2002
\memo Dates in the EPW file can be several formats:
\memo <number>/<number> (month/day)
\memo <number> Month
\memo Month <number>
\memo <number> (taken to be Julian day of year)
\memo Months are January, February, March, April, May,
\memo
June, July, August, September, October, November, December
\memo Months can be the first 3 letters of the month
4/23/05
31
WEATHER CONVERTER PROGRAM
ENERGYPLUS WEATHER FILE (EPW) DATA DICTIONARY
LOCATION,
A1, \field city
\type alpha
A2, \field State Province Region
\type alpha
A3, \field Country
\type alpha
A4, \field Source
\type alpha
N1, \field WMO
\note usually a 6 digit field. Used as alpha in EnergyPlus
\type alpha
N2 , \field Latitude
\units deg
\minimum -90.0
\maximum +90.0
\default 0.0
\note + is North, - is South, degree minutes represented in decimal (i.e. 30 minutes is .5)
\type real
N3 , \field Longitude
\units deg
\minimum -180.0
\maximum +180.0
\default 0.0
\note - is West, + is East, degree minutes represented in decimal (i.e. 30 minutes is .5)
\type real
N4 , \field TimeZone
\units hr - not on standard units list???
\minimum -12.0
\maximum +12.0
\default 0.0
\note Time relative to GMT.
\type real
N5 ; \field Elevation
\units m
\minimum -1000.0
\maximum< +9999.9
\default 0.0
\type real
The Location header record duplicates the information required for the Location Object.
When only a Run Period object is used (i.e. a weather file), then the Location Object Is not
needed. When a Run Period and Design Day objects are entered, then the Location on the
weather file (as described previously) is used and overrides any Location Object entry.
DESIGN CONDITIONS,
N1, \field Number of Design Conditions
A1, \field Design Condition Source
\note current sources are ASHRAE HOF 2001 US Design Conditions, Canadian Design Conditions
\note and World Design Conditions
A2, \field Design Condition Type (HEATING)
\note fields here will be dependent on the source, they are shown in a header/data format
\note in both the .rpt and .csv files that are produced by the WeatherConverter program
...
An, \field Design Condition Type (COOLING)
\note same as note on Heating Design Conditions
The Design Conditions header record encapsulates matching (using WMO# -- World
Meteorological Organization Station Number) design conditions for a weather file location.
Currently only those design conditions contained in the ASHRAE Handbook of Fundamentals
2001 are contained in the weather files. These conditions can be used as desired. In
addition, Design Day definition files have been created of all World, Canada, and United
States Design Conditions. These files are available in the DataSet folder of the EnergyPlus
installation.
4/23/05
32
WEATHER CONVERTER PROGRAM
ENERGYPLUS WEATHER FILE (EPW) DATA DICTIONARY
TYPICAL/EXTREME PERIODS,
N1, \field Number of Typical/Extreme Periods
A1, \field Typical/Extreme Period 1 Name
A2, \field Typical/Extreme Period 1 Type
A3, \field Period 1 Start Day
A4, \field Period 1 End Day
\note repeat (A1-A3) until number of typical periods
-- etc to # of periods entered
Using a heuristic method, the weather converter can determine typical and extreme weather
periods for full year weather files. These will then be shown on the Typical/Extreme Periods
header record. These are also reported in the statistical report output from the Weather
Converter.
GROUND TEMPERATURES,
N1, Number of Ground Temperature Depths
N2, \field Ground Temperature Depth 1
\units m
N3, \field Depth 1 Soil Conductivity
\units W/m-K,
N4, \field Depth 1 Soil Density
\units kg/m3
N5, \field Depth 1 Soil Specific Heat
\units J/kg-K,
N6, \field Depth 1 January Average Ground Temperature
\units C
N7, \field Depth 1 February Average Ground Temperature
\units C
N8, \field Depth 1 March Average Ground Temperature
\units C
N9, \field Depth 1 April Average Ground Temperature
\units C
N10, \field Depth 1 May Average Ground Temperature
\units C
N11, \field Depth 1 June Average Ground Temperature
\units C
N12, \field Depth 1 July Average Ground Temperature
\units C
N13, \field Depth 1 August Average Ground Temperature
\units C
N14, \field Depth 1 September Average Ground Temperature
\units C
N15, \field Depth 1 October Average Ground Temperature
\units C
N16, \field Depth 1 November Average Ground Temperature
\units C
N17, \field Depth 1 December Average Ground Temperature
\units C
\note repeat above (N2-N17) to number of ground temp depths indicated
-- etc to # of depths entered
The weather converter program can use a full year weather data file to calculate
“undisturbed” ground temperatures based on temperatures. Since an important part of soil
heat transfer includes soil properties such as conductivity, density and specific heat AND
these cannot be calculated from simple weather observations, this header record is provided
for user information.
As noted in the statistics report, the “undisturbed” ground temperatures calculated by the weather converter
should not be used in building losses but are appropriate to be used in the GroundTemperatures:Surface and
GroundTemperatures:Deep objects. The reasoning (for building losses) is that these values are too extreme for
the soil under a conditioned building. For best results, use the Slab or Basement program described in this
document to calculate custom monthly average ground temperatures (see the Ground Heat Transfer section).
This is especially important for residential applications and very small buildings. If one of these ground
temperature preprocessors is not used, for typical commercial buildings in the USA, a reasonable default value
is 2C less than the average indoor space temperature.
4/23/05
33
WEATHER CONVERTER PROGRAM
ENERGYPLUS WEATHER FILE (EPW) DATA DICTIONARY
HOLIDAYS/DAYLIGHT SAVING,
A1, \field LeapYear Observed
\type choice
\key Yes
\key No
\note Yes if Leap Year will be observed for this file
\note No if Leap Year days (29 Feb) should be ignored in this file
A2, \field Daylight Saving Start Day
A3, \field Daylight Saving End Day
N1, \field Number of Holidays (essentially unlimited)
A4, \field Holiday 1 Name
A5, \field Holiday 1 Day
\note repeat above two fields until Number of Holidays is reached
-- etc to # of Holidays entered
The Holidays / Daylight Saving header record details the start and end dates of Daylight
Saving Time and other special days such as might be recorded for the weather file. These
can be used by keying “Yes” for appropriate fields in the Run Period Object.
Note: EnergyPlus processed weather files available on the EnergyPlus web site:
http://www.energyplus.gov/weatherdata.html have neither special days specified nor daylight saving
period.
For example, using a RunPeriod:
RunPeriod,
1,
1,
12,
31,
Wednesday,
Yes,
No,
Yes,
Yes,
Yes;
!!!!!!!!!!-
Begin Month
Begin Day Of Month
End Month
End Day Of Month
Day Of Week For Start Day
Use WeatherFile Holidays/Special Days
Use WeatherFile DaylightSavingPeriod
Apply Weekend Holiday Rule
Use WeatherFile Rain Indicators
Use WeatherFile Snow Indicators
Will use any holidays specified in the Holidays / Daylight Saving header record of the weather
file but will not use the Daylight Saving Period that is specified there (if any). In addition, the
user can specify Special Day Periods via the Special Day Period object and/or Daylight
Saving Period via the Daylight Saving Period object to additionally specify these items.
COMMENTS 1, A1 \field Comments_1
COMMENTS 2, A1 \field Comments_2
The Comment header records may provide additional information about the weather data
source or other information which may not fit in other header record formats.
4/23/05
34
WEATHER CONVERTER PROGRAM
ENERGYPLUS WEATHER FILE (EPW) DATA DICTIONARY
DATA PERIODS,
N1, \field Number of Data Periods
N2, \field Number of Records per hour
A1, \field Data Period 1 Name/Description
A2, \field Data Period 1 Start Day of Week
\type choice
\key Sunday
\key Monday
\key Tuesday
\key Wednesday
\key Thursday
\key Friday
\key Saturday
A3, \field Data Period 1 Start Day
A4, \field Data Period 1 End Day
\note repeat above to number of data periods
-- etc to # of periods entered
A weather file may contain several “data periods” though this is not required (and, in fact,
may be detrimental). In addition, a weather file may contain multiple records per hour BUT
these must match the Number of Time Steps In Hour for the simulation. Multiple interval data
files can be valued when you want to be sure of the weather values for each time step (rather
than relying on “interpolated” weather data). A weather file may also contain several
consecutive years of weather data. EnergyPlus will automatically process the extra years
when the Number of Years field is used in the RunPeriod object. Sorry – there is no way to
jump into a year in the middle of the EPW file.
Note that a Run Period object may not cross Data Period boundary lines.
For those interested in creating their own weather data or reading the .csv and .epw files that
are produced by the Weather Converter program, the fields are shown in the following “IDD”
description. Items shown in bold are used directly in the EnergyPlus program.
4/23/05
35
WEATHER CONVERTER PROGRAM
ENERGYPLUS WEATHER FILE (EPW) DATA DICTIONARY
! Actual data does not have a descriptor
N1, \field Year
N2, \field Month
N3, \field Day
N4, \field Hour
N5, \field Minute
A1, \field Data Source and Uncertainty Flags
\memo Initial day of weather file is checked by EnergyPlus for validity (as shown below)
\memo Each field is checked for "missing" as shown below. Reasonable values or the last
\memo "good" value is substituted.
N6, \field Dry Bulb Temperature
\units C
\minimum> -70
\maximum< 70
N7, \field Dew Point Temperature
\units C
\minimum> -70
\maximum< 70
N8, \field Relative Humidity
\missing 999.
\minimum 0
\maximum 110
N9, \field Atmospheric Station Pressure
\units Pa
\missing 999999.
\minimum> 31000
\maximum< 120000
N10, \field Extraterrestrial Horizontal Radiation
\units Wh/m2
\missing 9999.
N11, \field Extraterrestrial Direct Normal Radiation
\units Wh/m2
\missing 9999.
N12, \field Horizontal Infrared Radiation Intensity
\units Wh/m2
\missing 9999.
N13, \field Global Horizontal Radiation
\units Wh/m2
\missing 9999.
N14, \field Direct Normal Radiation
\units Wh/m2
\missing 9999.
\minimum 0
N15, \field Diffuse Horizontal Radiation
\units Wh/m2
\missing 9999.
\minimum 0
4/23/05
36
WEATHER CONVERTER PROGRAM
ENERGYPLUS WEATHER FILE (EPW) DATA DICTIONARY
N16, \field Global Horizontal Illuminance
\units lux
\missing 999999.
\note will be missing if >= 999900
N17, \field Direct Normal Illuminance
\units lux
\missing 999999.
\note will be missing if >= 999900
N18, \field Diffuse Horizontal Illuminance
\units lux
\missing 999999.
\note will be missing if >= 999900
N19, \field Zenith Luminance
\units Cd/m2
\missing 9999.
\note will be missing if >= 9999
N20, \field Wind Direction
\units degrees
\missing 999.
\minimum 0
\maximum 360
N21, \field Wind Speed
\units m/s
\missing 999.
\minimum 0
\maximum 40
N22, \field Total Sky Cover (used if Horizontal IR Intensity missing)
\missing 99
N23, \field Opaque Sky Cover (used if Horizontal IR Intensity missing)
\missing 99
N24, \field Visibility
\units km
\missing 9999
N25, \field Ceiling Height
\units m
\missing 99999
N26, \field Present Weather Observation
N27, \field Present Weather Codes
N28, \field Precipitable Water
\units mm
\missing 999
N29, \field Aerosol Optical Depth
\units thousandths
\missing .999
N30, \field Snow Depth
\units cm
\missing 999
N31; \field Days Since Last Snowfall
\missing 99
Data Field Descriptions
Field: Year
This is the Year of the data. Not really used in EnergyPlus.
Field: Month
This is the month (1-12) for the data.
Field: Day
This is the day (dependent on month) for the data.
Field: Hour
This is the hour of the data. (1 – 24). Hour 1 is 00:01 to 01:00.
4/23/05
37
WEATHER CONVERTER PROGRAM
ENERGYPLUS WEATHER FILE (EPW) DATA DICTIONARY
Field: Minute
This is the minute field. (1..60)
Field: Data Source and Uncertainty Flags
The data source and uncertainty flags from various formats (usually shown with each field)
are consolidated in the E/E+ EPW format. More is shown about Data Source and Uncertainty
in
Data Sources/Uncertainty section later in this document.
Field: Dry Bulb Temperature
This is the dry bulb temperature in C. Note that this is a full numeric field (i.e. 23.6) and not
an integer representation with tenths. Valid values range from –70 °C to 70 °C.
Field: Dew Point Temperature
This is the dew point temperature in C. Note that this is a full numeric field (i.e. 23.6) and not
an integer representation with tenths. Valid values range from –70 °C to 70 °C.
Field: Relative Humidity
This is the Relative Humidity in percent. Valid values range from 0% to 110%.
Field: Atmospheric Station Pressure
This is the station pressure in Pa. Valid values range from 31,000 to 120,000. (These values
were chosen from the “standard barometric pressure” for all elevations of the World).
Field: Extraterrestrial Horizontal Radiation
This is the Extraterrestrial Horizontal Radiation in Wh/m2.
EnergyPlus calculations.
It is not currently used in
Field: Extraterrestrial Direct Normal Radiation
This is the Extraterrestrial Direct Normal Radiation in Wh/m2. It is not currently used in
EnergyPlus calculations.
Field: Horizontal Infrared Radiation Intensity
This is the Horizontal Infrared Radiation Intensity in Wh/m2. If it is missing, it is calculated
from the Total and Opaque Sky Cover fields.
Field: Global Horizontal Radiation
This is the Global Horizontal Radiation in Wh/m2. It is not currently used in EnergyPlus
calculations.
Field: Direct Normal Radiation
This is the Direct Normal Radiation in Wh/m2. If the field is “missing (≥ 9999)” or invalid (<0),
it is set to 0. Counts of such missing values are totaled and presented at the end of the
runperiod.
4/23/05
38
WEATHER CONVERTER PROGRAM
ENERGYPLUS WEATHER FILE (EPW) DATA DICTIONARY
Field: Diffuse Horizontal Radiation
This is the Diffuse Horizontal Radiation in Wh/m2. If the field is “missing (≥ 9999)” or invalid
(<0), it is set to 0. Counts of such missing values are totaled and presented at the end of the
runperiod.
Field: Global Horizontal Illuminance
This is the Global Horizontal Illuminance in lux.
calculations.
It is not currently used in EnergyPlus
Field: Direct Normal Illuminance
This is the Direct Normal Illuminance in lux.
calculations.
It is not currently used in EnergyPlus
Field: Diffuse Horizontal Illuminance
This is the Diffuse Horizontal Illuminance in lux.
calculations.
It is not currently used in EnergyPlus
Field: Zenith Luminance
This is the Zenith Illuminance in Cd/m2. It is not currently used in EnergyPlus calculations.
Field: Wind Direction
This is the Wind Direction in degrees where the convention is that North=0.0, East=90.0,
South=180.0, West=270.0. Values can range from 0 to 360.
Field: Wind Speed
This is the wind speed in m/sec. Values can range from 0 to 40.
Field: Total Sky Cover
This is the value for total sky cover (tenths of coverage). (i.e. 1 is 1/10 covered. 10 is total
coverage). This is not used unless the field for Horizontal Infrared Radiation Intensity is
missing and then it is used along with Opaque Sky Cover to calculate Horizontal Infrared
Radiation Intensity.
Field: Opaque Sky Cover
This is the value for opaque sky cover (tenths of coverage). (i.e. 1 is 1/10 covered. 10 is total
coverage). This is not used unless the field for Horizontal Infrared Radiation Intensity is
missing and then it is used along with Total Sky Cover to calculate Horizontal Infrared
Radiation Intensity.
Field: Visibility
This is the value for visibility in km. It is not currently used in EnergyPlus calculations.
Field: Ceiling Height
This is the value for ceiling height in m. It is not currently used in EnergyPlus calculations.
Field: Present Weather Observation
If the value of the field is 0, then the observed weather codes are taken from the following
field. If the value of the field is 9, then “missing” weather is assumed. Since the primary use
4/23/05
39
WEATHER CONVERTER PROGRAM
ENERGYPLUS WEATHER FILE (EPW) DATA DICTIONARY
of these fields (Present Weather Observation and Present Weather Codes) is for rain/wet
surfaces, a missing observation field or a missing weather code implies “no rain”.
Table 9. Present Weather Observation Values
Element
Values
Observation Indicator
0 or 9
Definition
0 = Weather observation made;
9 = Weather observation not made, or missing
Field: Present Weather Codes
The present weather codes field is assumed to follow the TMY2 conventions for this field.
Note that though this field may be represented as numeric (e.g. in the CSV format), it is really
a text field of 11 single digits. This convention along with values for each “column” (left to
right) is presented in Table 10. Note that some formats (e.g. TMY) does not follow this
convention – as much as possible, the present weather codes are converted to this
convention during WeatherConverter processing. Also note that the most important fields are
those representing liquid precipation – where the surfaces of the building would be wet.
EnergyPlus uses “Snow Depth” to determine if snow is on the ground.
Table 10. Weather Codes Field Interpretation
Column
-Position
in Field
4/23/05
Element
Description
Possible
Values
Definition
0 = Thunderstorm—lightning and thunder.
Wind gusts less than 25.7 m/s, and hail, if any,
less than 1.9 cm diameter
1 = Heavy or severe thunderstorm—frequent
intense lightning and thunder. Wind gusts
greater than 25.7 m/s and hail, if any, 1.9 cm or
greater diameter
2 = Report of tornado or waterspout
4 = Moderate squall—sudden increase of wind
speed by at least 8.2 m/s, reaching 11.3 m/s or
more and lasting for at least 1 minute
6 = Water spout (beginning January 1984)
7 = Funnel cloud (beginning January 1984)
8 = Tornado (beginning January 1984)
9 = None if Observation Indicator element
equals 0, or else unknown or missing if
Observation Indicator element equals 9
0 = Light rain
1 = Moderate rain
2 = Heavy rain
3 = Light rain showers
4 = Moderate rain showers
5 = Heavy rain showers
6 = Light freezing rain
7 = Moderate freezing rain
8 = Heavy freezing rain
9 = None if Observation Indicator element
equals 0, or else unknown or missing if
1
Occurrence of
Thunderstorm,
Tornado, or
Squall
0 - 2, 4, 6
-9
2
Occurrence of
Rain, Rain
Showers, or
Freezing Rain
0-9
40
WEATHER CONVERTER PROGRAM
Column
-Position
in Field
4/23/05
Element
Description
ENERGYPLUS WEATHER FILE (EPW) DATA DICTIONARY
Possible
Values
3
Occurrence of
Rain Squalls,
Drizzle, or
Freezing Drizzle
0, 1, 3 - 9
4
Occurrence of
Snow, Snow
Pellets, or Ice
Crystals
0-9
5
Occurrence of
Snow Showers,
Snow Squalls, or
Snow Grains
0 - 7, 9
Definition
Observation Indicator element equals 9 Notes:
Light = up to 0.25 cm per hour Moderate = 0.28
to 0.76 cm per hour Heavy = greater than 0.76
cm per hour
0 = Light rain squalls
1 = Moderate rain squalls
3 = Light drizzle
4 = Moderate drizzle
5 = Heavy drizzle
6 = Light freezing drizzle
7 = Moderate freezing drizzle
8 = Heavy freezing drizzle
9 = None if Observation Indicator element
equals 0, or else unknown or missing if
Observation Indicator element equals 9
Notes: When drizzle or freezing drizzle occurs
with other weather phenomena: Light = up to
0.025 cm per hour Moderate = 0.025 to 0.051
cm per hour Heavy = greater than 0.051 cm
per hour
When drizzle or freezing drizzle occurs alone:
Light = visibility 1 km or greater Moderate =
visibility between 0.5 and 1 km Heavy =
visibility 0.5 km or less
0 = Light snow
1 = Moderate snow
2 = Heavy snow
3 = Light snow pellets
4 = Moderate snow pellets
5 = Heavy snow pellets
6 = Light ice crystals
7 = Moderate ice crystals
8 = Heavy ice crystals
9 = None if Observation Indicator element
equals 0, or else unknown or missing if
Observation Indicator element equals 9 Notes:
Beginning in April 1963, any occurrence of ice
crystals is recorded as a 7.
0 = Light snow
1 = Moderate snow showers
2 = Heavy snow showers
3 = Light snow squall
4 = Moderate snow squall
5 = Heavy snow squall
6 = Light snow grains
7 = Moderate snow grains
9 = None if Observation Indicator element
equals 0, or else unknown or missing if
Observation Indicator element equals 9
41
WEATHER CONVERTER PROGRAM
ENERGYPLUS WEATHER FILE (EPW) DATA DICTIONARY
Column
-Position
in Field
Element
Description
Possible
Values
Definition
8
Occurrence of
Sleet, Sleet
Showers, or Hail
0 - 2, 4, 9
9
Occurrence of
Fog, Blowing
Dust, or Blowing
Sand
0-9
10
Occurrence of
Smoke, Haze,
Smoke and
Haze, Blowing
Snow, Blowing
Spray, or Dust
0 - 7, 9
11
Occurrence of
Ice Pellets
0 - 2, 9
0 = Light ice pellet showers
1 = Moderate ice pellet showers
2 = Heavy ice pellet showers
4 = Hail
9 = None if Observation Indicator element
equals 0, or else unknown or missing if
Observation Indicator element equals 9
Notes: Prior to April 1970, ice pellets were
coded as sleet. Beginning in April 1970, sleet
and small hail were redefined as ice pellets and
are coded as 0, 1, or 2.
0 = Fog
1 = Ice fog
2 = Ground fog
3 = Blowing dust
4 = Blowing sand
5 = Heavy fog
6 = Glaze (beginning 1984)
7 = Heavy ice fog (beginning 1984)
8 = Heavy ground fog (beginning 1984)
9 = None if Observation Indicator element
equals 0, or else unknown or missing if
Observation Indicator element equals 9 Notes:
These values recorded only when visibility is
less than 11 km.
0 = Smoke
1 = Haze
2 = Smoke and haze
3 = Dust
4 = Blowing snow
5 = Blowing spray
6 = Dust storm (beginning 1984)
7 = Volcanic ash
9 = None if Observation Indicator element
equals 0, or else unknown or missing if
Observation Indicator element equals 9
Notes: These values recorded only when
visibility is less than 11 km.
0 = Light ice pellets
1 = Moderate ice pellets
2 = Heavy ice pellets
9 = None if Observation Indicator element
equals 0, or else unknown or missing if
Observation Indicator element equals 9
Field: Precipitable Water
This is the value for Precipitable Water in mm. It is not currently used in EnergyPlus
calculations (primarily due to the unreliability of the reporting of this value).
4/23/05
42
WEATHER CONVERTER PROGRAM
CSV FORMAT (IN/OUT)
Field: Aerosol Optical Depth
This is the value for Aerosol Optical Depth in thousandths.
EnergyPlus calculations .
It is not currently used in
Field: Snow Depth
This is the value for Snow Depth in cm. This field is used to tell when snow is on the ground
and, thus, the ground reflectance may change.
Field: Days Since Last Snowfall
This is the value for Days Since Last Snowfall.
calculations.
It is not currently used in EnergyPlus
CSV Format (In/Out)
For the “header” records in the CSV file, they are basically the same as the header records
for the EPW file (see above). However, in the CSV file, each header is shown and then the
data. Partial year files will not have all of these headers “filled” in.
Location Header/Data (CSV)
Location Title,Latitude {N+/S-},Longitude {E+/W-},TimeZone {+/- GMT},Elevation {m}
LOCATION_SYDNEY__AUS_IWEC Data_947670,-33.95,151.18,10.0,3.0
LOCATION + the city, state/province, country and WMO fields from the EPW file are
concatenated to form the “Location Title”. The latitude, longitude, time zone and elevation
fields are numeric.
Design Conditions Header/Data (CSV)
If there are design conditions, then the format is as follows:
Number of Design Conditions,Title of Design Condition,Design Stat,HDB 99.6%,HDB 99%,X WS 1%,X WS 2.5%,X WS
5%,CM WS .4%,CM MDB .4%,CM WS 1%,CM MDB 1%,MWS 99.6%,PWD 99.6%,MWS .4%,PWD .4%,X MnDB Max,X MnDB Min,X
StdDB Max,X StdDB Min,Design Stat,CDB .4%,C MWB .4%,CDB 1%,C MWB 1%,CDB 2%,C MWB 2%,E WB .4%,E MDB .4%,E
WB 1%,E MDB 1%,E WB 2%,E MDB 2%,DP .4%,HR .4%,MDB .4%,DP 1%,HR 1%,MDB 1%,DP 2%,HR 2%,MDB 2%,DB Range
,,Units,{°C},{°C},{m/s},{m/s},{m/s},{m/s},{°C},{m/s},{°C},{m/s},{Degree},{m/s},{Degree},{°C},{°C},{°C},{°C
},Units,{°C},{°C},{°C},{°C},{°C},{°C},{°C},{°C},{°C},{°C},{°C},{°C},{°C},{g/kg},{°C},{°C},{g/kg},{°C},{°C}
,{g/kg},{°C},{°C}
1,World Climate Design Data 2001 ASHRAE
Handbook,HEATING,5.8,6.8,11.3,9.9,8.8,11.1,14.2,9.1,13.4,1.1,320,5.3,300,39.3,3.1,2.9,1.9,COOLING,32.2,20,
29.5,19.7,27.9,20.1,23,28,22.3,26.2,21.7,25.3,21.7,16.4,24.8,21.1,15.8,24.3,20.6,15.3,23.9,6.7
However, if there are no design conditions, then the format looks like:
Number of Design Conditions,Title of Design Condition,
0
Theoretically, there can be more than one design condition included.
Typical/Extreme Periods Header/Data (CSV)
The results from the typical / extreme period heuristic calculation are shown.
4/23/05
43
WEATHER CONVERTER PROGRAM
CSV FORMAT (IN/OUT)
Number of Typical/Extreme Periods,Period Name,Period Type,Period Start Day,Period End Day,<repeat to #
periods>
6,Summer - Week Nearest Max Temperature For Period,Extreme,1/ 4,1/10,Summer - Week Nearest Average
Temperature For Period,Typical,11/29,12/ 5,Winter - Week Nearest Min Temperature For Period,Extreme,7/
3,7/ 9,Winter - Week Nearest Average Temperature For Period,Typical,6/ 5,6/11,Autumn - Week Nearest
Average Temperature For Period,Typical,3/22,3/28,Spring - Week Nearest Average Temperature For
Period,Typical,8/ 1,8/ 7
Ground Temperatures Header/Data (CSV)
The results from the ground temperature heuristic calculation are shown, typically for 3
depths. Users may also fill in the blank fields (soil conductivity, soil density, soil specific heat)
with known values and/or perform their own calculations and depths and supply those.
Number of Ground Temperature Depths,Ground Temperature Depth {m},Soil Conductivity {W/m-K},Soil Density
{kg/m3},Soil Specific Heat {J/kg-K},Jan {C},Feb{C},Mar {C},Apr {C},May {C},Jun {C},Jul {C},Aug {C},Sep
{C},Oct {C},Nov {C},Dec {C},<repeat to Number of temperature depths>
3,.5,,,,20.69,22.30,22.69,22.26,19.95,17.43,15.09,13.43,12.99,13.86,15.84,18.29,2,,,,19.18,20.71,21.41,21.
40,20.16,18.43,16.58,15.03,14.25,14.45,15.59,17.28,4,,,,18.18,19.38,20.10,20.30,19.82,18.80,17.56,16.35,15
.56,15.39,15.89,16.89
Holiday/Daylight Saving Header/Data (CSV)
If these data are entered, the weather converter will process them. Default weather
processing contains no holidays or daylight saving period. Of course, these can also be
specified in your input data file for EnergyPlus and do not need to be embedded in the
weather file.
Leap Year Observed?,Daylight Saving Start Date,Daylight Saving End Date,Number of Holidays,Holiday
Name,Holiday Date,<repeat for # Holidays>
No,0,0,0
Comment 1 Header/Data (CSV)
Some original data files fill the comment 1 header and some do not. Typically, it will display
at least a “station” number and potentially more information.
Comment Line #1
"IWEC- WMO#947670 - South-west Pacific -- Original Source Data (c) 2001 American Society of Heating,
Refrigerating and Air-Conditioning Engineers (ASHRAE), Inc., Atlanta, GA, USA. www.ashrae.org All rights
reserved as noted in the License Agreement and Additional Conditions. DISCLAIMER OF WARRANTIES: The data
is provided 'as is' without warranty of any kind, either expressed or implied. The entire risk as to the
quality and performance of the data is with you. In no event will ASHRAE or its contractors be liable to
you for any damages, including without limitation any lost profits, lost savings, or other incidental or
consequential damages arising out of the use or inability to use this data."
Comment 2 Header/Data (CSV)
Comment Line #2
-- Ground temps produced with a standard soil diffusivity of 2.3225760E-03 {m**2/day}
Data Period Header/Data (CSV)
Number of Data Periods [DP],Number of Intervals per Hour,DP Name/Description,DP Start Day of Week,DP Start
Day, DP End Day,<repeat to # Data Periods>
1,1,Data,Sunday, 1/ 1,12/31
Data Records (CSV)
The field “names” for each item are shown. First, the “short” names:
Date,HH:MM,Datasource,DryBulb {C},DewPoint {C},RelHum {%},Atmos Pressure {Pa},ExtHorRad {Wh/m2},ExtDirRad
{Wh/m2},HorIRSky {Wh/m2},GloHorRad {Wh/m2},DirNorRad {Wh/m2},DifHorRad {Wh/m2},GloHorIllum
{lux},DirNorIllum {lux},DifHorIllum {lux},ZenLum {Cd/m2},WindDir {deg},WindSpd {m/s},TotSkyCvr
{.1},OpaqSkyCvr {.1},Visibility {km},Ceiling Hgt {m},PresWeathObs,PresWeathCodes,Precip Wtr {mm},Aerosol
Opt Depth {.001},SnowDepth {cm},Days Last Snow
Then, the longer names:
4/23/05
44
WEATHER CONVERTER PROGRAM
MISSING WEATHER FILE DATA
Date,HH:MM,Datasource,Dry Bulb Temperature {C},Dew Point Temperature {C},Relative Humidity {%},Atmospheric
Pressure {Pa},Extraterrestrial Horizontal Radiation {Wh/m2},Extraterrestrial Direct Normal Radiation
{Wh/m2},Horizontal Infrared Radiation Intensity from Sky {Wh/m2},Global Horizontal Radiation
{Wh/m2},Direct Normal Radiation {Wh/m2},Diffuse Horizontal Radiation {Wh/m2},Global Horizontal Illuminance
{lux},Direct Normal Illuminance {lux},Diffuse Horizontal Illuminance {lux},Zenith Luminance {Cd/m2},Wind
Direction {deg},Wind Speed {m/s},Total Sky Cover {.1},Opaque Sky Cover {.1},Visibility {km},Ceiling Height
{m},Present Weather Observation,Present Weather Codes,Precipitable Water {mm},Aerosol Optical Depth
{.001},Snow Depth {cm},Days Since Last Snow
As noted previously, these headers and data are in the identical order to the items in the
EPW records. Then the data is shown:
1983/1/1,01:00,C9C9C9C9*0?9?9?9?9?9?9?9*0C8C8C8C8*0*0E8*0*0,26.2,19.2,65,101100,0,1415,412,0,0,0,0,0,0,0,1
80,6.5,9,7,23.3,77777,9,'999999999,0,0.2300,0,88
The Date and Time fields need a bit of description. The Date field (e.g. 1983/1/1) uses your
standard system date for formatting. In the EPW file, these are three separate fields (year,
month, and day in this example). The time field combines the hours and minutes into one
field (hh:mm). This makes it easier for graphing with spreadsheet programs but a bit harder if
you use the CSV format as input.
Each data item field obeys the same “missing” rules as shown above in the EPW data layout.
Missing Weather File Data
The following data contains “missing” descriptors; a new concept not introduced previously in
our IDD conventions. In this case, it will be processed as though those values are “missing”
in the weather conversions. This may not always be desirable though the weather processor
will fill in “missing” value with something “appropriate”. Eventually, these missing values will
be available through the weather processor. Until then, the following are used for initial
missing conditions. When a valid value is encountered from weather data, however, it will
become the new “missing” replacement value:
Table 11. Missing weather replacement values
Data item
Supplied Value
Units
Dry Bulb Temperature
6
C
Dew Point Temperature
3
C
Relative Humidity
50
%
Standard**
Barometric
Pressure
(altitude based)
Pa
Wind Speed
2.5
m/s
Wind Direction
180
Deg
Total Sky Cover
5
(tenths)
Opaque Sky Cover
5
(tenths)
Visibility
777.7
Km
Ceiling Height
77777
m
Precipitable Water
0
Mm
Aerosol Optical Depth
0
Broadband turbidity
Snow Depth
0
Cm
Days Since Last Snow
88
Days
Atmospheric Pressure
4/23/05
45
WEATHER CONVERTER PROGRAM
SOURCE WEATHER DATA FORMATS
Radiation Values (Direct/Diffuse)
0.0
Wh/m2
Illuminance Values
0.0
lux (or CD/m2)
**Standard Barometric pressure based on location elevation is taken from ASHRAE 2001
Handbook of Fundamentals, pages 6.1 & 6.2.
Source Weather Data Formats
Source weather data for building energy simulation programs can be broken into two major
classes: historical data and typical weather years. Historical data is just "real" data: usually
measured (but sometimes modeled) data from a particular location for a given period of
record. Typical years are ersatz years assembled to match the long term data from a
particular location using a particular statistical measure. Typical data may also be “real” data
but may not be a contiguous year – the data may be comprised of months from multiple
years.
The primary source for historical weather data is the U.S. National Climatic Data Center
(NCDC) in Asheville, NC: http://www.ncdc.noaa.gov/. NCDC can provide hourly historical
data for thousands of locations around the world. This data may not always be complete;
data items or periods of record may be missing.
Data Set vs. Data Format
In this document as well in many others, you will read about a certain “data set” and you will
also read about data in a “certain” format – e.g., the TMY2 data set and the TMY2 data
format. Simply stated, a data set refers to a set of data files developed around a set of
procedures for selection and usually with a specific purpose for use. A data format is merely
the identification of data elements in a data file. In the TMY2 example, the TMY2 data set
was developed as described below and the format of the data is usually called a TMY2
format.
Any data could be put into a TMY2 format, but it wouldn’t necessarily be selected using the
same procedures as the TMY2 data set.
SAMSON Data Set/Format
A highly reliable source of historical data for U.S. locations is the Solar and Meteorological
Surface Observational Network (SAMSON) data set assembled by the National Renewable
Energy Laboratory (NREL) in Golden, CO: http://www.nrel.gov/. The SAMSON data set
contains a 30 year (1961 to 1990) period of record for 239 locations and are available from
the NCDC.
SAMSON also describes a file format. Though no data from the SAMSON data set are
available for download in EPW format, the weather conversion utility can read and process
this file format.
TMY2 Data Set/Format
The TMY2 are data sets of hourly values of solar radiation and meteorological elements for a
1-year period. Their intended use is for computer simulations of solar energy conversion
systems and building systems to facilitate performance comparisons of different system
types, configurations, and locations in the United States and its territories. Because they
represent typical rather than extreme conditions, they are not suited for designing systems to
meet the worst-case conditions occurring at a location. The data are available from the
National Renewable Energy Laboratory for download or on CD.
All of the TMY2 data are available for download (in EPW format) from the EnergyPlus web
site.
4/23/05
46
WEATHER CONVERTER PROGRAM
SOURCE WEATHER DATA FORMATS
TMY3 Format
The TMY3 format is very similar to the TMY2 format except: WMO stations are used (6
character) in the header and 4 digit years have been adopted in the data lines.
WYEC2 Data Set/Format
Culminating in the early 1980s, ASHRAE published their “Weather Year for Energy
Calculations” (WYEC) hourly weather files for 51 US and Canadian locations. These files
were intended to support the then growing interest in computer simulation of energy use in
buildings. In the late 1980s, a major revision was initiated – this included the addition of 26
Typical Meteorological Year (TMY) hourly weather files to the original WYEC data set and a
number of improvements.
The work of revising and improving the WYEC data base was performed by at the National
Renewable Energy Laboratory (NREL) as part of the Solar Radiation Resource Assessment
Program (SRRAP), during the period 1989 through 1993. Richard Perez, at the State
University of New York at Albany -- Atmospheric Sciences Research Center provided a
substantial contribution to this work. The resulting set of 77 revised and corrected hourly
weather files are referred to as WYEC Version 2 or "WYEC2" data set.
The WYEC2 format is used as the format for several other data sets. The WYEC2 data set,
however, was not made available for download though, of course, those files can be read if
desired with the EnergyPlus Weather Converter utility.
Canadian Weather for Energy Calculations (CWEC)
Produced by Numerical Logics in collaboration with Environment Canada and the National
Research Council of Canada, the CWEC were derived using a methodology similar to the
TMY2 and TMY. CWEC hourly files represent weather conditions that result in
approximately average heating and cooling loads in buildings. The National Energy Code of
Canada requires the use of a CWEC file representative of a location when the performance
path and customized design calculations are chosen as the means of building energy
consumption compliance. The CWEC follow the ASHRAE WYEC2 format and were derived
from the Canadian Energy and Engineering Data Sets (CWEEDS) of hourly weather
information for Canada from the 1953-1995 period of record.
The 55 CWEC files contain hourly weather observations representing an artificial one-year
period specifically designed for building energy calculations. All 55 locations in the CWEC
data set are available for download in EnergyPlus weather format.
International Weather for Energy Calculations (IWEC)
The IWEC are the result of ASHRAE Research Project 1015 conducted by Numerical Logics
and Bodycote Materials Testing Canada for ASHRAE Technical Committee 4.2 Weather
Information. The IWEC data files are 'typical' weather files suitable for use with building
energy simulation programs for 227 locations outside the USA and Canada.
The files are derived from up to 18 years of DATSAV3 hourly weather data originally archived
at the U S National Climatic Data Center. The weather data is supplemented by solar
radiation estimated on an hourly basis from earth-sun geometry and hourly weather
elements, particularly cloud amount information. The IWEC CD-ROM is available from
ASHRAE.
The Department of Energy has licensed the IWEC data from ASHRAE. Our license with
ASHRAE allows us to: “Distribute versions of the individual IWEC files in converted format
suitable for EnergyPlus (EPW). Make the EnergyPlus versions of the IWEC files available to
users at no cost via this EnergyPlus web site.” All 227 locations in the IWEC data set are
available for download in EnergyPlus weather format.
4/23/05
47
WEATHER CONVERTER PROGRAM
SOURCE WEATHER DATA FORMATS
The IWEC source data is © 2001 American Society of Heating, Refrigerating and AirConditioning Engineers (ASHRAE), Inc., Atlanta, GA, USA. http://www.ashrae.org/ All rights
reserved as noted in the License Agreement and Additional Conditions.
IWEC also describes a data format, very similar to the TMY2 data format.
Typical Meteorological Year (TMY)
Data for 230 locations in the USA plus four locations in Cuba, Marshall Islands, Palau, and
Puerto Rico, derived from a 1948-1980 period of record. Many of the locations in the TMY
data set were subsequently updated by the TMY2.
Similar to the TMY2, the TMY are data sets of hourly values of solar radiation and
meteorological elements for a 1-year period. Their intended use is for computer simulations
of solar energy conversion systems and building systems to facilitate performance
comparisons of different system types, configurations, and locations in the United States and
its territories. Because they represent typical rather than extreme conditions, they are not
suited for designing systems to meet the worst-case conditions occurring at a location. The
data are available for purchase from the National Climatic Data Center.
The 42 TMY locations that do not duplicate TMY2 locations are available for download in
EnergyPlus weather format.
TMY also describes a data format.
California Climate Zones 2 (CTZ2)
Updated weather data for 16 California climate zones for use to demonstrate compliance with
Title 24 with approved building energy simulation programs. All 16 CTZ2 weather files are
available for download in EnergyPlus weather format. The original source data is available
from the California Energy Commission. These source data files are described using the
WYEC2 format.
Solar and Wind Energy Resource Assessment (SWERA)
The Solar and Wind Energy Resource Assessment (SWERA) project, funded by the United
Nations Environment Program, is developing high quality information on solar and wind
energy resources in 13 developing countries. Currently typical year hourly data are available
for 48 locations in Belize, Cuba, El Salvador, Guatemala, Honduras, Maldives, Nicaragua,
and Sri Lanka. The data are available from the SWERA project web site. SWERA plans to
release new data for Brazil, Ethiopia, Ghana, Kenya, and Nepal over the coming few months.
These source data files are described using the TMY3 format.
Spanish Weather for Energy Calculations (SWEC)
Originally developed for use with Calener, a new program for building energy labelling in
Spain, these weather files cover all 52 Spanish provincial capitals. Calener was developed by
the Grupo de Termotecnia of the Escuela Superior de Ingeneiros in Seville for the Spanish
Government. The weather files were synthetically generated using Climed (Portuguese
software developed by Ricardo Aguiar) from mean monthly data coming from the Spanish
Meteorological National Institute. These weather files were converted from the DOE-2 binary
to EnergyPlus format and include constant wind speeds of 6.7 m/s.
For more information on these weather files, contact: Profesor Luis Pérez-Lombard
([email protected]) Escuela Superior de Ingenieros
4/23/05
48
WEATHER CONVERTER PROGRAM
SOURCE WEATHER DATA FORMATS
Italian Climatic data collection "Gianni De Giorgio" (IGDG)
Developed for use in simulating renewable energy technologies, this set of 66 weather files is
based on a 1951-1970 period of record. The data were created by Professor Livio
Mazzarella, Politecnico di Milano, and is named in honor of Gianni de Giorgio.
Chinese Typical Year Weather (CTYW)
Developed for use in simulating building heating and air conditioning loads and energy use,
and for calculating renewable energy utilization, this set of 57 weather files is based on a
1982-1997 period of record with data obtained from the U. S. National Climatic Data Center.
The data were created by Prof. ZHANG Qingyuan of Tsukuba University Japan, in
collaboration with Joe Huang of Lawrence Berkeley National Laboratory. The original typical
year weather files are contained in: Zhang Qingyuan and Joe Huang. 2004. Chinese Typical
Year Weather Data for Architectural Use (in Chinese). ISBN 7-111-14810-X. Beijing: China
Machine Press. Available from: China Machine Press; No. 22 Baiwanzhuang Dajie; Beijing,
CHINA 100037
Other Formats
The data sets and formats described above are some of the newest formats available for use
with building simulation programs.
Source data comes in various formats. Typically the files are ASCII, but the data items, units,
item location, and record length vary from format to format. NCDC can provide historical data
in a variety of formats: TD-3280, TD-3510, TD-9950 (DATSAV2), TD-9956 (DATSAV3) and
TD-1440 (CD144). Of these, the EnergyPlus weather processor cannot process any of the
types (yet).
One other format worth mentioning is TRY. This is the format of an old, “test reference year”
data set that did not include solar radiation data. “Test Reference Year” is a term that usually
denotes selection of a specific year of “real” data based on some statistical procedure. The
original TRY data (TD-9706) was based on an ASHRAE procedure to select the data from a
“period of record”. “The principle of the selection is to eliminate years in the period of record
containing months with extremely high or low mean temperatures until only one year
remains.” The weather conversion utility cannot process data in “TRY” format. However,
many organizations develop data for reference year data (e.g. European TRY, Moisture
Reference Data).
Custom Format
Using a “definitions” file (see Description of “Def” input file), the weather converter can
process a wide range of data formats. In the table below, both the GDG and CTYW weather
data was processed by a custom format approach.
Solar Data
Source weather data files may or may not contain solar data. All of the files that can be
processed by the EnergyPlus Weather conversion utility contain solar data. The weather
processor will transfer this data to the EPW weather file and the EnergyPlus simulation
program will use it.
Historical weather data files in CD144 format do not contain solar data nor is such data
generally available for a specific location and time period. In this case, ersatz solar data must
be generated from cloud cover and other data using sky models and regression formulas.
Currently, neither the Weather Conversion utility nor the EnergyPlus program synthesizes
this data.
4/23/05
49
WEATHER CONVERTER PROGRAM
DATA SOURCES/UNCERTAINTY
Table 12. Summary of Downloadable Weather Data by Type
USA
Canada
International
Total
TMY2
237
2
239
TMY
38
4
42
(not duplicating TMY2)
CTZ
4
4
(not duplicating TMY/TMY2)
CTZ2
16
16
55
CWEC
55
IWEC
227
227
SWERA
156
156
SWEC
52
52
IGDG
66
66
CTYW
57
57
564
914
Totals
279
(+16 CTZ2)
55
Data Sources/Uncertainty
More recent weather data source files have introduced the concept of data sources and
uncertainty flags for many of the fields. The EnergyPlus weather format faithfully reproduces
these fields as appropriate for the input source data types. By and large, most of the data
sources and uncertainties have used the TMY2 established fields and values (See following
table). As noted earlier, to enhance readability and reduce obfuscation, the EnergyPlus
format for the data source and uncertainty flags collates them into one large field. Each data
element still has its data source and uncertainty: it is positionally embodied depending on its
place in the EPW data record.
Table 13. Key to Data Source and Uncertainty Flags
Data Flag
4/23/05
Flag Values
Dry Bulb Temperature Data Source
A-F
Dry Bulb Temperature Data Uncertainty
0-9
Dew Point Temperature Data Source
A-F
Dew Point Temperature Data Uncertainty
0-9
Relative Humidity Data Source
A-F
Relative Humidity Data Uncertainty
0-9
Atmospheric Station Pressure Data Source
A-F
Atmospheric Station Pressure Data Uncertainty
0-9
Horizontal Infrared Radiation Data Source
A-H, ?
Horizontal Infrared Radiation Data Uncertainty
0-9
Global Horizontal Radiation Data Source
A-H, ?
Global Horizontal Radiation Data Uncertainty
0-9
50
WEATHER CONVERTER PROGRAM
DATA SOURCES/UNCERTAINTY
Direct Normal Radiation Data Source
A-H, ?
Direct Normal Radiation Data Uncertainty
0-9
Diffuse Horizontal Radiation Data Source
A-H, ?
Diffuse Horizontal Radiation Data Uncertainty
0-9
Global Horizontal Illuminance Data Source
I, ?
Global Horizontal Illuminance Data Uncertainty
0-9
Direct Normal Illuminance Data Source
I, ?
Direct Normal Illuminance Data Uncertainty
0-9
Diffuse Horizontal Illuminance Data Source
I, ?
Diffuse Horizontal Illuminance Data Uncertainty
0-9
Zenith Luminance Data Source
I, ?
Zenith Luminance Data Uncertainty
0-9
Wind Direction Data Source
A-F
Wind Direction Data Uncertainty
0-9
Wind Speed Data Source
A-F
Wind Speed Data Uncertainty
0-9
Total Sky Cover Data Source
A-F
Total Sky Cover Data Uncertainty
0-9
Opaque Sky Cover Data Source
A-F
Opaque Sky Cover Data Uncertainty
0-9
Visibility Data Source
A-F, ?
Visibility Data Uncertainty
0-9
Ceiling Height Data Source
A-F, ?
Ceiling Height Data Uncertainty
0-9
Precipitable Water Data Source
A-F
Precipitable Water Data Uncertainty
0-9
Broadband Aerosol Optical Depth Data Source
A-F
Broadband Aerosol Optical Depth Data Uncertainty
0-9
Snow Depth Data Source
A-F, ?
Snow Cover Data Uncertainty
0-9
Days Since Last Snowfall Data Source
A-F, ?
Days Since Last Snowfall Data Uncertainty
0-9
The definition of the solar radiation source flags and solar radiation uncertainty flags are
shown in the following two tables:
Table 14. Solar Radiation and Illuminance Data Source Flag Codes
Flag Code
4/23/05
Definition
A
Post-1976 measured solar radiation data as received from NCDC or other sources
B
Same as "A" except the global horizontal data underwent a calibration correction
C
Pre-1976 measured global horizontal data (direct and diffuse were not measured before 1976),
adjusted from solar to local time, usually with a calibration correction
51
WEATHER CONVERTER PROGRAM
DATA SOURCES/UNCERTAINTY
D
Data derived from the other two elements of solar radiation using the relationship, global =
diffuse + direct ´ cosine (zenith)
E
Modeled solar radiation data using inputs of observed sky cover (cloud amount) and aerosol
optical depths derived from direct normal data collected at the same location
F
Modeled solar radiation data using interpolated sky cover and aerosol optical depths derived
from direct normal data collected at the same location
G
Modeled solar radiation data using observed sky cover and aerosol optical depths estimated
from geographical relationships
H
Modeled solar radiation data using interpolated sky cover and estimated aerosol optical depths
I
Modeled illuminance or luminance data derived from measured or modeled solar radiation data
?
Source does not fit any of the above categories. Used for nighttime values and missing data
Table 15. Solar Radiation and Illuminance Data Uncertainty Flag Codes
Flag
Uncertainty Range
(%)
1
Not used
2
2-4
3
4-6
4
6-9
5
9 - 13
6
13 - 18
7
18 - 25
8
25 - 35
9
35 - 50
0
Not applicable
Finally, the Meteorological data source and uncertainty flag/codes are shown in the following
two tables:
Table 16. Meteorological Data Source Flag Codes
Flag
A
4/23/05
Definition
Data as received from NCDC, converted to SI units
B
Linearly interpolated
C
Non-linearly interpolated to fill data gaps from 6 to 47
hours in length
D
Not used
E
Modeled or estimated, except: precipitable water,
calculated from radiosonde data; dew point temperature
calculated from dry bulb temperature and relative
humidity; and relative humidity calculated from dry bulb
temperature and dew point temperature
F
Precipitable water, calculated from surface vapor
pressure; aerosol optical depth, estimated from
geographic correlation
?
Source does not fit any of the above. Used mostly for
52
WEATHER CONVERTER PROGRAM
INTERFACE TO THE EPLUSWTH.DLL
missing data
Table 17. Meteorological Uncertainty Flag Codes
Flag
Definition
1- 6
Not used
7
Uncertainty consistent with NWS
practices and the instrument or
observation used to obtain the data
8
Greater uncertainty than 7 because
values were interpolated or estimated
9
Greater uncertainty than 8 or unknown.
0
Not definable.
Interface to the EPlusWth.dll
To provide information for outside developers/interfaces that might want to use the basic
weather processing utility from within their interface, the EPlusWth.dll was developed. It is
actually used by the weather converter utility. In addition to the basic interface calls, six
important files are also used by this library. These are placed in the WeatherConverter folder
during install of EnergyPlus.
Files used by EPlusWth.dll
Each of the files is in a general comma-delimited format. Thus, they can be easily viewed by
importing into a spreadsheet program such as Excel™. The files are used to support
information lacking in the source data files and/or supply additional information used during
the conversion process. In each case (with one exception), there will be a single or set of
“header” records describing each column of the file and then the data values of the file will
follow on subsequent records. Each of the files is described briefly in the next few sections.
Abbreviations.csv
This file does not have a header record, but it consists of 3 columns. It is used for data files
that might have 2-character abbreviations for US States or Canadian provinces and provides
a translation to the full name and 3-character country code. Likewise, it can use the full name
of these items to obtain the 2-character abbreviation or 3-character country code.
WBANLocations.csv
In many older data sets, the station identifier for the weather data uses the WBAN (Weather
Bureau Army-Navy) designation system. This has largely been superceded by the WMO
(World Meteorological Organization) designation for station collection site identifiers. This file
provides a translation between the two identifier systems. In addition, this file contains
latitude, longitude, time zone and elevation information for the sites.
Cal Climate Zone Lat Long data.csv
Note that this file has spaces in the name. The California climate zone data source files do
not have standard station identifiers. Rather they use a climate zone designator from 1-16.
This file is used to obtain the latitude, longitude, time zone and elevation data for these
climate zones. The WYEC2 “File Source Code” (field 2, column 6 of each data record) is
used to determine that the file is a California compliance type file.
4/23/05
53
WEATHER CONVERTER PROGRAM
INTERFACE TO THE EPLUSWTH.DLL
USDesignConditions.csv
CanadaDesignConditions.csv
WorldDesignConditions.csv
The three files for design conditions have roughly the same format. These are the values
from the ASHRAE Handbook of Fundamentals, 2001, Chapter 27, SI Tables 1a, 1b, 2a, 2b,
3a, 3b, 4a, 4b. The WMO station identifier is used to determine the design condition values
that apply to a source data file and, thus, are included in the DESIGN CONDITION header
record on the EPW file produced as part of the conversion. This information is also included
in the statistical report file (STAT) produced from the weather converter utility. In addition,
these are used to supply the information for the design day object (DDY) file creation.
Public calls to EPlusWth.dll
Several points of the library are made available for use with external programs. In each case
the parameters passed will be described along with the Visual Basic™ (VB6) code that is
used to declare them as well as Fortran 90 style “Interface” statements to the same calls.
The library is placed in the same folder with the weather converter utility – you may need to
copy it to your program’s folder if you choose to add external calls from your program to it.
SetupPWInternalDataPath
This call designates the “path” to the files listed above. This is the location where the
ProcessWeather call will expect to find the files. Having this incorrectly specified is not fatal,
but will probably cause confusion.
VB declaration statement:
Private Declare Sub SetupPWInternalDataPath Lib "EPlusWth" (ByVal strPath As
String, ByVal InPathLen As Long)
And a call from a VB program:
Call SetupPWInternalDataPath(AppPath, Len(AppPath))
Likewise for Fortran 90/95:
INTERFACE
SUBROUTINE SetupPWInternalDataPath (Path)
CHARACTER(len=*), INTENT(IN) :: Path
! Path where data files reside
END SUBROUTINE
END INTERFACE
And then calling it from Fortran:
Character(len=255) DataPath
CALL SetupPWInternalDataPath(trim(DataPath))
SetFixOutOfRangeData
As shown earlier (file menu option in the weather converter utility), there is an option to “fix”
out of range data or not. By default, this is turned off (does not fix data). Again a character
convention (“yes” for fixing; “no” for not fixing) is used. Case of the actual string is ignored.
VB Declaration statement:
Private Declare Sub SetFixOutOfRangeData Lib "EPlusWth" (ByVal strValue As
String, ByVal strValueLen As Long)
And calling it from VB:
Global FixOutOfRangeData As String
4/23/05
54
WEATHER CONVERTER PROGRAM
INTERFACE TO THE EPLUSWTH.DLL
FixOutOfRangeData = “Yes”
Call SetFixOutOfRangeData(FixOutOfRangeData, Len(FixOutOfRangeData))
For Fortran 90/95:
INTERFACE
SUBROUTINE SetFixOutOfRangeData (YesNo)
CHARACTER(len=*),INTENT(IN) :: YesNo
! ‘yes’ to set fixing option;
! ‘no’ to not
END SUBROUTINE
END INTERFACE
And then calling it:
CALL SetFixOutOfRangeData(‘no’)
SetDefaultChgLimit
This call sets the value for the DB trigger shown earlier. Both values passed in are strings
and are specific to the dialog shown earlier:
Table 18. Trigger Limit Call Values
Trigger Limit
Result
Ignore
Calc
Trigger
Result
0
use only calculated trigger
0
Uses Calculated Trigger
1
use 5°C
1
Ignores calculated trigger
2
use 10°C
3
use 15°C
You can also choose to ignore the calculated trigger entirely. If you do not “ignore” the
calculated trigger, then the trigger is the minimum of the calculated and your trigger limit
selection.
VB Declaration Statement:
Private Declare Sub SetDefaultChgLimit Lib "EPlusWth" (ByVal strValue As
String, ByVal strValueLen As Long, ByVal strValue As String, ByVal
strValueLen As Long)
And a call from VB:
Call SetDefaultChgLimit(TriggerLimit, Len(TriggerLimit),
IgnoreCalcTrigger, Len(IgnoreCalcTrigger))
ProcessWeather
The “meat” of the processing is done by this routine. It gets passed the input file name
(source data), the input file type, output file name, output file type. As an output it can
provide a notice that the processing was successful or not.
VB Declaration Statement:
Private Declare Sub ProcessWeather Lib "EPlusWth" (ByVal strInType As String,
ByVal InTypeLen As Long, ByVal strOutType As String, ByVal OutTypeLen As
Long, ByVal strInFileName As String, ByVal InFileNameLen As Long, ByVal
strOutFileName As String, ByVal OutFileNameLen As Long, ErrorFlag As Boolean)
Calling it from VB:
4/23/05
55
WEATHER CONVERTER PROGRAM
INTERFACE TO THE EPLUSWTH.DLL
Call ProcessWeather(InputFileDataType, Len(InputFileDataType),
OutputFileDataType, Len(OutputFileDataType),
InputFileName, Len(InputFileName),
OutputFileName, Len(OutputFileName),
ErrorFlag)
Valid values for the Input File Data Type are shown in the following table:
Table 19. Valid Input File Types for "ProcessWeather" call
Input File Type
Source Data file Format Type
TMY2 or TM2
TMY2 data file
IWEC or IWC
IWEC data file
SAMSON or DAT
SAMSON data file
WYEC2 or WY2
WYEC2 data file
FMT or TXT
DOE-2 Formatted data file
CLM or ESP-r
ESP-r formatted data file
BLAST or ASC
BLAST ASCII formatted data file
EPW
EnergyPlus EPW file
CSV
EnergyPlus CSV file
TMY
TMY data files
Valid values for the Output File Type(s) are shown in the following table:
Table 20. Valid Output File Types for the "ProcessWeather" call
Output File Type
File(s) produced
EPW
EPW and RPT files
CSV
CSV and RPT files
BOTH
EPW, CSV and RPT files
RPT
RPT file
For Input and Output file names, the complete paths should be included.
ErrorFlag will be returned as “true” if an error occurs during processing or “false” if the
process is successful.
Fortran 90/95 Declaration:
INTERFACE
SUBROUTINE ProcessWeather(InType,OutType,InFileName,OutFileName,ErrFlag)
CHARACTER(len=*), INTENT(IN) :: InType
! InputFile Type
CHARACTER(len=*), INTENT(IN) :: OutType
! OutputFile Type
CHARACTER(len=*), INTENT(IN) :: InFileName
! InputFile Name (Full path)
CHARACTER(len=*), INTENT(IN) :: OutFileName ! OutputFileName (Full path)
LOGICAL(Byte2), INTENT(OUT) :: ErrFlag
! If errors are found,
! set to true and put
! description put in file.
END SUBROUTINE
END INTERFACE
And calling it from Fortran:
call processweather(trim(intype),trim(outtype),
&
trim(infilename),trim(outfilename),errflag)
4/23/05
56
WEATHER CONVERTER PROGRAM
REFERENCES
Note that the file where error messages will be placed is the RPT file. If the value of the
output file path is incorrect, you may need to search for this file by using the RPT extension.
References
ASHRAE. 1985. Weather Year for Energy Calculations.
Heating, Refrigerating and Air-Conditioning Engineers, Inc.
Atlanta: American Society of
ASHRAE. 1997. WYEC2 Weather Year for Energy Calculations 2, Toolkit and Data, Atlanta:
ASHRAE.
ASHRAE. 2001. International Weather for Energy Calculations (IWEC Weather Files) Users
Manual and CD-ROM, Atlanta: ASHRAE
ASHRAE. 2004. ANSI/ASHRAE Standard 90.2-2004, "Energy-Efficient Design of Low-Rise
Residential Buildings," September 2004. Atlanta: American Society of Heating, Refrigerating,
and Air-conditioning Engineers.
ASHRAE. 2004. ANSI/ASHRAE/IESNA Standard 90.1-2004, "Energy-Efficient Design of
Buildings Except Low-Rise Residential," September 2004. Atlanta: American Society of
Heating, Refrigerating, and Air-conditioning Engineers.
Briggs, Robert S., Robert G. Lucas, and Z. Todd Taylor 2002. “Climate Classification for
Building Energy Codes and Standards: Part 1 – Development Process” in ASHRAE
Transactions 2002, 109, Pt 1. Atlanta: ASHRAE.
Briggs, Robert S., Robert G. Lucas, and Z. Todd Taylor 2002. “Climate Classification for
Building Energy Codes and Standards: Part 2 – Zone Definitions, Maps and Comparisons” in
ASHRAE Transactions, 109, Pt 1. Atlanta: ASHRAE.
Buhl, W.F. DOE-2 Weather Processor, DOE2.1E Documentation Update, 1998.
COMIS Weather Program, http://www.byggforsk.no/hybvent/COMISweather.htm
Commission of the European Community. 1985. Test Reference Years, Weather data sets
for computer simulations of solar energy systems and energy consumption in buildings, CEC,
DG XII. Brussels, Belgium: Commission of the European Community.
Crawley, Drury B., Linda K. Lawrie, Curtis O. Pedersen, Richard J. Liesen, Daniel E. Fisher,
Richard K. Strand, Russell D. Taylor, Frederick C. Winkelmann, W.F. Buhl, A. Ender Erdem,
and Y. Joe Huang. 1999. “EnergyPlus, A New-Generation Building Energy Simulation
Program,” in Proceedings of Building Simulation ’99, Kyoto, Japan. IBPSA.
Crawley, Drury B. 1998. “Which Weather Data Should You Use for Energy Simulations of
Commercial Buildings?,” ASHRAE Transactions, 104 Pt. 2. Atlanta: ASHRAE.
Crawley, Drury B., Jon Hand, and Linda K. Lawrie, 1999. “Improving the Weather Information
Available to Simulation Programs”, in Proceedings of Building Simulation ’99, Kyoto, Japan.
September 1999. IBPSA.
Energy Simulation Research Unit. 1999. http://www.strath.ac.uk/Departments/ESRU
Janak, M. 1997. “Coupling Building Energy and Lighting Simulation,” in Proceedings of
Building Simulation 97, September 1997, Volume II pp 313-319, Prague, Czech Republic,
IBPSA.
Köppen, W. 1931. Grundriss der Klimakunde. Berlin: Walter de Gruyter & Co.
National Instruments Corporation. 1999. LabVIEW User Manual. Austin, Texas: National
Instruments Corporation.
4/23/05
57
WEATHER CONVERTER PROGRAM
WEB RESOURCES
McDonald, Iain, and Paul Strachan. 1998. “Practical Application of Uncertainty Analysis” in
Proceedings of EPIC 98: Second International Conference on Energy Performance and
Indoor Climate in Buildings, Lyon, France, 19-21 November 1998.
National Climatic Data Center (NCDC). 1976. Test Reference Year (TRY), Tape Reference
Manual, TD-9706, September 1976. Asheville, North Carolina: National Climatic Data Center,
U.S. Department of Commerce.
NCDC. 1981. Typical Meteorological Year User’s Manual, TD-9734, Hourly Solar Radiation—
Surface
National Climatic Data Center. 1981. Typical Meteorological Year User's Manual, TD-9734,
Hourly Solar Radiation -- Surface Meteorological Observations, May 1981. Asheville, North
Carolina: National Climatic Data Center, U.S. Department of Commerce.
Meteorological Observations, May 1981. Asheville, North Carolina: National Climatic Data
Center, U.S. Department of Commerce.
NCDC. 1993. Solar and Meteorological Surface Observation Network, 1961-1990, Version
1.0, September 1993. Asheville, North Carolina: National Climatic Data Center, U.S.
Department of Commerce.
National Renewable Energy Laboratory (NREL). 1995. User’s Manual for TMY2s (Typical
Meteorological Years), NREL/SP-463-7668, and TMY2s, Typical Meteorological Years
Derived from the 1961-1990 National Solar Radiation Data Base, June 1995, CD-ROM.
Golden, Colorado: National Renewable Energy Laboratory.
http://rredc.nrel.gov/solar/pubs/tmy2/
Numerical Logics. 1999. Canadian Weather for Energy Calculations, Users Manual and CDROM. Downsview, Ontario: Environment Canada.
Oliver, John E. 1991. "The History, Status and Future of Climatic Classification," in Physical
Geography 1991, Vol 12, No. 3, pp. 231-251.
University of Illinois. 1998. BLAST User’s Guide. Building Systems Laboratory, University of
Illinois. Urbana, Illinois: University of Illinois, Department of Industrial and Mechanical
Engineering.
Ward. G. 1996. Radiance. Berkeley: Lawrence Berkeley National Laboratory.
Winkelmann, F.C., W.F. Buhl, B. Birdsall, A. E. Erdem, and K. Ellington. 1994. DOE-2.1E
Supplement, DE-940-11218. Lawrence Berkeley Laboratory, Berkeley, California. Springfield,
Virginia: NTIS.
Web Resources
Building Energy Tools Directory, a directory of information on 28+ energy tools from around
the world.
http://www.energytoolsdirectory.gov/
Energy Systems Research Unit, University of Strathclyde, authors of ESP-r, up-to-date
information on ESP-r and other energy systems research and software development.
http://www.strath.ac.uk/Departments/ESRU
EnergyPlus, up-to-date information on the current status of EnergyPlus and working with the
team, and documentation such as input data structure, output data structure, and licensing
opportunities. Additional weather files may be posted here as well.
http://www.energyplus.gov
Description of the SWERA project.
http://swera.unep.net/swera/
4/23/05
58
GROUND HEAT TRANSFER IN ENERGYPLUS
CAUTION
Ground Heat Transfer in EnergyPlus
Caution
For ground-contact surfaces in EnergyPlus, it is important to specify appropriate ground
temperatures. Do not use the "undisturbed" ground temperatures from the weather data.
These values are too extreme for the soil under a conditioned building. For best results, use
the Slab or Basement program described in this section to calculate custom monthly average
ground temperatures. This is especially important for residential applications and very small
buildings. If one of these ground temperature preprocessors is not used, for typical
commercial buildings in the USA, a reasonable default value is 2C less than the average
indoor space temperature.
Introduction
There are two difficulties behind linking ground heat transfer calculations to EnergyPlus. One
is the fact that the conduction calculations in EnergyPlus (and in DOE–2 and BLAST before
it) are one-dimensional and the ground heat transfer calculations are two or threedimensional. This causes severe modeling problems irrespective of the methods being used
for the ground heat transfer calculation. The other difficulty is the markedly different time
scales involved in the processes. Basically, the zone model is on an hour scale and the
ground heat transfer is on a monthly time scale. The basic heat balance based zone model
of EnergyPlus has to be considered as the foundation for building energy simulation at the
present time and for some time in the future. Thus, it is necessary to be able to relate ground
heat transfer calculations to that model.
The heat balance zone model considers a single room or thermal zone in a building and
performs a heat balance on it. A fundamental modeling assumption is that the faces of the
enclosure are isothermal planes. A ground heat transfer calculation usually considers an
entire building and the earth that surrounds it, resulting in non-isothermal face planes where
there is ground contact. While it is not impossible to imagine multi-zone, whole building
models that include the surrounding earth and non-isothermal building surfaces, such models
will not be practical for some time in the future, and their usefulness even then is not clear.
The EnergyPlus development team addressed the problem and decided that the most
reasonable first step would be to partially decouple the ground heat transfer calculation from
the thermal zone calculation. The most important parameter for the zone calculation is the
outside face temperature of the building surface that is in contact with the ground. Thus this
becomes a reasonable “separation plane” for the two calculations. It was further decided that
the current usage of monthly average ground temperature was reasonable for this separation
plane temperature as well, since the time scales of the building heat transfer processes are
so much shorter than those of the ground heat transfer processes.
Using the separation plane premise, the 3D ground heat transfer programs for slabs
developed by Bahnfleth (1989,1990) were modified by Clements (2004) to produce outside
face temperatures. The program has recently been modified to permit separate monthly
average inside temperatures as input. The program produces outside face temperatures for
the core area and the perimeter area of the slab. It is described in the section “Use of the
Ground Temperatures with Slabs” below.
A 3D basement program also is included with EnergyPlus. This is described in the section
”Using Ground Temperatures With Basements“ of this document. It uses the same principle
as the slab procedure; it determines the outside fact temperature of the walls and floor of a
basement in contact with the ground.
4/23/05
59
GROUND HEAT TRANSFER IN ENERGYPLUS
USE OF THE GROUND TEMPERATURES WITH SLABS
It should be noted that either for slabs or basements the ground heat transfer is usually small
unless the building is very small or has some special characteristics.
Another section “Multiple Ground Temperatures“ shows how the OtherSideCoefficients object
of EnergyPlus can be used to supply multiple ground temperatures.
Use of the Ground Temperatures with Slabs
The Slab program produces temperature profiles for the outside surface at the core and at
the perimeter of the slab. It also produces the average based on the perimeter and core
areas used in the calculation. This allows the user to apply the Slab temperatures one of two
ways in EnergyPlus:
Option 1 – Core and Perimeter Temperatures: The EnergyPlus OtherSideCoefficients
object can be used to provide two sets of twelve monthly average ground temperature
values. In this way, both the perimeter and the core values from the Slab program can be
used in the succeeding EnergyPlus run. This method assumes that the floor slab will be
described using at least two different heat transfer surfaces.
The use of
OtherSideCoefficients to provide additional ground contact surfaces is described in detail
in the "Multiple Ground Temperatures" section below.
Option 2 – Average Temperatures: Use the monthly average temperatures produced by
the Slab program in the EnergyPlus GroundTemperatures object. This will provide an
average ground temperature at the outside face of any heat transfer surface whose
OutsideFaceEnvironment field is set to “ground”.
The program has been modified so that the inside temperature can be more complex than a
year long average. It is now possible to input twelve separate monthly average inside
temperatures. In addition, it is possible to add a hourly sinusoidal variation of the inside
temperature with a 24 hour period sine function. This was included to show the effect of
something such as night setback on the face temperature. Generally the effect is quite small.
First the results for a monthly specified constant average inside temperature. The location is
Minneapolis, and the slab is insulated.
Monthly Slab Outside Face Temperatures, C
Perimeter Area: 304.00 Core Area: 1296.00
Month
Average
Perimeter
Core
Inside
1
17.67
16.11
18.03
18.0
2
17.45
15.92
17.81
18.0
3
17.43
16.07
17.74
18.0
4
19.00
17.82
19.27
20.0
5
19.24
18.23
19.48
20.0
6
19.31
18.42
19.52
20.0
7
20.92
20.14
21.11
22.0
8
21.17
20.44
21.35
22.0
9
21.22
20.45
21.40
22.0
10
21.21
20.26
21.44
22.0
11
19.62
18.54
19.88
20.0
12
19.35
17.99
19.67
20.0
The resulting heat flux is shown below. The inside heat transfer coefficient and slab thermal
properties are specified in the input file. For this example the total thermal resistance from the
inside air to the slab bottom surface was 0.27 (m2 C)/W . This value is controlled by the user
with the inside heat transfer coefficient and slab thermal properties values in the slab
program input file.
4/23/05
60
GROUND HEAT TRANSFER IN ENERGYPLUS
USE OF THE GROUND TEMPERATURES WITH SLABS
Month
Average
Perimeter
Core
Inside
Perimeter Heat
Flux W/m^2
Average Heat
Flux W/m^2
1
17.67
16.11
18.03
18
7.00
1.22
2
17.45
15.92
17.81
18
7.70
2.04
3
17.43
16.07
17.74
18
7.15
2.11
4
19
17.82
19.27
20
8.07
3.70
5
19.24
18.23
19.48
20
6.56
2.81
6
19.31
18.42
19.52
20
5.85
2.56
7
20.92
20.14
21.11
22
6.89
4.00
8
21.17
20.44
21.35
22
5.78
3.07
9
21.22
20.45
21.4
22
5.74
2.89
10
21.21
20.26
21.44
22
6.44
2.93
11
19.62
18.54
19.88
20
5.41
1.41
19.35
17.99
19.67
20
7.44
2.41
12
Then for the same conditions, the results with a 2 degree C amplitude 24 hour sin wave
variation. Notice that the inside temperatures are the same since they are monthly averages
and the daily variation oscillates about the mean. The core and perimeter slab temperatures
are affected slightly.
Monthly Slab Outside Face Temperatures, C
Perimeter Area: 304.00 Core Area: 1296.00
Month
Average
Perimeter
Core
Inside
1
17.51
16.03
17.86
18.0
2
17.29
15.85
17.63
18.0
3
17.27
16.00
17.57
18.0
4
18.87
17.77
19.13
20.0
5
19.11
18.16
19.34
20.0
6
19.17
18.34
19.37
20.0
7
20.81
20.07
20.98
22.0
8
21.05
20.36
21.21
22.0
9
21.09
20.38
21.26
22.0
10
21.08
20.19
21.29
22.0
11
19.47
18.45
19.71
20.0
12
19.20
17.92
19.51
20.0
An example of a 24 hour inside temperature profile for this case is shown below. The sine
wave amplitude was 2 C.
Day
1
1
1
1
1
1
1
1
1
1
1
1
1
1
1
1
4/23/05
Hour
1
2
3
4
5
6
7
8
9
10
11
12
13
14
15
16
Perim Out Ts
17.30827
17.29503
17.30236
17.32258
17.34834
17.37288
17.39023
17.39544
17.38485
17.35602
17.30590
17.23507
17.14650
17.04291
16.92873
16.81076
Core Out Ts
19.15832
19.15274
19.16732
19.19376
19.22526
19.25529
19.27798
19.28838
19.28117
19.24733
19.18686
19.10210
18.99703
18.87713
18.74895
18.61963
Inside Temp
18.51749
18.99974
19.41389
19.73175
19.93166
20.00000
19.93212
19.73265
19.41517
19.00130
18.51924
18.00180
17.48425
17.00183
16.58738
16.26915
61
GROUND HEAT TRANSFER IN ENERGYPLUS
1
1
1
1
1
1
1
1
USE OF THE GROUND TEMPERATURES WITH SLABS
17
18
19
20
21
22
23
24
16.69609
16.59243
16.50669
16.44276
16.40369
16.38873
16.39435
16.41942
18.49656
18.38671
18.29626
18.23010
18.19161
18.18218
18.19834
18.23298
16.06881
16.00000
16.06741
16.26645
16.58356
16.99714
17.47902
17.99639
A plot of the daily profiles is shown below. Note that the inside temperature change of 4 C
produces only a small change in the slab lower face temperature.
Figure 8. Daily Temperature Profiles (Slab)
The resulting heat fluxes are shown below. They can be compared with the fluxes shown
above for the constant inside temperature run. The changes resulting from a fairly large 4 C
daily temperature variation are probably not significant.
Month
Average
Perimeter
Core
Inside
1
2
3
4
5
6
7
8
9
10
11
12
17.51
17.29
17.27
18.87
19.11
19.17
20.81
21.05
21.09
21.08
19.47
19.2
16.03
15.85
16
17.77
18.16
18.34
20.07
20.36
20.38
20.19
18.45
17.92
17.86
17.63
17.57
19.13
19.34
19.37
20.98
21.21
21.26
21.29
19.71
19.51
18
18
18
20
20
20
22
22
22
22
20
20
4/23/05
Perimeter Heat Flux
W/m^2
7.30
7.96
7.41
8.26
6.81
6.15
7.15
6.07
6.00
6.70
5.74
7.70
Average Heat Flux
W/m^2
1.81
2.63
2.70
4.19
3.30
3.07
4.41
3.52
3.37
3.41
1.96
2.96
62
GROUND HEAT TRANSFER IN ENERGYPLUS
SLAB CONFIGURATION DRAWING
Slab configuration Drawing
The slab configuration used in the slab model is a “slab in grade” model. That is the slab top
surface is assumed to be level with the outside earth surface. If a “slab in grade”
configuration, having the bottom surface of the slab level with the outside earth surface is
desired, the best approximation is to use the horizontal insulation configuration. The edge of
the slab will have a small thermal resistance due to the two dimensional path through the
earth, but the effect is small. In any case, uninsulated slab edges are certainly not
recommended in cold climates.
Figure 9. Slab-in-grade illustration
Important Files for Ground Heat Transfer with Slabs
The slab program used to calculate the results is included with the EnergyPlus distribution. It
requires an input file named GHTin.idf in input data file format. The needed corresponding
idd file is SlabGHT.idd. An EnergyPlus weather file for the location is also needed. A batch
file, RunSlab, is placed in the same folder with the program and sample files. To use it
(Command mode or DOS mode), one may modify several important lines:
:Instructions:
: Complete the following path and program names.
: path names must have a following \ or errors will happen
set program_path=
set program_name=Slab.exe
set input_path=
set output_path=
set weather_path=C:\EnergyPlus\WeatherData\
and then in command mode issue the run command:
RunSlab myinput Chicago
Where you would have myinput.idf in “input_path” and Chicago would be the name of the
.epw file in the “weather_path”.
4/23/05
63
GROUND HEAT TRANSFER IN ENERGYPLUS
DESCRIPTION OF THE OBJECTS IN THE E+SLABGHT.IDD
You should set up the command mode so that it does not automatically close the window at
the end of program termination if you want to see the commands as they run and know for
sure that no errors occurred.
Description of the Objects in the E+SlabGHT.IDD
Materials
The materials object gives an overall description of the ground heat transfer model.
Field: NMAT: Number of Materials
This field specifies the number of different materials that will be used in the model. Typically
only a ground material and a slab material are used.
Field: Albedo: Surface Albedo: NoSnow
Field: Albedo: Surface Albedo: Snow
Two fields specify the albedo value of the surface. First for no snow coverage days and then
for days with snow coverage. The albedo is the solar reflectivity of the surface, and can vary
from 0.05 for blacktop to 0.95 for fresh snow. Typical values for North America reported by
Bahnfleth range from 0.16 to 0.4.
Field EPSLW: Surface Emissivity: NoSnow
Field EPSLW: Surface Emissivity: Snow
This field specifies the long wavelength (thermal) emissivity of the ground surface. It is
primarily important for nighttime radiation to the sky, and a value of 0.95 for both snow and no
snow is reasonable.
Field: Z0 Surface Roughness: NoSnow
Field: Z0 Surface Roughness: Snow
These two fields specify a surface roughness that is used in the determination of the
convection heat transfer coefficient between the ground surface and the air. This roughness
is based on boundary layer considerations, and specifies the height at which an
experimentally measured velocity profile goes to zero. The units are centimeters, not meters.
Typical values are 0.75 cm for no snow, and 0.05 cm for snow.
Field: HIN: Indoor Hconv: Downward Flow
Field: HIN: Indoor Hconv: Upward Flow
These fields specify the combined convective and radiative heat transfer coefficient between
the slab top inside surface and the room air for the cases where heat is flowing downward,
and upward. The program toggles between the two if the direction of the heat flux changes.
Typical values can be found in the ASHRAE Handbook of Fundamentals, but should be
about 6 W/(m^2 K) for downward heat flow and 9 W/(m^2 K) for upward heat flow.
The Materials object in the IDD is shown below.
Materials,
N1, \field NMAT: Number of materials
\note typical 2
N2, \field ALBEDO: Surface Albedo: No Snow
\note typical value= 0-1
N3, \field ALBEDO: Surface Albedo: Snow
\note typical value= 0-1
N4, \field EPSLW: Surface Emissivity: No Snow
\note typical value= 0.9
4/23/05
64
GROUND HEAT TRANSFER IN ENERGYPLUS
DESCRIPTION OF THE OBJECTS IN THE E+SLABGHT.IDD
N5, \field EPSLW: Surface Emissivity: Snow
\note typical value= 0.9
N6, \field Z0: Surface Roughness: No Snow
\note typical value= 0-10 cm
N7, \field Z0: Surface Roughness: Snow
\note typical value= 0-10
N8, \field HIN: Indoor HConv: Downward Flow
\note typical value= 4-10
\units W/m2-K
N9; \field HIN: Indoor HConv: Upward
\note typical value= 4-10
\units W/m2-K
MatlProps
This object contains the material properties that describe the materials used in the model.
The fields are quite self explanatory and consist of the following:
Field: RHO: Slab Material Density
Field: RHO: Soil Density
These two fields specify the density of the slab material and the soil in SI units of kg/m3
Field: CP: Slab CP
Field: CP: Soil CP
These two fields specify the specific heat of the slab and soil in SI units of J/(kg-K).
Field: TCON: Slab K
Field: TCON: Soil K
These two fields specify the thermal conductivity of the slab and soil in W/(mK)
The IDD object is shown below:
MatlProps,
N1, \field RHO: Slab Material density
\note typical value= 2300.0
\units kg/m3
N2, \field RHO: Soil Density
\note typical value= 1200.0
\units kg/m3
N3, \field CP: Slab CP
\note typical value=650.0
\units J/kg-K
N4, \field CP: Soil CP
\note typical value= 1200.0
\units J/kg-K
N5, \field TCON: Slab k
\note typical value= .9
\units W/m-K
N6; \field TCON: Soil k
\note typical value= 1.0
\units W/m-K
BoundConds
This object supplies some of the boundary conditions used in the simulation.
4/23/05
65
GROUND HEAT TRANSFER IN ENERGYPLUS
DESCRIPTION OF THE OBJECTS IN THE E+SLABGHT.IDD
Field: EVTR: Is surface evapotranspiration modeled
This field specifies whether or not to use the evapotransporation model. Evapotransportation
comprises all of the processes at the ground surface the involve exchanges of latent heat.
The inclusion of evapotransporation in the calculation has the greatest effect in warm dry
climates, primarily on the ground surface temperature. This field can be used to turn the
evapotransporation off and on to check sensitivity to it.
Field: FIXBC: is the lower boundary at a fixed temperature
This field permits using a fixed temperature at the lower surface of the model instead of a
zero heat flux condition. This change normally has a very small effect on the results. If the
flag is set to use a specified temperature, the program calculates an undisturbed temperature
profile and used the value at the model depth. The model depth is set by the program using
the domain size from the EquivAutoGrid object below.
Field: TDEEPin
The fixed lower level temperature as described in the FIXBC field.
Field: USPHflag: Is the ground surface h specified by the user?
This field flags the use of a user specified heat transfer coefficient on the ground surface.
This condition is used primarily for testing. For normal runs (USPHflag is FALSE), the
program calculates the heat transfer coefficient using the weather conditions.
Field: USERH: User specified ground surface heat transfer coeff
This field supplies the value of the heat transfer coefficient if USPHflag is TRUE. [W/(m2 K)
The BoundConds object is shown below:
BoundConds,
A1, \field EVTR: Is surface evapotranspiration modeled
\type choice
\key TRUE
\key FALSE
A2, \field FIXBC: is the lower boundary at a fixed temperature
\type choice
\key TRUE
\key FALSE
\note FALSE selects the zero flux lower boundary condition
N1, \field TDEEPin,
\note User input lower boundary temperature if FIXBC is TRUE
\units C
\note Blank for FIXBC FALSE or
\note to use the calculated 1-D deep ground temperature.
A3, \field USRHflag: Is the ground surface h specified by the user?
\type choice
\key TRUE
\key FALSE
N2; \field USERH: User specified ground surface heat transfer coeff
\units W/(m2 K)
\note Used only if USRHflag is TRUE
BldgProps Object
This object provides information about the building and its operating conditions.
4/23/05
66
GROUND HEAT TRANSFER IN ENERGYPLUS
DESCRIPTION OF THE OBJECTS IN THE E+SLABGHT.IDD
Field: IYRS Number of years to iterate
This field specifies the number of years to iterate. This means that the simulation comes to
an either an annual steady periodic condition by converging to a tolerance (see ConvTol field)
or it runs for this number of years. A ten year maximum is usually sufficient. It is important to
note that the ground heat transfer behavior will change during the first several years of
operating a ground contact structure. It takes several years to change from the undisturbed
profile to the disturbed profile under a building.
Field: Shape Slab shape
Use only the value 0 here. Only a rectangular shape is implemented.
Field: HBLDG: Building Height
This field supplies the building height. This is used to calculate the building shadowing on the
ground. Height is in meters.
Field: TIN1 – TIN12 <month> Indoor Average temperature set point
The next twelve fields specify the average indoor building set point temperatures for each
month of the year. These fields are useful for simulating a building that is not temperature
controlled for some of the year. In such a case, the average indoor set point temperatures
can be obtained by first running the model in EnergyPlus with an insulated floor boundary
condition, and then using the resulting monthly average zone temperatures in these fields.
Field: TINAmp: Daily Indoor sine wave variation amplitude
This field permits imposing a daily sinusoidal variation in the indoor setpoint temperature to
simulate the effect of a setback profile. The value specified will be the amplitude of the sine
wave.
Field: ConvTol: Convergence Tolerance
This final field specifies the convergence tolerance used to control the iteration. When the
temperature change of all nodes is less than the convergence value, iteration ceases.
The entire BldgProps Oject is shown below.
BldgProps,
N1, \field IYRS: Number of years to iterate
\note typical value= 10
N2, \field Shape: Slab shape
\note only value= 0
N3, \field HBLDG: Building height
\note typical value= 0-20
\units m
N4, \field TIN1: January Indoor Average temperature set point
\note typical value=22
\units C
N5, \field TIN2: February Indoor Average temperature set point
\note typical value=22
\units C
N6, \field TIN3: March Indoor Average temperature set point
\note typical value=22
\units C
N7, \field TIN4: April Indoor Average temperature set point
\note typical value=22
\units C
N8, \field TIN5: May Indoor Average temperature set point
\note typical value=22
\units C
4/23/05
67
GROUND HEAT TRANSFER IN ENERGYPLUS
DESCRIPTION OF THE OBJECTS IN THE E+SLABGHT.IDD
N9, \field TIN6: June Indoor Average temperature set point
\note typical value=22
\units C
N10, \field TIN7: July Indoor Average temperature set point
\note typical value=22
\units C
N11, \field TIN8: August Indoor Average temperature set point
\note typical value=22
\units C
N12, \field TIN9: September Indoor Average temperature set point
\note typical value=22
\units C
N13, \field TIN10: October Indoor Average temperature set point
\note typical value=22
\units C
N14, \field TIN11: NovemberIndoor Average temperature set point
\note typical value=22
\units C
N15, \field TIN12: December Indoor Average temperature set point
\note typical value=22
\units C
N16, \field TINAmp: Daily Indoor sine wave variation amplitude
\note typical value: 0
\units C
N17; \field ConvTol: Convergence Tolerance
\note typical value= 0.1
Insulation Object
This object supplies the information about insulation used around the slab. There are two
possible configurations: under the slab or vertical insulation around the slab.
Field RINS: R value of under slab insulation
This field provides the thermal resistance value of the under slab insulation. It should be zero
if the vertical insulation configuration is selected. Units are m^2 K/W.
Field DINS: Width of strip of under slab insulation
This specifies the width of the perimeter strip of insulation under the slab in meters. Again a
zero value should be used for the vertical insulation configuration.
Field RVINS: R value of vertical insulation
This field specifies the thermal resistance of the vertical insulation. It should be zero if the
under slab insulation configuration is in effect.
Field ZVINS: Depth of vertical insulation
This field specifies the depth of the vertical insulation into the ground in meters. Note that it
starts at the slab upper surface and extends into the ground. Only .2 .4 .6 .8 1.0 1.5 2.0 2.5
or 3.0 m should be used.
Field IVINS: Flag: Is there vertical insulation?
This final field specifies that vertical the vertical insulation configuration is being used. The
value of 1 specifies yes and 0 specifies no.
The Insulation object is shown below.
Insulation,
4/23/05
68
GROUND HEAT TRANSFER IN ENERGYPLUS
DESCRIPTION OF THE OBJECTS IN THE E+SLABGHT.IDD
N1, \field RINS: R value of under slab insulation
\note typical value= 0-2.0
\units m2-K/W
N2, \field DINS: Width of strip of under slab insulation
\note typical value= 0-2.0
\units m
N3, \field RVINS: R value of vertical insulation
\note typical value= 0-3.0
\units m2-K/W
N4, \field ZVINS: Depth of vertical insulation
\note only use values= .2 .4 .6 .8 1.0 1.5 2.0 2.5 3.0
\units m
N5; \field IVINS: Flag: Is there vertical insulation
\note values: 1=yes 0=no
EquivSlab Object
This object provides the basic information for running a model that uses the area over
perimeter ratio of the slab to determine the size of an equivalent rectangular slab.
Field APRatio: The area to perimeter ratio for this slab
This field specifies the area over perimeter ratio of the slab in meters.
Field: EquivSizing
This field value should be TRUE. This means that the program will determine the dimensions
of the equivalent slab that satisfactorily models the A/P ratio.
The object is shown below.
EquivSlab,
\memo Using an equivalent slab allows non-rectangular shapes to be modelled
accurately
\memo The simulation default should be EquivSizing=True
N1, \field APRatio: The area to perimeter ratio for this slab
\units m
A1; \field EquivSizing:
\note Flag: Will the dimensions of an equivalent slab
\note be calculated (TRUE) or will the dimensions be input
directly? (FALSE)
\note It is recommended that EnergyPlus users use TRUE.
EquivAutoGrid Object
This object provides the information needed by the program to automatically generate the
calculation grid when the slab is described as an equivalent slab. It is necessary for
EnergyPlus users because equivalent slab is the appropriate option.
Field SLABDEPTH: Thickness of slab on grade
This field specifies the thickness of the slab in meters. Note that the slab top surface is level
with the ground surface, so this is the depth into the ground. The slab depth has a significant
effect on the temperature calculation, and it is also important for the auto-grid process. The
finite difference grids are set in such a way that they use the slab thickness to determine the
vertical grid spacing. Because of this, autogridding will fail if the slab thickness is specified
larger than 0.25 meters. The program also is set up so that the slab is a single finite
difference cell in the vertical direction. Thus, if the slab thickness is set too large, the
accuracy of the calculation may be suspect. The results with three different slab thicknesses
are shown below.
4/23/05
69
GROUND HEAT TRANSFER IN ENERGYPLUS
DESCRIPTION OF THE OBJECTS IN THE E+SLABGHT.IDD
All other inputs for the runs were the same. It is clear that the slab thickness has a significant
effect because of the horizontal component of conduction in both directions in the slab.
Field CLEARANCE: Distance from edge of slab to domain edge
This field specifies the distance from the slab to the edge of the area that will be modeled
with the grid system. It is the basic size dimension that is used to set both the horizontal and
vertical extent of the domain. The units are meters, and 15 meters is a reasonable value.
The EquivAutoGrid object is shown below.
EquivAutoGrid, \memo EquivAutoGrid only necessary when EquivSizing is true
\memo EnergyPlus users normally use this option.
N1, \field SLABDEPTH: Thickness of slab on grade
\note typical value= 0.1
\units m
N2; \field CLEARANCE: Distance from edge of slab to domain edge
\note typical value= 15.0
\units m
Figure 10. Illustration of Slab Thickness vs Outside Temperature
Additional Objects
There are five additional objects in the IDD and IDF that can be used under very special
situations by researchers who want to generate special calculation grids. They are normally
not useful to EnergyPlus users. They will be shown as IDD sections only. They do not need
to be in the IDF.
AutoGrid,
\memo AutoGrid only necessary when EquivSizing is false
\memo Not normally needed by EnergyPlus users.
N1, \field SLABX: X dimension of the building slab
\note typical values= 0-60.0
\units m
N2, \field SLABY: Y dimension of the building slab
\note typical values= 0-60.0
4/23/05
70
GROUND HEAT TRANSFER IN ENERGYPLUS
DESCRIPTION OF THE OBJECTS IN THE E+SLABGHT.IDD
\units m
N3, \field SLABDEPTH: Thickness of slab on grade
\note typical value= .1
\units m
N4; \field CLEARANCE: Distance from edge of slab to domain edge
\note typical value= 15.0
\units m
!
ManualGrid, \memo Manual Grid only necessary using manual gridding (not
recommended)
\memo
Used only in special cases.
N1, \field NX: Number of cells in the X direction
\note typical values= 15
N2, \field NY: Number of cells in the Y direction
\note typical values= 15
N3, \field NZ: Number of cells in the Z direction
\note typical values= 15
N4, \field IBOX: X direction cell indicator of slab edge
\note typical values= 1-10
N5; \field JBOX: Y direction cell indicator of slab edge
\note typical values= 1-10
!
XFACE, \memo This is only needed when using manual gridding (not
recommended)
\memo XFACE: X Direction cell face coordinates: m
N1, N2, N3, N4, N5, N6, N7, N8, N9, N10, N11, N12, N13, N14,
N15, N16, N17, N18, N19, N20, N21, N22, N23, N24, N25, N26, N27, N28, N29,
N30, N31, N32, N33, N34, N35, N36, N37, N38, N39, N40;
!
YFACE, \memo This is only needed when using manual gridding (not
recommended)
\memo YFACE: Y Direction cell face coordinates: m,
N1, N2, N3, N4, N5, N6, N7, N8, N9, N10, N11, N12, N13, N14,
N15, N16, N17, N18, N19, N20, N21, N22, N23, N24, N25, N26, N27, N28, N29,
N30, N31, N32, N33, N34, N35, N36, N37, N38, N39, N40;
!
ZFACE, \memo This is only needed when usuing manual gridding (not
recommended)
\memo ZFACE: Z Direction cell face coordinates: m
N1, N2, N3, N4, N5, N6, N7, N8, N9, N10, N11, N12, N13, N14,
N15, N16, N17, N18, N19, N20, N21, N22, N23, N24, N25;
Sample IDF File – Slab Program
A sample IDF file is shown below.
!-Generator IDFEditor 1.12
!-NOTE: All comments with '!-' are ignored by the IDFEditor and are generated
automatically.
!Use '!' comments if they need to be retained when using the
IDFEditor.
!=========== ALL OBJECTS IN CLASS: MATERIALS ===========
Materials,
2,
!- NMAT: Number of materials
0.158,
!- ALBEDO: Surface Albedo: No Snow
0.379,
!- ALBEDO: Surface Albedo: Snow
0.9,
!- EPSLW: Surface Emissivity: No Snow
0.9,
!- EPSLW: Surface Emissivity: Snow
0.75,
!- Z0: Surface Roughness: No Snow
0.03,
!- Z0: Surface Roughness: Snow
6.13,
!- HIN: Indoor HConv: Downward Flow {W/m2-K}
9.26;
!- HIN: Indoor HConv: Upward {W/m2-K}
4/23/05
71
GROUND HEAT TRANSFER IN ENERGYPLUS
!-
===========
MatlProps,
2300,
1200,
653,
1200,
0.93,
1;
!-
===========
BoundConds,
TRUE,
TRUE,
FALSE;
!-
===========
BldgProps,
10,
0,
4,
18,
18,
18,
20,
20,
20,
22,
22,
22,
22,
20,
20,
0,
0.10;
!-
===========
Insulation,
0.,
0.,
2.0,
2.0,
1;
!-
===========
EquivSlab,
10,
TRUE;
!-
===========
EquivAutoGrid,
0.1,
4/23/05
DESCRIPTION OF THE OBJECTS IN THE E+SLABGHT.IDD
ALL OBJECTS IN CLASS: MATLPROPS ===========
!!!!!!-
RHO: Slab Material density {kg/m3}
RHO: Soil Density {kg/m3}
CP: Slab CP {J/kg-K}
CP: Soil CP {J/kg-K}
TCON: Slab k {W/m-K}
TCON: Soil k {W/m-K}
ALL OBJECTS IN CLASS: BOUNDCONDS ===========
!- EVTR: Is surface evapotranspiration modeled
!- FIXBC: is the lower boundary at a fixed temperature
!- OLDTG: is there an old ground temperature file
ALL OBJECTS IN CLASS: BLDGPROPS ===========
!!!!!!!!!!!!!!!!!-
IYRS: Number of years to iterate
Shape: Slab shape
HBLDG: Building height {m}
TIN1: January Indoor Average temperature set point {C}
TIN2: February Indoor Average temperature set point {C}
TIN3: March Indoor Average temperature set point {C}
TIN4: April Indoor Average temperature set point {C}
TIN5: May Indoor Average temperature set point {C}
TIN6: June Indoor Average temperature set point {C}
TIN7: July Indoor Average temperature set point {C}
TIN8: August Indoor Average temperature set point {C}
TIN9: September Indoor Average temperature set point {C}
TIN10: October Indoor Average temperature set point {C}
TIN11: NovemberIndoor Average temperature set point {C}
TIN12: December Indoor Average temperature set point {C}
TINAmp: Daily sine wave variation amplitude {C}
ConvTol: Convergence Tolerance
ALL OBJECTS IN CLASS: INSULATION ===========
!!!!!-
RINS: R value of under slab insulation {m2-K/W}
DINS: Width of strip of under slab insulation {m}
RVINS: R value of vertical insulation {m2-K/W}
ZVINS: Depth of vertical insulation {m}
IVINS: Flag: Is there vertical insulation
ALL OBJECTS IN CLASS: EQUIVSLAB ===========
!- APRatio: The area to perimeter ratio for this slab {m}
!- EquivSizing:
ALL OBJECTS IN CLASS: EQUIVAUTOGRID ===========
!- SLABDEPTH: Thickness of slab on grade {m}
72
GROUND HEAT TRANSFER IN ENERGYPLUS
15;
!-
===========
AutoGrid,
12,
12,
0.1,
15;
USING GROUND TEMPERATURES WITH BASEMENTS
!- CLEARANCE: Distance from edge of slab to domain edge {m}
ALL OBJECTS IN CLASS: AUTOGRID ===========
!!!!-
SLABX: X dimension of the building slab {m}
SLABY: Y dimension of the building slab {m}
SLABDEPTH: Thickness of slab on grade {m}
CLEARANCE: Distance from edge of slab to domain edge {m}
Using Ground Temperatures With Basements
The basement routine is used to calculate the face temperatures on the outside of the
basement wall or the floor slab. This is the plane between the outside insulation and the
basement wall. The insulation thermal resistance can range from zero (no insulation) to any
reasonable value. The units are K/(W/m2). The program will simulate two conditions: full
insulation from grade to the footing or half insulation that extends halfway down from grade to
footing. The temperature on this plane is used with the OTHERSIDECOEFFICIENTS object
in EnergyPlus to supply the outside face temperature of the walls or slab.
4/23/05
73
GROUND HEAT TRANSFER IN ENERGYPLUS
USING GROUND TEMPERATURES WITH BASEMENTS
Figure 11. Basement Configuration
The output from the program is a csv file as shown below.
4/23/05
74
GROUND HEAT TRANSFER IN ENERGYPLUS
USING GROUND TEMPERATURES WITH BASEMENTS
Figure 12. Output from Basement program
Column B gives the basement zone temperature. This can vary month by month as will be
explained later. Column C is the monthly average wall outside face temperature, as shown in
the diagram above. Column D is the corresponding average monthly average inside wall
face temperature. Columns E and F contain the same information for the basement floor
slab. Columns G-J contain the same information for the upper half and the lower half of the
basement walls.
Columns K through N contain the monthly average heat flux for the floor, the walls, the upper
half of the walls and the lower half of the walls. The flux is reported in units of W/squaremeter.
The Basement idd
The basement idd objects and fields are shown below.
! Basement foundation heat transfer module Input Data Dictionary file
! Created:
August 18, 2000
! Written by: Edward Clements
! Modified for EnergyPlus Auxiliary Application by C. O. Pedersen 10/04
! Description format: FORTRAN var.: description, units, typ. values
!
SimParameters,
N1, \field F: Multiplier for the ADI solution:
\note 0<F<1.0,
\note typically 0.1 (0.5 for high k soil]
N2; \field IYRS: Maximum number of yearly iterations:
\note typically 15-30]
!
MatlProps,
N1, \field NMAT: Number of materials in this domain, UP TO 6]
N2, \field Density for Foundation Wall
\note typical value 2243
\units kg/m^3
N3, \field density for Floor Slab
\note typical value 2243
\units kg/m^3
N4, \field density for Ceiling
\note typical value 311
\units kg/m^3
N5, \field density for Soil
\note typical value 1500
\units kg/m^3
4/23/05
75
GROUND HEAT TRANSFER IN ENERGYPLUS
USING GROUND TEMPERATURES WITH BASEMENTS
N6, \field density for Gravel
\note typical value 2000
\units kg/m^3
N7, \field density for Wood
\note typical value 449
\units kg/m^3
N8,
N9,
N10,
N11,
N12,
N13,
N14,
N15,
N16,
N17,
N18,
N19;
\field Specific heat for foundation wall
\note typical value 880
\units J/kg-K
\field Specific heat for floor slab
\note typical value 880
\units J/kg-K
\field Specific heat for ceiling
\note typical value 1530
\units J/kg-K
\field Specific heat for soil
\note typical value 840
\units J/kg-K
\field Specific heat for gravel
\note typical value 720
\units J/kg-K
\field Specific heat for wood
\note typical value 1530
\units J/kg-K
\field Thermal conductivity for foundation wall
\note typical value 1.4
\units W/m-K
\field Thermal conductivity for floor slab
\note typical value 1.4
\units W/m-K
\field Thermal conductivity for ceiling
\note typical value 0.09
\units W/m-K
\field thermal conductivity for soil
\note typical value 1.1
\units W/m-K
\field thermal conductivity for gravel
\note typical value 1.9
\units W/m-K
\field thermal conductivity for wood
\note typical value 0.12
\units W/m-K
!
Insulation,
N1, \field REXT: R Value of any exterior insulation, K/(W/m^2)]
\units K/(W/m^2)
A1; \field INSFULL: Flag: Is the wall fully insulated?
\note True for full insulation
\note False for insulation half way down side wall from grade line
!
SurfaceProps,
N1, \field ALBEDO: Surface albedo for No snow conditions
\note typical value 0.16
N2, \field ALBEDO: Surface albedo for snow conditions
\note typical value 0.40
N3, \field EPSLN: Surface emissivity No Snow
\note typical value 0.94
N4, \field EPSLN: Surface emissivity with Snow
\note typical value 0.86
N5, \field Surface roughness No snow conditions
\note typical value 6.0
\units cm
N6, \field VEGHT: Surface roughness NS/S, cm, 6.0, 0.25]
\note typical value 0.25
\units cm
A1; \field PET: Flag, Potential evapotranspiration on? T/F]
\note Typically, PET is True
!
4/23/05
76
GROUND HEAT TRANSFER IN ENERGYPLUS
USING GROUND TEMPERATURES WITH BASEMENTS
BldgData,
N1, \field DWALL: Wall thickness,
\note typical value .2]
\units m
N2, \field DSLAB: Floor slab thickness,
\units m
\maximum 0.25
N3, \field DGRAVXY: Width of gravel pit beside basement wall
\units m
N4, \field DGRAVZN: Gravel depth extending above the floor slab
\units m
N5; \field DGRAVZP: Gravel depth below the floor slab,
\units m
\note typical value 0.1
!
Interior,
A1, \field COND: Flag: Is the basement conditioned? TRUE/FALSE]
! [HIN: Indoor convective heat transfer coefficients, W/m^2
!
Convection Only: 1)Q Downward 2)Q Upward 3)Q Horizontal
!
Conv and Radiation: 4)Q Downward 5)Q Upward 6)Q Horizontal]
N1, N2, N3, N4, N5, N6;
!
ComBldg,
!
[Tbasement: Basement monthly average temperature, C ]
N1, !Jan
N2, !Feb
N3, !Mar
N4, !Apr
N5, !May
N6, !Jun
N7, !Jul
N8, !Aug
N9, !Sep
N10, !Oct
N11, !Nov
N12, !Dec
N13; ! Daily variation sine wave amplitude, C. (Normally zero, just for checking)
!
EquivSlab, ! Supplies the EquivSizing Flag
! Using an equivalent slab allows non-rectangular shapes to be
!
modeled accurately.
! The simulation default should be EquivSizing=True
N1, \field APRatio: The area to perimeter ratio for this slab
\ units m
!
A1; \field EquivSizing: Flag:
\note Will the dimensions of an equivalent slab be calculated (TRUE)
\note or will the dimensions be input directly? (FALSE)]
\note Only advanced special simulations should use FALSE.
!
EquivAutoGrid, \note EquivAutoGrid necessary when EquivSizing=TRUE
\note
This is the normal case.
N1, \field CLEARANCE: Distance from outside of wall to edge,
\units m
\note typical value 15m
N2, \field ConcAGHeight: Height of foundation wall above grade
\note for energyplus, this should be zero. Simulate such sections
\note with normal EnergyPlus walls.
\units m
N3, \field SlabDepth: Thickness of the floor slab,
\units m
\note typical value 0.1
N4; \field BaseDepth: Depth of the basement wall below grade
\units m
4/23/05
77
GROUND HEAT TRANSFER IN ENERGYPLUS
DESCRIPTION OF THE OBJECTS IN THE BASEMENTGHT.IDD
!
!
!
! ******** The following input objects are required only for special cases.
!
AutoGrid,
! NOTE: AutoGrid only necessary when EquivSizing is false
! If the modelled building is not a rectangle or square, Equivalent
! sizing MUST be used to get accurate results
N1, \field CLEARANCE: Distance from outside of wall to edge, 15m]
N2, \field SLABX: X dimension of the building slab, 0-60.0 m]
N3, \field SLABY: Y dimension of the building slab, 0-60.0 m]
N4, \field ConcAGHeight: Height of the fndn wall above grade, m]
N5, \field SlabDepth: Thickness of the floor slab, m, 0.1]
N6; \field BaseDepth: Depth of the basement wall below grade, m]
!
ManualGrid, ! NOTE: Manual Grid only necessary using manual gridding
! (not recommended)
N1, \field NX: Number of cells in the X direction: 20]
N2, \field NY: Number of cells in the Y direction: 20]
N3, \field NZAG: Number of cells in the Z direction
!
above grade: 4 Always]
N4, \field NZBG: Number of cells in Z dir. below grade: 10-35]
N5, \field IBASE: X direction cell indicator of slab edge: 5-20]
N6, \field JBASE: Y direction cell indicator of slab edge: 5-20]
N7; \field KBASE: Z direction cell indicator
!
of the top of the floor slab: 5-20]
!
XFACE,
! NOTE: This is only needed when usuing manual gridding
! (not recommended)
!
[XFACE: X Direction cell face coordinates: m]
N1, N2, N3, N4, N5, N6, N7, N8, N9, N10, N11, N12, N13, N14,
N15, N16, N17, N18, N19, N20, N21, N22, N23, N24, N25, N26,
N27, N28, N29, N30, N31, N32, N33, N34, N35, N36, N37, N38,
N39, N40, N41, N42, N43, N44;
!
YFACE, ! NOTE: This is only needed when usuing manual gridding
! (not recommended)
!
[YFACE: Y Direction cell face coordinates: m],
N1, N2, N3, N4, N5, N6, N7, N8, N9, N10, N11, N12, N13, N14,
N15, N16, N17, N18, N19, N20, N21, N22, N23, N24, N25, N26,
N27, N28, N29, N30, N31, N32, N33, N34, N35, N36, N37, N38,
N39, N40, N41, N42, N43, N44;
!
ZFACE, ! NOTE: This is only needed when usuing manual gridding
! (not recommended)
!
[ZFACE: Z Direction cell face coordinates: m]
N1, N2, N3, N4, N5, N6, N7, N8, N9, N10, N11, N12, N13, N14,
N15, N16, N17, N18, N19, N20, N21, N22, N23, N24, N25, N26,
N27, N28, N29, N30, N31, N32, N33, N34, N35, N36, N37, N38,
N39, N40;
Description of the Objects in the BasementGHT.idd
SimParameters Object
Field: F: Multiplier for the ADI solution:
This field specifies a alternating direction iteration scheme multiplier. It should normally be
set to 0.1. It can be increased if the soil conductivity is high.
Field: IYRS: Maximum number of yearly iterations:
This specifies the maximum number of years the simulation will be allowed to run. If
convergence is reached, the simulation will not run this long. It can be used to stop
simulation before quasi steady convergence state is reached.
4/23/05
78
GROUND HEAT TRANSFER IN ENERGYPLUS
DESCRIPTION OF THE OBJECTS IN THE BASEMENTGHT.IDD
MatlProps Object
Field 1: This field specifies the number of materials whose properties are going to be
specified. The order of the materials is not adjustable so six materials need to be specified.
For the EnergyPlus basement application, only the foundation wall, floor slab, soil, and gravel
are used.
Fields 2 – 19: These eighteen fields specify the density, specific heat, and thermal
conductivity for the materials in groups of six.
SurfaceProps Object
The first six fields in this object specify the parameters used in the surface heat transfer
boundary condition determination. They are specified for no snow and snow covered
conditions.
Field N1 and N2: These fields specify the surface solar albedo for no snow and snow covered
conditions. Solar albedo is more commonly available than the solar absorptivity. The total
solar energy absorbed by a horizontal surface is (1-albedo)*(Total solar).
Fields N3 and N4: These fields specify the long wavelength or thermal radiation emissivity for
the ground surface under no snow and snow conditions.
Fields N5 and N6: These fields specify the surface roughness or vegetation height that is
used in determining the convective heat transfer coefficient on the surface. Both no snow
and snow conditions are required.
Field A1: This field is a flag that invokes the evapotranspiration calculation at the surface.
This covers all forms of latent heat transfer from the surface. It normally should be included.
BldgData Object
This object specifies the major configuration parameters for the basement. The 3-D grid
used in the simulation has the capability of including a gravel “fill” around the basement. Thus
several dimensions must be specified. All units are in meters.
Field N1: This specifies the basement wall thickness.
Field N2: This specifies the thickness of the floor slab
Field N3: This specifies the width of the gravel “fill” bed beside the basement wall.
Field N4: This specifies the depth of the gravel fill above the floor slab.
Field N5: This specifies the depth of the gravel fill below the floor slab.
Interior Object
This object provides the information needed to simulate the boundary conditions inside the
basement.
Field A1: This flag indicates that the basement temperature is controlled. For EnergyPlus
runs, this should be TRUE.
Fields N1 – N3: These fields specify the convection only heat transfer coefficients for the
walls(horizontal heat flux)) and the floor(downward heat flux).
Fields N4-N6: These specify the combined thermal radiation and convection heat transfer
coefficients that are used in the basement calculation. The same directions apply.
4/23/05
79
GROUND HEAT TRANSFER IN ENERGYPLUS
IMPORTANT FILES FOR GROUND HEAT TRANSFER WITH BASEMENTS
ComBldg Object
This object specifies the 12 monthly average basement temperatures (air temperature). The
last field (N13) allows a daily sine wave variation to be placed on the inside temperature.
This was used primarily to determine that it has very little effect on the results.
EquivSlab Object
This object provides the information needed to do the simulation as an equivalent square
geometry by utilizing the area to perimeter ratio. This procedure was shown to be accurate
by Cogil (1998). Field N1 specifies the A/P ratio and Field A1 should always be TRUE unless
the user wants to specifically look at the differences between the long wall and the short wall
on a rectangular configuration.
EquivAutoGrid Object
This is necessary object since field A1 in the EquivSlab object is TRUE. This object provides
the information needed to set up the three dimensional conduction grid surrounding the
basement.
Field N1 specifies the distance to the outside of the field from the basement wall. It has been
determined that 15 meters is quite satisfactory.
Field N2 specifies the height of the basement wall above the grade level. This should be
zero for EnergyPlus runs since if an above grade segment is to be simulated, it should be
done with EnergyPlus not with the basement program.
Field N3 specifies the floor slab thickness.
Field N4 specifies the depth of the basement wall below grade level. This is the height of the
wall above the footing.
Important Files for Ground Heat Transfer with Basements
The basement program used to calculate the results is included with the EnergyPlus
distribution. It requires an input file named BasementGHTin.idf in input data file format. The
needed corresponding idd file is BasementGHT.idd. An EnergyPlus weather file for the
location is also needed. A batch file, RunBasement, is placed in the same folder with the
program and sample files. To use it (Command mode or DOS mode), one may modify
several important lines:
:Instructions:
: Complete the following path and program names.
: path names must have a following \ or errors will happen
set program_path=
set program_name=Basement.exe
set input_path=
set output_path=
set weather_path=C:\EnergyPlus\WeatherData\
and then in command mode issue the run command:
RunBasement myinput Chicago
Where you would have myinput.idf in “input_path” and Chicago would be the name of the
.epw file in the “weather_path”.
You should set up the command mode so that it does not automatically close the window at
the end of program termination if you want to see the commands as they run and know for
sure that no errors occurred.
4/23/05
80
GROUND HEAT TRANSFER IN ENERGYPLUS
IMPORTANT FILES FOR GROUND HEAT TRANSFER WITH BASEMENTS
Sample idf File - Basement
! Minneapolis Test Cases
SimParameters,
0.1,
! [F: Multiplier for the ADI solution: 0<F<1.0,
!
typically 0.1 (0.5 for high k
1;
! [IYRS: Maximum number of iterations: typically 25-30
!
MatlProps,
6, ! [NMAT: Number of materials in this domain, UP TO 6]
2242.6, 2242.6, 311.66, 1500.0, 2000.0, 448.5,!
[RHO(1-6): Matl density
!(Fndn wall, Floor Slab, Ceiling,Soil, Gravel, Wood), kg/m^3, ]
880.0, 880.0, 1513.0, 840.0, 720.0, 1630.0,!
[CP(1-6): Specific Heat: J/kg-K,
1.402, 1.402, 0.093, 0.5, 1.9, 0.119; !
[TCON(1-6): Conductivity: W/m-K
!
Insulation,
5.0, ! [REXT: R Value of any exterior insulation, K/(W/m^2)]
TRUE; ! [INSFULL: Flag: Is the wall fully insulated? TRUE/FALSE]
!
SurfaceProps,
.16, .40, ! [ALBEDO: Surface albedo array, .16 .40]
.94, .86, ! [EPSLN: Surface emissivity No Snow/ Snow .94 .86]
6.0, 0.25, ! [VEGHT: Surface roughness NS/S, cm, 6.0, 0.25]
TRUE;! [PET: Flag, Potential evapotranspiration on? T/F]
!
Typically, PET is True
!
BldgData,
.2, ! [DWALL: Wall thickness, m, .2]
.1, ! [DSLAB: Floor slab thickness, m, 0.1]
.3, ! [DGRAVXY: Width of gravel pit beside footing, m, 0.3]
.2, ! [DGRAVZN: Gravel depth above the floor slab, m, 0.2]
.1;! [DGRAVZP: Gravel depth below the floor slab, m, 0.1]
!
Interior,
TRUE, ! [COND: Flag: Is the basement conditioned? TRUE/FALSE]
!
[HIN: Indoor convective heat transfer coefficients, W/m^2
!
Convection Only: 1)Q Downward 2)Q Upward 3)Q Horizontal
!
Conv and Radiation: 4)Q Downward 5)Q Upward 6)Q Horizontal]
0.92, !Q Downward Convection Only
4.04,!Q Upward Convection Only
3.08,!Q HorizontalConvection Only
6.13, !Q Downward Conv and Radiation
9.26, !Q Upward Conv and Radiation
8.29;!Q Horizontal Conv and Radiation
!
EquivSlab,
15.0, ! [APRatio: The area to perimeter ratio for this slab: m]
!
TRUE;! [EquivSizing: Flag: Will the dimensions of an equivalent
!
slab be calculated (TRUE) or will the dimensions be
!
input directly? (FALSE)]
!
Only advanced special simulations should use FALSE.
!
4/23/05
81
GROUND HEAT TRANSFER IN ENERGYPLUS
USING THE INTERFACE SURFACE TEMPERATURE RESULTS IN ENERGYPLUS
EquivAutoGrid,
! NOTE: EquivAutoGrid necessary when EquivSizing=TRUE
!
This is the normal case.
! If the modelled building is not a rectangle or square, Equivalent
! sizing MUST be used to get accurate results
!
15, ! [CLEARANCE: Distance from outside of wall to edge, 15m]
.1, ! [SlabDepth: Thickness of the floor slab, m, 0.1]
2.4; ! [BaseDepth: Depth of the basement wall below grade, m]
!
!
ComBldg, ! Commercial building
20., ! Jan Ave basement temp
20., ! Feb Ave basement temp
20., ! Mar Ave basement temp
20., ! Apr Ave basement temp
20., ! May Ave basement temp
20., ! Jun Ave basement temp
20., ! Jul Ave basement temp
20., ! Aug Ave basement temp
20., ! Sep Ave basement temp
20., ! Oct Ave basement temp
20., ! Nov Ave basement temp
20., ! Dec Ave basement temp
0.0; ! Daily variation Sine Wave amplitude
Using the Interface Surface Temperature Results in EnergyPlus
The monthly results from the basement program are used with the
OTHERSIDECOEFFICIENTS object in EnergyPlus. The idd corresponding to that object is
shown below. The two applicable fields are N2 and A2. N2 should have the value 1.0. It will
be modified by a schedule that is named in A2, and that temperature will be used on the
outside of the surface specified as having the OtherSideCoeffcients named in A1.
OtherSideCoefficients,
A1, \field OtherSideCoeff Name
\required-field
\reference OSCNames
\reference OutFaceEnvNames
N1, \field Combined convective/radiative film coefficient
\required-field
\type real
\note if>0, N1 becomes exterior convective/radiative film coefficient and other fields
\note are used to calc outside air temp then exterior surface temp based on outside air
\note and specified coefficient
\note if<=0, then remaining fields calculate the outside surface temperature(?)
\note following fields are used in the equation:
\note SurfTemp=N7*TempZone + N4*OutsideDryBulb + N2*N3 + GroundTemp*N5 + WindSpeed*N6*OutsideDryBulb
N2, \field User selected Constant Temperature
\units C
\type real
\note This parameter will be overwritten by the values from the schedule(A2 below) if one is present
N3, \field Coefficient modifying the user selected constant temperature
\note This coefficient is used even with a schedule. It should normally be 1.0 in that case
N4, \field Coefficient modifying the external dry bulb temperature
\type real
N5, \field Coefficient modifying the ground temperature
\type real
N6, \field Coefficient modifying the wind speed term (s/m)
\type real
N7, \field Coefficient modifying the zone air temperature part of the equation
\type real
A2; \field Name of Schedule for values of "const" temperature. Schedule values replace N2.
\type alpha
A sample idf for this object is shown below.
4/23/05
82
GROUND HEAT TRANSFER IN ENERGYPLUS
MULTIPLE GROUND TEMPERATURES
OtherSideCoefficients, OSCCoef:Zn005:Wall003, !- OSC Name
! Example input for second ground temperature
0.0000000E+00,
!- OSC SurfFilmCoef
0.000000
,
!- OSC Temp
1.000000
,
!- OSC Temp Coef
0.000000
,
!- OSC dry-bulb
0.000000
,
!- OSC GrndTemp
0.000000
,
!- OSC WindSpdCoeff
0.000000
,
!- OSC ZoneAirTemp
GroundTempSched; ! Name of schedule defining additional ground temperature.
The OSC object can be repeated for as many outside temperatures as needed. A more
detailed explanation of how to use this object is contained in the next section.
Multiple Ground Temperatures
These three objects show how the OtherSideCoefficients object can be used to provide extra
ground temperatures for surfaces exposed to different ground temperatures.
Here is the surface description.
OtherSideCoeff.
Surface:HeatTransfer,
!========================
OSCTest:South Wall,
Wall,
Exterior,
OSCTest,
!ExteriorEnvironment,
!OSCTest:South Wall,
OtherSideCoeff,
ExampleOSC,
NoSun ,
NoWind ,
0.5,
4,
surface
0,
0,
0,
6.096,
0,
0,
6.096,
0,
4.572,
0,
0,
4.572;
!!!!-
Note that the OutsideFaceEnvironment is specified as
User Supplied Surface Name
Surface Type
Construction Name of the Surface
InsideFaceEnvironment
!- OutsideFaceEnvironment
!- OutsideFaceEnvironment Object
!- Sun Exposure
!- Wind Exposure
!- View Factor to Ground
!- Number of Surface Vertex Groups -- Number of (X,Y,Z) groups in this
!!!!!!!!!!!!-
Vertex
Vertex
Vertex
Vertex
Vertex
Vertex
Vertex
Vertex
Vertex
Vertex
Vertex
Vertex
1
1
1
2
2
2
3
3
3
4
4
4
X-coordinate
Y-coordinate
Z-coordinate
X-coordinate
Y-coordinate
Z-coordinate
X-coordinate
Y-coordinate
Z-coordinate
X-coordinate
Y-coordinate
Z-coordinate
{m}
{m}
{m}
{m}
{m}
{m}
{m}
{m}
{m}
{m}
{m}
{m}
The OtherSideCoefficients object has to supply the basic form of the environment. Note that
the name corresponds to thee name in the Surface object. This object also supplies the name
of a schedule that will provide the monthly ground temperature values.
OtherSideCoefficients,
ExampleOSC,
0,
1,
1,
0,
0,
0,
0,
GroundTempCompactSched;
N2.
4/23/05
!!!!!!!!!-
OtherSideCoeff Name
Combined convective/radiative film coefficient
User selected Constant Temperature {C}
Coefficient modifying the user selected constant temperature
Coefficient modifying the external dry bulb temperature
Coefficient modifying the ground temperature
Coefficient modifying the wind speed term (s/m)
Coefficient modifying the zone air temperature part of the equation
Name of Schedule for values of "const" temperature. Schedule values replace
83
GROUND HEAT TRANSFER IN ENERGYPLUS
REFERENCES
The schedule named in the last field of the OtherSideCoefficients object must be supplied. In
compact schedule format it would appear as follows.
SCHEDULE:COMPACT,
GroundTempCompactSched,
Temperature ,
Through: 1/31,
For:AllDays,
Until: 24:00,
16,
Through: 2/28,
For:AllDays,
Until: 24:00,
17,
Through: 3/31,
For:AllDays,
Until: 24:00,
18,
Through: 4/30,
For:AllDays,
Until: 24:00,
19,
Through: 5/31,
For:AllDays,
Until: 24:00,
20,
Through: 6/30,
For:AllDays,
Until: 24:00,
20,
Through: 7/31,
For:AllDays,
Until: 24:00,
20,
Through: 8/31,
For:AllDays,
Until: 24:00,
19,
Through: 9/30,
For:AllDays,
Until: 24:00,
18,
Through: 10/31,
For:AllDays,
Until: 24:00,
17,
Through: 11/30,
For:AllDays,
Until: 24:00,
16,
Through: 12/31,
For:AllDays,
Until: 24:00,
16;
!!!!!!!!!!!!!!!!!!!!!!!!!!!!!!!!!!!!!!!!!!!!!!!!!!-
Name
ScheduleType
Complex Field
Complex Field
Complex Field
Complex Field
Complex Field
Complex Field
Complex Field
Complex Field
Complex Field
Complex Field
Complex Field
Complex Field
Complex Field
Complex Field
Complex Field
Complex Field
Complex Field
Complex Field
Complex Field
Complex Field
Complex Field
Complex Field
Complex Field
Complex Field
Complex Field
Complex Field
Complex Field
Complex Field
Complex Field
Complex Field
Complex Field
Complex Field
Complex Field
Complex Field
Complex Field
Complex Field
Complex Field
Complex Field
Complex Field
Complex Field
Complex Field
Complex Field
Complex Field
Complex Field
Complex Field
Complex Field
Complex Field
Complex Field
#1
#2
#3
#4
#5
#6
#7
#8
#9
#10
#11
#12
#13
#14
#15
#16
#17
#18
#19
#20
#21
#22
#23
#24
#25
#26
#27
#28
#29
#30
#31
#32
#33
#34
#35
#36
#37
#38
#39
#40
#41
#42
#43
#44
#45
#46
#47
#48
References
Bahnfleth, W.P. 1989. Three Dimensional Modeling of Heat Transfer from Slab Floors. Ph.D.
diss., also published as USACERL TM E-89/11, University of Illinois.
Bahnfleth, W.P. and C.O. Pedersen. 1990. A Three Dimensional Numerical Study of Slab-onGrade Heat Transfer. ASHRAE Transactions Pt. 2, 96:61-72.
Clements, Edward, 2004, Three Dimensional Foundation Heat Transfer Modules for WholeBuilding Energy Analysis, MS Thesis, Pennsylvania State University.
4/23/05
84
GROUND HEAT TRANSFER IN ENERGYPLUS
REFERENCES
Cogil, Cynthia A.1998. Modeling of Basement Heat Transfer and Parametric Study of
Basement Insulation for Low Energy Housing. MS Thesis of Architectural Engineering,
Pennsylvania State University.
4/23/05
85
VCOMPARE
VCOMPARE USAGE
VCompare
In a perfect world, each developer change to the Data Dictionary/Object structure would be
upwards compatible from the previous version. And, we are reaching toward that goal, but
not quite there yet.
A small program “VCompare” (Energy+.idd Version Compare) has been developed that can
highlight the differences in two Energy+.idd files for you. Though it will be presented as a
user tool, it is most likely of more use to the Interface Developers that will be creating the
input files of the future.
Though in its release form, it will be used to highlight differences between the last release of
EnergyPlus and the current release, it can be used anywhere in a development as well. We
in the EnergyPlus development team have found it very useful during the march to the 1.0.1
release.
As an additional utility feature, VCompare can create new IDFs using the differences
between the two IDDs. Though this is not the preferred method for release conversions (see
next section in this document), it can be used as desired. The following instructions describe
the usage of VCompare.
Each release will also have an Objstats.xls file (see below) that will have formatting and
comments from the equivalent objstats.csv file that is produced when VCompare is run.
VCompare Usage
The VCompare.exe is a utility program to help you transform any files from your previous
version of EnergyPlus to the new object definitions for the current EnergyPlus version. It
needs an "old" IDD and a "new" IDD in order to run. It can be run interactively (just execute
Vcompare), with a file (i.e. VCompare <filename>) or it can accept a file name as the input to
the first question if you put an @ in front. @MyTests.in
It uses the standard Energy+.ini file to determine locations and where to leave the
objstats.csv file.
Here is an example file that it could use (do not use the "line<x>: " as part of the file):
line1: 'e:\eplus\V1-0-0energy+.idd'
line2: 'e:\eplus\energy+.idd'
line3: diff
line4: yes
line5: yes
line6: 2826-TermReheatOA-MisMatch2.idf
as many files as you would like to "change".
V1-0-0energy+.idd is a specially changed version of the energy+.idd for EnergyPlus 1.0.0
that will produce minimal "problems" in the resultant changed files. (There have been some
field name changes and some units changes, for example. Sometimes in the same field!)
line3: diff -- you can put "diff" or "full" here. Diff will give you a resultant file of only "different"
objects in your given input files. "Full" will put out a full new version (with field comment
lines). However, “full” does not preserve any “sections” that were in the previous idf file.
line4: yes -- you can put "yes" or "no" here. Yes will put units on appropriate lines in the new
files, no does not.
Line5: yes -- you can put "yes" or "no" here. Yes will leave blank fields with defaults blank; no
will allow the defaults to be filled in (whether alpha or numeric)
Line6, succeeding. For each file you list here (assuming it will pass the parse of the "old"
IDD), you will get two files: <filename>.err and <filename>.difnew The .err file should be
4/23/05
86
VCOMPARE
VCOMPARE USAGE
empty. The .difnew file is what you want. It contains the "changed" objects from the old IDD
to the new IDD. In the same order as the original file. It will include comments that are start
the line, before the objects where they might have been embedded in the original file. Also,
the field name comments for each field “attempt” to line up for better readability.
You also get a objstats.csv file as a result. This will contain the same information as in the
ObjectStatus.xls file for the V1.0.0 release. By the way, you could also use the same IDDs
for both OLD and NEW as well as "full" to get completely annotated input files.
Table 21. VCompare Output Files and Descriptions
VCompare Output File Name
Description
Eplusout.err
Will only occur if there are problems with the
two IDDs being compared. This file will show
up in the program directory (from the
Energy+.ini directions).
Objstats.csv
Differences between objects in the two IDDs.
(Same objects are not shown).
<filename>.difnew
Results for each <filename> entered. This
will be a full IDF file if “full” is entered or only
those objects that are different when “diff” is
entered.
<filename>.Vcperr
Errors, if any, on the <filename>.idf or
conversion.
Examples of changed "objects" in the .difnew file:
This object has the status of "diff # fields".
Note the names and units of each field.
! Diff # Fields
CHILLER:CONST COP,
Little Chiller,
!- Chiller Name
25000,
!- Nominal Capacity {W}
2.5,
!- COP
,
!- Design Evaporator Volumetric Water Flow Rate {m3/s}
0.0011,
!- Design Condenser Volumetric Water Flow Rate {m3/s}
Little Chiller Inlet Node,
!- Plant_Side_Inlet_Node
Little Chiller Outlet Node, !- Plant_Side_Outlet_Node
Little Chiller Condenser Inlet Node,
!- Condenser_Side_Inlet_Node
Little Chiller Condenser Outlet Node, !- Condenser_Side_Outlet_Node
AIR COOLED,
!- Condenser Type
VariableFlow;
!- Chiller Flow Mode
In the above, we have an added field (Design Evaporator Volumetric Water Flow Rate). It is
blank in the new .difnew version -- but probably needs a value before you just run it through
EnergyPlus!
Here's a couple more. To illustrate how "units change" show:
! Units Change
COIL:Water:SimpleHeating,
Bldg-A Reheat Coil Zone 3,
!Bldg-A FanAndCoilAvailSched, !400.0,
!!***! Units Change, next field=kg/s
1.8,
!4/23/05
Coil Name
Available Schedule
UA of the Coil {W/K}
-> m3/s {old value in old units shown}
Max Water Flow Rate of Coil {m3/s}
87
VCOMPARE
VCOMPARE USAGE
Bldg-A
Bldg-A
Bldg-A
Bldg-A
Zone
Zone
Zone
Zone
3
3
3
3
Reheat
Reheat
Reheat
Reheat
Water Inlet Node,
!- Coil_Water_Inlet_Node
Water Outlet Node, !- Coil_Water_Outlet_Node
Air Inlet Node,
!- Coil_Air_Inlet_Node
Air Outlet Node; !- Coil_Air_Outlet_Node
! #Fields+Field Name Chg+Units Change
CONTROLLER:SIMPLE,
Bldg-A Main Cooling Coil Controller, !- Name
TEMP,
!- Control variable
Reverse,
!- Action
FLOW,
!- Actuator variable
Bldg-A Air Loop Outlet Node, !- Control_Node
Bldg-A Cooling Coil Water Inlet Node, !- Actuator_Node
0.1,
!- Controller Convergence Tolerance: delta
temp from setpoint {C}
!***! Units Change, next field=kg/s -> m3/s {old value in old units shown}
1.1,
!- Max Actuated Flow {m3/s}
!***! Units Change, next field=kg/s -> m3/s {old value in old units shown}
0.0;
!- Min Actuated Flow {m3/s}
Note that the “Units” comment -- “!***! Units Change, next field=kg/s -> m3/s {old value in old units
shown}” shows the value (e.g. 1.1) as it originally appeared in your input file and these are in the old units
whereas the rest of the line may show the new units for the field (if you chose to have units listed in the
new fields.
Note that the IDF files converted will have the new (dif and err) files placed in the original
folder that the IDF came from. To use the new IDF (full command), just change the extension
on the difnew file to IDF (personally, I’d back up the old IDF first) and run EnergyPlus. If you
choose the “diff” option, you will have to cut and paste into the IDF. Note that any comments
from the original IDF are not carried over.
At this time, the VCompare program is not capable of accepting EP-Macro enabled files and
will probably choke on any “##” commands – of course, an excerpt IDF file will be readily
accepted and converted to a new excerpt IDF.
4/23/05
88
TRANSITION
VCOMPARE USAGE
Transition
While VCompare is very useful, it still leaves quite a bit of work for the user to transition from
one release version to the next. To help overcome this burden on the user, the
Transition_Vold_Vnew is created.
Note that Transition_Vold_Vnew is a generic way of naming the program. The actual program from
release to release will vary.
TransitionV1-2-1-to-V1-2-2.exe is the current transition program that will be distributed with
the V1.2.2 release. It uses several important files that are included in the main “EnergyPlus”
folder.
Table 22. Transition files for current release
File Name
V1-2-1-Energy+.idd
V1-2-2-Energy+.idd
Report Variables 1-2-1-022 to 1-2-2.csv
Description
Version 1.2.1 release Energy+.idd file
Identical to Energy+.idd when distributed
Report variable name changes
Another file “Rules1-2-1-to-1-2-2.xls” is not used directly by the program but contains the
“rules” for translating objects from version 1.2.1 release to the 1.2.2 release. The
ObjectStatus file can also be viewed – it will show if deleted objects are automatically
transitioned to the new input file versions.
Inputs to the Transition program are similar to the VCompare but do not include asking the
user for the IDD files – these are fixed for each Transition version. It uses the Energy+.ini file
in the same folder where it is executed from to determine the location of the IDD files.
The report variables conversion is not quite “perfect” but (hopefully) close. For example, in
one of our releases many new fuel types were added so that now one might have a Gas,
Electric, or Fuel Oil#1 Boiler. The old “Fuel Consumption” report variable, in this case, should
get transferred to the new Boiler <fuel> Consumption but the Transition program isn’t smart
enough to know what kind of fuel your boiler is using to it transforms to the “Boiler Gas
Consumption” variable. If, in fact, you have a different fuel for your boiler, you will receive a
warning message that Boiler Gas Consumption does not apply in the eplusout.err file. Just
revise these kinds of variable names to the proper fuel. Several other components will also
exhibit this kind of translation problem.
As you will see if you examine the “rules” spreadsheet, some things just can’t be converted.
In these instances, a warning message is issued (see output files below) and that same
warning will also appear on the screen. In most instances, there will be an equivalent IDF
comment before the “offending” object and the field inserted will be an indicator that
something is incorrect in the translation.
For the transition program, the IDD names are “hard-wired” – and the program uses the
location from the Energy+.ini file to determine where to find them. In other regards, it is very
similar to the Vcompare program described in the previous section.
Note that the IDF files converted will have the new (dif and err) files placed in the original
folder that the IDF came from. To use the new IDF (full command), just change the extension
on the difnew file to IDF (personally, I’d back up the old IDF first) and run EnergyPlus. If you
4/23/05
89
TRANSITION
VCOMPARE USAGE
choose the “diff” option, you will have to cut and paste into the IDF. Note that any comments
from the original IDF are not carried over.
At this time, the Transition program is not capable of accepting EP-Macro enabled files and
will probably choke on any “##” commands – of course, an excerpt IDF file will be readily
accepted and converted to a new excerpt IDF.
Table 23. Transition Output Files and Descriptions.
4/23/05
Transition Output File Name
Description
Eplusout.err
Will only occur if there are problems with the
two IDDs being compared. This file will show
up in the program directory (from the
Energy+.ini directions). Should not happen!
<filename>.difnew
Results for each <filename> entered. This
will be a full IDF file if “full” is entered or only
those objects that are different when “diff” is
entered.
<filename>.Vcperr
Errors, if any, on the <filename>.idf or
conversion.
90
HVAC SYSTEM TEMPLATES
TEMPLATE STRUCTURE AND USAGE
HVAC System Templates
HVAC system templates provide a shorthand way of describing selected standard HVAC
system configurations. Available templates include:
Zone Thermostat
Purchased Air
Four Pipe Fan Coil
VAV Single Duct with Reheat
Packaged Furnace with DX Air Conditioner
Purchased Hot Water and Chilled Water Supply Loop
Single Boiler Supply Loop
Single Chiller Supply Loop
Multiple equipment supply loop (boilers or chillers)
Multiple equipment condenser loop
Template Structure and Usage
Overall Template Structure
The templates utilize input macros (see the Input Output Reference, Appendix C) to provide a
short-hand way to describe a standard HVAC system configuration. Note that the
EnergyPlus input file will be an "imf" file rather than an "idf" file, because it will contain input
macro commands. (See Appendix C for more details about input macros.) For example, the
EnergyPlus objects required to describe the zone equipment for a zone with Purchased Air
are shown below:
CONTROLLED ZONE EQUIP CONFIGURATION,
RESISTIVE ZONE, ! zone name
RESISTIVE ZONE Equipment, ! zone equipment list
RESISTIVE ZONE Inlets, ! inlet node list
, ! exhaust node list
RESISTIVE ZONE ZoneNode, ! zone node
RESISTIVE ZONE Outlet Node; ! zone outlet node
ZONE EQUIPMENT LIST,
RESISTIVE ZONE Equipment, ! name
PURCHASED AIR, RESISTIVE ZONE PurchasedAir, 1, 1;
NODE LIST,
RESISTIVE ZONE Inlets, ! name
RESISTIVE ZONE PurchAirOutletNode; ! the zone inlet is the fancoil air
outlet
PURCHASED AIR,
RESISTIVE ZONE PurchasedAir , ! Name
RESISTIVE ZONE PurchAirOutletNode , ! Zone Supply Air Node Name
50 , ! Heating Supply Air Temp
13 , ! Cooling Supply Air Temp
0.015 , ! Heating Supply Air Humidity Ratio
0.010 ; ! Cooling Supply Air Humidity Ratio
4/23/05
91
HVAC SYSTEM TEMPLATES
TEMPLATE STRUCTURE AND USAGE
Using the template language, the following input produces the same set of objects:
##set1 ZoneName
##set1 AvailSched
##set1 HeatSuppAirTemp
##set1 CoolSuppAirTemp
##set1 HeatSuppAirHR
##set1 CoolSuppAirHR
PurchAirZone[]
=
=
=
=
=
=
"RESISTIVE ZONE"
"FanAndCoilAvailSched"
50
13
0.015
0.010
The example above illustrates the basic way in which the templates are used:
First, the required macro variables are assigned using the ##set1 command.
Then a macro is invoked with no formal parameters passed to it. Each macro expects a
certain set of macro variables to be defined and substitutes their values into the
appropriate places in the expanded objects.
The overall flow when using the HVAC templates is shown in Figure 13. EP-Launch and
RunEplus.bat will automatically execute EP-Macro when the input file extension is IMF. The
full set of EP-Macro commands are explained in a later section in this document (see: Input
Macros). However, the few commands required to use the HVAC templates are also
explained in this section.
Input File.imf
##include HVACTemplates.imf
Regular EnergyPlus objects
RUN PERIOD, 1, 1, 12, 31;
...
HVAC Template commands:
##set1 ZoneName = "RESISTIVE ZONE"
##set1 AvailSched = "FanAndCoilAvailSched"
##set1 HeatSuppAirTemp = 50
##set1 CoolSuppAirTemp = 13
##set1 HeatSuppAirHR = 0.015
##set1 CoolSuppAirHR = 0.010
PurchAirZone[]
...
EP-Launch or RunEplus.bat
EP-Macro.exe
EPMIDF File
Regular EnergyPlus objects
after macro processing
(“Clean IDF file”)
EnergyPlus.exe
EnergyPlus output files
EnergyPlus output files
EnergyPlus output files
Figure 13. HVAC Template Structure
The input file (imf extension) contains both regular EnergyPlus objects and HVAC template
commands. EP-Launch, or the RunEPlus.bat batch file executes EP-Macro.exe which
processes the HVAC template commands and produces a clean input file (epmidf extension)
4/23/05
92
HVAC SYSTEM TEMPLATES
TEMPLATE COMMANDS
containing only regular EnergyPlus objects. Then EnergyPlus.exe is run to produce the usual
output files.
Using the Templates as a Pre-Processing Tool
Most users will use the templates as a preliminary step to create a set of HVAC system
objects which will then be added to an existing idf file containing a building envelope
description. The following steps describe how to use the templates in this fashion:
1. Create a short imf input file containing only the HVAC description using the HVAC
template commands.
2. Run a simulation using the imf file. EP-macro will process the template commands
and EnergyPlus will try to run the file, but it will fail, because it is an incomplete file
with no building description.
3. Review the EP-macro output file (epmdet) for errors. Correct and repeat Step 2, if
needed.
4. The resulting epmidf file will contain a clean set of idf objects describing the HVAC
system. Using a text editor, these objects can then be pasted into the main idf file
containing the building description and the rest of the input for the project.
Advantages of this approach are that the full set of HVAC objects can be seen and further
edited directly using the IDF Editor or a text editor. Disadvantages are that any major
changes to the HVAC system (such as adding another zone) would require repeating these
steps to merge a new HVAC system into the main input file.
Using the Templates Directly in the Input File
Some users will user the templates in their main input file, which must then be an imf file.
Advantages are that changes can be made to the HVAC description without repeating the
steps above to merge a new set of HVAC objects with the building description.
Disadvantages are that the input is less clear and the IDF Editor cannot be used to edit the
input file.
Autosized vs. Fully Specified Template Commands
There are two sets of HVAC template commands:
•
HVACTemplates.imf contains "fully specified" template commands. The commands
require that the user set all equipment size, performance, and control specifications.
•
HVACTemplates-Autosize.imf contains simplified template commands which autosize
all equipment and use default performance and control specifications wherever
possible. The commands require the minimum possible user inputs to define an
HVAC system. All macro commands names in this file end with "-Autosize".
Since most users will likely use only one set in a given simulation, the commands have been
separated into two files in order to reduce the EP-macro processing time. The user must
"include" the applicable template command file (see below) in order to make the desired set
of commands available. It is possible to use both in the same input file if desired.
Template Commands
BasicCommands
The following macro language commands are required in order to use the HVAC Templates:
4/23/05
93
HVAC SYSTEM TEMPLATES
TEMPLATE COMMANDS
##fileprefix <path>
Sets the path to where the master template definition file is located
##includesilent HVACTemplates.imf or
##includesilent HVACTemplates-Autosize.imf
Includes the template definition file into the input stream without echoing it to the epmdet
file.
##set1 VariableName <Value>
Sets macro variable “VariableName” to “Value”
MacroName[]
Invokes a multi-line macro to insert a block of EnergyPlus objects into the input stream.
The commands listed above are the only required commands, but the entire set of EP-Macro
commands may be used both in managing the HVAC template inputs or elsewhere in the
input file.
Syntax Rules
The following rules must be adhered to in order for the HVAC template macros to process
correctly:
4/23/05
Macro variable names are case insensitive, so ##set1 ZoneName and ##set1 zonename
are equivalent.
System macro names are invoked after the required input variables have been set.
System macro names must be followed by [ ] in order to identify the name as a macro.
All strings must be enclosed in double quotes “String“.
Strings for inputs other than zone and system names may contain only letters, numbers
and dashes “-“. They may not contain spaces or other special characters.
Zone
names
and
system
names
are
limited
to
32
characters
(Note this is less than the EnergyPlus name limit of 60 characters, because internal
names are appended to the zone names and system names to create unique names for
equipment objects and system nodes.)
Schedule names are limited to 60 characters, the standard EnergyPlus limit.
EnergyPlus is initially limited to 50 components per splitter or mixer. Due to this limit, air
handling systems may serve up to 50 zones per primary air loop, and chilled/hot water
loops may serve a maximum of 50 coils each. If the system has zonal water coils (such
as reheat coils or fan coils) then a given water loop would be limited to serving up to 50
zones. If the air handlers have only central coils (one heating coil and one cooling coil
per air handler), then a given water loop could serve up to 50 air handlers which serve up
to 50 zones each, for a total limit of 2500 zones. These limits can be overridden by
editing the IDD file, and the HVAC templates master macro file would also need editing.
It is safest to reassign all required input variables prior to every macro call, even if they
are assigned the same value as in the previous call. Macro variable definitions are not
reset after a macro is called, so if a variable is not assigned a new value before a later
call to the same macro, the old value will be used without warning. If the same value will
be applied to several zones, for example, it is possible to set a variable once for the first
zone and not repeat it for the later zones.
94
HVAC SYSTEM TEMPLATES
DESCRIBING TYPICAL HVAC SYSTEMS USING THE HVAC TEMPLATES
Example Files
In the EnergyPlus\Templates folder, there are example imf files which illustrate the use of the
template macro commands. Some of these examples have equivalent idf files in the
EnergyPlus\Examples folder, such as PurchAir-TE.imf and PurchAir.idf.
HVAC IDF Segments
In the EnergyPlus\Templates\HVAC IDF Segments folder, there are idf file segments which
contain full idf objects for particular system portions. For example, BoilerSupply-01 contains
a boiler supply loop with a single boiler. BoilerSupply-02 contains a boiler supply loop with
two boilers, and so on up to BoilerSupply-10. The file segments have been set to autosize
wherever possible. Using these file segments provides a quick way to add the necessary
objects to an idf file, but will almost always require further editing of names, equipment types,
sizes, zone names, etc. To substitute different types of equipment into these idf segments,
be sure to keep the node names the same, and search for all occurrences of the equipment
type and name.
Describing Typical HVAC Systems Using the HVAC Templates
To describe typical HVAC system configurations, a combination of system macro commands
is used along with the required macro variable definitions prior to each command. The
commands required for several typical HVAC systems are listed below. Many of the system
template commands are available in two versions, one with autosizing and defaults and one
where the user specifies all required sizing and control information. These examples here
use the autosize versions.
Purchased Air System
ZoneThermostat[ ] (once for each zone)
PurchAirZone-Autosize[ ] (once for each zone)
Packaged Furnace with DX Cooling System
ZoneThermostat[ ] (once for each zone)
DirectAirZone-Autosize[ ] (once for each zone)
UnitaryAirLoop-Autosize[ ]
Four-Pipe Fan Coil System
ZoneThermostat[ ] (once for each zone)
4PipeFanCoilZone-Autosize[ ] (once for each zone)
FanCoilLoops-Autosize[ ]
Single-Duct VAV System with Outside Air Option
ZoneThermostat[ ] (once for each zone)
VAVZone-Autosize[ ] (once for each zone)
VAVAirLoop-Autosize[ ]
4/23/05
95
HVAC SYSTEM TEMPLATES
SYSTEM MACRO COMMANDS
ChilledWaterDemand-Autosize[ ]
HotWaterDemand-Autosize[ ]
Purchased Hot Water/Chilled Water Supply Plant
PurchasedSupplyWithBypass-Autosize[ ]
Single Chiller Supply Plant
ChillerSupply1-Autosize [ ]
Condenser1-Autosize[ ]
Single Boiler Supply Plant
BoilerSupply1-Autosize [ ]
System Macro Commands
Each available system macro command is described below including descriptions of the
parameters which must be set prior to invoking the macro, an example of the macro inputs,
and a list of the EnergyPlus objects which are generated by the macro. Many of the
parameters are equivalent to a specific field in a standard EnergyPlus object, so the
parameter description may reference a standard object name for more explanation.
ZoneThermostat-Autosize[ ] and ZoneThermostat
These two commands are identical.
Describes the thermostatic temperature controls for one zone.
ZoneName
The name of the zone to be controlled by this thermostat.
ZoneCtrlSched
The zone control type schedule name. See ZONE CONTROL:THERMOSTATIC for more
explanation.
SnglHeatSPSched
The single heating setpoint schedule name. Schedule values are in [C]. If this control type is
not used, then this should be set to "None". See SINGLE HEATING SETPOINT for more
explanation.
SnglCoolSPSched
The single cooling setpoint schedule name. Schedule values are in [C]. If this control type is
not used, then this should be set to "None". See SINGLE COOLING SETPOINT for more
explanation.
4/23/05
96
HVAC SYSTEM TEMPLATES
SYSTEM MACRO COMMANDS
SnglHtClSPSched
The single heating/cooling setpoint schedule name. Schedule values are in [C]. If this
control type is not used, then this should be set to "None". See SINGLE HEATING COOLING
SETPOINT for more explanation.
DualSPHeatSched
The dual setpoint heating setpoint schedule name. Schedule values are in [C]. If this control
type is not used, then this should be set to "None". See DUAL SETPOINT WITH DEADBAND
for more explanation.
DualSPCoolSched
The dual setpoint cooling setpoint schedule name. Schedule values are in [C]. If this control
type is not used, then this should be set to "None". See DUAL SETPOINT WITH DEADBAND
for more explanation.
! Zone
##set1
##set1
##set1
##set1
##set1
##set1
##set1
Thermostat Parameters (used by ZoneThermostat[])
ZoneName
= "RESISTIVE ZONE"
!
ZoneCtrlSched
= "Zone-Control-Type-Sched"
!
SnglHeatSPSched = "Heating-Setpoints"
!
SnglCoolSPSched = "Cooling-Setpoints"
!
SnglHtClSPSched = "None"
!
DualSPHeatSched = "None"
!
DualSPCoolSched = "None"
!
Zone name
Zone-Control-Type-Schedule
Single Heating Setpoint Schedule
Single Cooling Setpoint Schedule
Single Heating/Cooling Setpoint Schedule
Dual Setpoint Heating Setpoint Schedule
Dual Setpoint Cooling Setpoint Schedule
ZoneThermostat[]
Objects generated:
ZONE CONTROL:THERMOSTATIC
SINGLE HEATING SETPOINT
SINGLE COOLING SETPOINT
SINGLE HEATING COOLING SETPOINT
DUAL SETPOINT WITH DEADBAND
PurchAirZone-Autosize[ ] and PurchAirZone[ ]
Describes the zone equipment for one purchased air zone.
The following parameters are required for both commands:
ZoneName
The name of the zone to be served by this purchased air unit.
The following parameters are required only for the non-autosize command:
HeatSuppAirTemp
The heating supply air temperature in [C]. See PURCHASED AIR for more explanation.
CoolSuppAirTemp
The cooling supply air temperature in [C]. See PURCHASED AIR for more explanation.
4/23/05
97
HVAC SYSTEM TEMPLATES
SYSTEM MACRO COMMANDS
HeatSuppAirHR
The heating supply air humidity ratio in [kg-H20/kg-air]. See PURCHASED AIR for more
explanation.
CoolSuppAirHR
The cooling supply air humidity ratio in [kg-H20/kg-air]. See PURCHASED AIR for more
explanation.
! Purchased Air Parameters (used by PurchAirZone[])
##set1 ZoneName
= "RESISTIVE ZONE"
##set1 HeatSuppAirTemp = 50
##set1 CoolSuppAirTemp = 13
##set1 HeatSuppAirHR
= 0.015
##set1 CoolSuppAirHR
= 0.010
!
!
!
!
!
Zone name
Heating Supply
Cooling Supply
Heating Supply
Cooling Supply
Air
Air
Air
Air
Temp [C]
Temp [C]
Humidity Ratio [kg-H20/kg-air]
Humidity Ratio [kg-H20/kg-air]
PurchAirZone[]
Objects generated:
CONTROLLED ZONE EQUIP CONFIGURATION
ZONE EQUIPMENT LIST
NODE LIST
PURCHASED AIR
4PipeFanCoilZone-Autosize [ ] and 4PipeFanCoilZone[ ]
Describes the zone equipment and demand-side branches for one zone on a four pipe fan
coil system.
The following parameters are required for both commands:
ZoneName
The name of the zone to be served by this fan coil unit.
AvailSched
Availability schedule name for this fan coil unit.
HeatAvailSched
Availability schedule name for the heating coil in this fan coil unit.
CoolAvailSched
Availability schedule name for the cooling coil in this fan coil unit.
The following parameters are required only for the non-autosize command:
ZoneSuppAirFlow
Zone supply air flow rate [m3/s]. See FAN COIL UNIT:4 PIPE for more explanation.
ZoneOutAirFlow
Zone outside air flow rate [m3/s]. See FAN COIL UNIT:4 PIPE for more explanation.
4/23/05
98
HVAC SYSTEM TEMPLATES
SYSTEM MACRO COMMANDS
ZoneMaxChWFlow
Zone maximum chilled water flow rate [m3/s]. See FAN COIL UNIT:4 PIPE for more
explanation.
ZoneMinChWFlow
Zone minimum chilled water flow rate [m3/s]. See FAN COIL UNIT:4 PIPE for more
explanation.
ZoneChWTolerance
Zone tolerance on chilled water control [C]. See FAN COIL UNIT:4 PIPE for more
explanation.
ZoneMaxHWFlow
Zone max hot water flow rate [m3/s]. See FAN COIL UNIT:4 PIPE for more explanation.
ZoneMinHWFlow
Zone min hot water flow rate [m3/s]. See FAN COIL UNIT:4 PIPE for more explanation.
ZoneHWTolerance
Zone tolerance on hot water control [C]. See FAN COIL UNIT:4 PIPE for more explanation.
ZoneFanEffic
Zone fan total efficiency. See FAN:SIMPLE:ConstVolume for more explanation.
ZoneFanPressure
Zone fan pressure rise [Pa]. See FAN:SIMPLE:ConstVolume for more explanation.
ZoneFanMtrEffic
Zone fan motor efficiency. See FAN:SIMPLE:ConstVolume for more explanation.
ZoneFanMtrInAir
Zone fan motor in air stream fraction. See FAN:SIMPLE:ConstVolume for more explanation.
ZoneCoolCoilUA
Zone cooling coil UA [W/K]. See COIL:Water:SimpleCooling for more explanation.
ZoneCoolCoilLvRH
Zone cooling coil leaving air relative humidity. See COIL:Water:SimpleCooling for more
explanation.
ZoneHeatCoilUA
Zone heating coil UA [W/K]. See COIL:Water:SimpleHeating for more explanation.
4/23/05
99
HVAC SYSTEM TEMPLATES
##set1
##set1
##set1
##set1
##set1
##set1
##set1
##set1
##set1
##set1
##set1
##set1
##set1
##set1
##set1
##set1
##set1
ZoneName
AvailSched
ZoneSuppAirFlow
ZoneOutAirFlow
ZoneMaxChWFlow
ZoneMinChWFlow
ZoneChWTolerance
ZoneMaxHWFlow
ZoneMinHWFlow
ZoneHWTolerance
ZoneFanEffic
ZoneFanPressure
ZoneFanMtrEffic
ZoneFanMtrInAir
ZoneCoolCoilUA
ZoneCoolCoilLvRH
ZoneHeatCoilUA
=
=
=
=
=
=
=
=
=
=
=
=
=
=
=
=
=
SYSTEM MACRO COMMANDS
"RESISTIVE ZONE"
! Zone name
"FanAndCoilAvailSched"
! Availability schedule
0.84
! Zone supply air flow rate [m3/s]
0.05
! Zone outside air flow rate [m3/s]
0.0010
! Zone max chilled water flow rate [m3/s]
0.0
! Zone min chilled water flow rate [m3/s]
0.001
! Zone tolerance on chilled water control [C]
0.0005
! Zone max hot water flow rate [m3/s]
0.0
! Zone min hot water flow rate [m3/s]
0.001
! Zone tolerance on hot water control [C]
0.5
! Zone fan total efficiency
75.0
! Zone fan pressure rise [Pa]
0.9
! Zone fan motor efficiency
1.0
! Zone fan motor in air stream fraction
600.0
! Zone cooling coil UA [W/K]
0.9
! Zone cooling coil leaving air relative humidity
400.0
! Zone heating coil UA [W/K]
4PipeFanCoilZone[]
Objects generated:
OUTSIDE AIR INLET NODE LIST
CONTROLLED ZONE EQUIP CONFIGURATION
ZONE EQUIPMENT LIST
NODE LIST
FAN COIL UNIT:4 PIPE
OUTSIDE AIR MIXER
FAN:SIMPLE:ConstVolume
COIL:Water:SimpleCooling
COIL:Water:SimpleHeating
BRANCH
VAVZone-Autosize[ ] and VAVZone[ ]
Describes the zone equipment and demand-side branches for one zone on a single duct VAV
reheat system.
The following parameters are required for both commands:
ZoneName
Zone name
AvailSched
Availability schedule name for this VAV terminal unit.
ReheatCoilType
Reheat coil type for this VAV terminal unit: HOTWATER, ELECTRIC, GAS, or NONE. I
omitted, defaults to HOTWATER.
The following parameters are required only for the non-autosize command:
4/23/05
100
HVAC SYSTEM TEMPLATES
SYSTEM MACRO COMMANDS
ZoneSuppAirFlow
Zone supply air flow rate [m3/s] at full flow. See SINGLE DUCT:VAV:REHEAT for more
explanation.
ZoneMinAirFrac
Zone minimum supply air flow fraction. See SINGLE DUCT:VAV:REHEAT for more
explanation.
ZoneMaxHWFlow
Zone max reheat hot water flow rate [m3/s]. See SINGLE DUCT:VAV:REHEAT for more
explanation.
ZoneMinHWFlow
Zone min reheat hot water flow rate [m3/s]. See SINGLE DUCT:VAV:REHEAT for more
explanation.
ZoneHWTolerance
Zone tolerance on hot water control [C]. See SINGLE DUCT:VAV:REHEAT for more
explanation.
ZoneHeatCoilUA
Zone heating coil UA [W/K] . See COIL:WATER:SIMPLEHEATING for more explanation.
! VAV Zone - Autosized
##set1 ZoneName
##set1 AvailSched
##set1 ReheatCoilType
= "RESISTIVE ZONE"
= "FanAndCoilAvailSched"
= "HOTWATER"
! Zone name
! System Availability Schedule
! Reheat coil type (HOTWATER, ELECTRIC, GAS, NONE)
=
=
=
=
=
=
=
=
!
!
!
!
!
!
!
!
VAVZone[]
! VAV Zone
##set1 ZoneName
##set1 AvailSched
##set1 ZoneSuppAirFlow
##set1 ZoneMinAirFrac
##set1 ZoneMaxHWFlow
##set1 ZoneMinHWFlow
##set1 ZoneHWTolerance
##set1 ZoneHeatCoilUA
"RESISTIVE ZONE"
"FanAndCoilAvailSched"
0.47
0.3
0.0013
0.0
0.001
400.0
Zone name
System Availability Schedule
Zone supply air flow rate [m3/s]
Zone min supply air flow fraction
Zone max reheat hot water flow rate [m3/s]
Zone min reheat hot water flow rate [m3/s]
Zone tolerance on hot water control [C]
Zone heating coil UA [W/K]
VAVZone[]
Objects generated:
CONTROLLED ZONE EQUIP CONFIGURATION
ZONE EQUIPMENT LIST
AIR DISTRIBUTION UNIT
NODE LIST
SINGLE DUCT:VAV:REHEAT
COIL:Water:SimpleHeating
BRANCH
4/23/05
101
HVAC SYSTEM TEMPLATES
SYSTEM MACRO COMMANDS
DirectAirZone-Autosize[ ] and DirectAirZone[ ]
Describes the zone equipment for one direct-air zone on a packaged system.
The following parameters are required for both commands:
ZoneName
Zone name
AvailSched
Availability schedule name for this VAV terminal unit.
The following parameters are required only for the non-autosize command:
ZoneSuppAirFlow
Zone supply air flow rate [m3/s] at full flow. See DIRECT AIR for more explanation.
##set1 ZoneName
##set1 AvailSched
##set1 ZoneSuppAirFlow
= "RESISTIVE ZONE"
= "FanAndCoilAvailSched"
= 0.47
! Zone name
! System Availability Schedule
! Zone supply air flow rate [m3/s]
DirectAirZone[]
Objects generated:
CONTROLLED ZONE EQUIP CONFIGURATION
ZONE EQUIPMENT LIST
NODE LIST
DIRECT AIR
VAVAirLoop-Autosize[ ] and VAVAirLoop[ ]
Describes the air loop and demand-side branches for a single duct VAV reheat system with
outside air economizer option. Autosized version uses COIL:WATER:SIMPLECOOLING only
and offers options for plenum return and a main heating coil.
The following parameters are required for both commands:
AirSysName
Air handling system name. This name is used as a prefix for the air handling system object
names and node names.
NumberOfZones
Number of zones serve by this air loop. Up to 50 zones may be served by one loop.
Zone1Name, Zone2Name, . . . Zone50Name
Names of zone 1, zone 2, . . . zone 50.
4/23/05
102
HVAC SYSTEM TEMPLATES
SYSTEM MACRO COMMANDS
AvailSched
Availability schedule for this air loop. See AIR PRIMARY LOOP for more explanation.
CoolAvailSched
Cooling coil availability schedule.
See COIL:WATER:SIMPLECOOLING
COIL:WATER:DETAILEDFLATCOOLING for more explanation.
or
ColdSupplyTSch
Cooling supply air temperature setpoint control schedule [C]. Sets the setpoint at the air loop
exit after the supply fan. Cooling coil setpoint is set based on this to allow for supply fan
heat. See SET POINT MANAGER:SCHEDULED and SET POINT MANAGER:MIXED AIR
for more explanation.
MinOASched
Minimum Outside Air Schedule Name (" " if no schedule). See CONTROLLER:OUTSIDE AIR
for more explanation.
The following parameters are valid only for the autosize command:
ReturnPath
Return air path, PLENUM or DUCTED. Optional parameter, defaults to DUCTED if not set.
PLENUM uses a single plenum for return air from all zones served by this air loop.
PlenumZoneName
Zone name of plenum zone. Required if ReturnPath = PLENUM.
OASys
Outside air system flag: YES or NO. If YES, then an outside air mixing box and controller
will be included. Optional parameter, defaults to NO.
HeatingCoil
Main heating coil flag: YES or NO. If YES, then a central heating coil and controller will be
included. Optional parameter, defaults to NO.
HeatSupplyTSch
Heating coil leaving air temperature setpoint control schedule [C]. See SET POINT
MANAGER:SCHEDULED for more explanation. Required only if HeatingCoil = YES.
The following parameters are required only for the non-autosize command:
SysSuppAirFlow
System supply air flow rate [m3/s] at full flow.
explanation.
See AIR PRIMARY LOOP for more
Parameters for simple cooling coil
ChWCoilType
Cooling coil type: SIMPLE or DETAILED. SIMPLE uses COIL:WATER:SIMPLECOOLING;
DETAILED uses COIL:WATER:DETAILEDFLATCOOLING.
4/23/05
103
HVAC SYSTEM TEMPLATES
SYSTEM MACRO COMMANDS
ChWCoilMaxChWFlw
Maximum
chilled
water
flow
rate
through
the
coil
[m3/sec].
See
COIL:WATER:SIMPLECOOLING or COIL:WATER:DETAILEDFLATCOOLING for more
explanation.
ChWCoilUA
Chilled water coil UA [W/K]. See COIL:WATER:SIMPLECOOLING for more explanation.
ChWCoilLvRH
Chilled
water
coil
leaving
relative
humidity
COIL:WATER:SIMPLECOOLING for more explanation.
[fraction,
0
to
1].
See
End Parameters for simple cooling coil
Parameters for detailed cooling coil
ChWCoilType
Cooling coil type: SIMPLE or DETAILED. SIMPLE uses COIL:WATER:SIMPLECOOLING;
DETAILED uses COIL:WATER:DETAILEDFLATCOOLING.
ChWCoilMaxChWFlw
Maximum
chilled
water
flow
rate
through
the
coil
[m3/sec].
See
COIL:WATER:SIMPLECOOLING or COIL:WATER:DETAILEDFLATCOOLING for more
explanation.
ChWCoilTubeOSA
Tube outside surface area [m2].
explanation.
See COIL:WATER:DETAILEDFLATCOOLING for more
ChWCoilTubeISA
Tube inside surface area [m2].
explanation.
See COIL:WATER:DETAILEDFLATCOOLING for more
ChWCoilFinSA
Fin surface area [m2]. See COIL:WATER:DETAILEDFLATCOOLING for more explanation.
ChWCoilMinArea
Minimum air flow area [m2]. See COIL:WATER:DETAILEDFLATCOOLING for more
explanation.
ChWCoilDepth
Coil depth [m]. See COIL:WATER:DETAILEDFLATCOOLING for more explanation.
ChWCoilHeight
Coil height [m]. See COIL:WATER:DETAILEDFLATCOOLING for more explanation.
ChWCoilFinThick
Fin thickness [m]. See COIL:WATER:DETAILEDFLATCOOLING for more explanation.
4/23/05
104
HVAC SYSTEM TEMPLATES
SYSTEM MACRO COMMANDS
ChWCoilTubeID
Tube inside
explanation.
diameter
[m].
See
COIL:WATER:DETAILEDFLATCOOLING
for
more
ChWCoilTubOD
Tube outside diameter [m]. See COIL:WATER:DETAILEDFLATCOOLING for more
explanation.
ChWCoilTubeCond
Tube thermal conductivity [W/m-K]. See COIL:WATER:DETAILEDFLATCOOLING for more
explanation.
ChWCoilFinCond
Fin thermal conductivity [W/m-K]. See COIL:WATER:DETAILEDFLATCOOLING for more
explanation.
ChWCoilFinSpace
Fin spacing [m]. See COIL:WATER:DETAILEDFLATCOOLING for more explanation.
ChWCoilTubeDepth
Tube depth spacing
explanation.
[m]. See COIL:WATER:DETAILEDFLATCOOLING for more
ChWCoilNumRow
Number of tube rows. See COIL:WATER:DETAILEDFLATCOOLING for more explanation.
ChWCoilTubPerRow
Number of tubes per row. See COIL:WATER:DETAILEDFLATCOOLING for more
explanation.
End Parameters for detailed cooling coil
ChWCtrlOffset
Controller convergence tolerance [C]. See CONTROLLER:SIMPLE for more explanation.
ChWCtrlMaxFlow
Cooling Coil Control Max Actuated Flow [m3/s]. See CONTROLLER:SIMPLE for more
explanation.
ChWCtrlMinFlow
Cooling Coil Control Min Actuated Flow [m3/s]. See CONTROLLER:SIMPLE for more
explanation.
FanEffic
Fan Total Efficiency. See FAN:SIMPLE:VARIABLEVOLUME for more explanation.
4/23/05
105
HVAC SYSTEM TEMPLATES
SYSTEM MACRO COMMANDS
FanPressure
Delta Pressure [Pa]. See FAN:SIMPLE:VARIABLEVOLUME for more explanation.
FanMinVolFlow
Min Vol Flow Rate [m3/s]. See FAN:SIMPLE:VARIABLEVOLUME for more explanation.
FanMtrEffic
Motor efficiency. See FAN:SIMPLE:VARIABLEVOLUME for more explanation.
FanMtrInAir
Motor in air stream fraction. See FAN:SIMPLE:VARIABLEVOLUME for more explanation.
VAVFanCoeff1
VAVFanCoeff2. See FAN:SIMPLE:VARIABLEVOLUME for more explanation.
VAVFanCoeff3
VAVFanCoeff4
VAVFanCoeff5
These parameters are the coefficients of the fan power part load curve.. See
FAN:SIMPLE:VARIABLEVOLUME for more explanation.
MinOAFlow
Minimum OA Vol Flow Rate [m3/s]. See CONTROLLER:OUTSIDE AIR for more explanation.
MaxOAFlow
Maximum OA Vol Flow Rate [m3/s]. See CONTROLLER:OUTSIDE AIR for more explanation.
EconoChoice
ECONOMIZER or NO ECONOMIZER. See CONTROLLER:OUTSIDE AIR for more
explanation.
RATempLimit
RETURN AIR TEMP LIMIT or NO RETURN AIR TEMP LIMIT. See CONTROLLER:OUTSIDE
AIR for more explanation.
RAEnthLimit
RETURN AIR ENTHALPY LIMIT or NO RETURN AIR ENTHALPY LIMIT. See
CONTROLLER:OUTSIDE AIR for more explanation.
EconoDXLockout
NO LOCKOUT, LOCKOUT WITH HEATING, or LOCKOUT WITH COMPRESSOR. See
CONTROLLER:OUTSIDE AIR for more explanation.
4/23/05
106
HVAC SYSTEM TEMPLATES
SYSTEM MACRO COMMANDS
MinOALimit
FIXED MINIMUM or PROPORTIONAL MINIMUM. See CONTROLLER:OUTSIDE AIR for
more explanation.
EconoTempLimitHi
Econo upper temperature limit [C] (" " if no limit). See CONTROLLER:OUTSIDE AIR for more
explanation.
EconoTempLimitLo
Econo lower temperature limit [C] (" " if no limit). See CONTROLLER:OUTSIDE AIR for more
explanation.
EconoEnthLimit
Econo upper enthalpy limit [J/kg] (" " if no limit). See CONTROLLER:OUTSIDE AIR for more
explanation.
! VAV Air Loop -Autosized
##set1 AirSysName
= "VAV SYS 1"
! Air handling system name
##set1 NumberOfZones
= 5
! Number of zones
##set1 Zone1Name
= "SPACE1-1"
! Name of Zone 1
##set1 Zone2Name
= "SPACE2-1"
! Name of Zone 2
##set1 Zone3Name
= "SPACE3-1"
! Name of Zone 3
##set1 Zone4Name
= "SPACE4-1"
! Name of Zone 4
##set1 Zone5Name
= "SPACE5-1"
! Name of Zone 5
##set1 AvailSched
= "FanAvailSched"
! System Availability Schedule
##set1 HeatAvailSched
= "ReheatCoilAvailSched"
! Heating Coil Availability Schedule
##set1 CoolAvailSched
= "CoolingCoilAvailSched"
! Cooling Coil Availability Schedule
##set1 ReturnPath
= PLENUM
! PLENUM or DUCTED return
##set1 PlenumZoneName
= "PLENUM-1"
! Zone name of plenum zone
##set1 OASys
= "YES"
! Outside air system? (YES or NO, YES defaults to
0.00944 m3/s/person, 20cfm/person)
##set1 ColdSupplyTSch
= "Seasonal Reset Supply Air Temp Sch" ! Cooling Coil Control Setpoint Schedule
##set1 MinOASched
= "Min OA Sched"
! Minimum Outside Air Schedule Name (" " if no
schedule)
##set1 HeatingCoil
= "YES"
! Main heating coil?
VAVAirLoop-Autosize[]
! VAV Air Loop
##set1 AirSysName
##set1 NumberOfZones
##set1 Zone1Name
##set1 Zone2Name
##set1 Zone3Name
=
=
=
=
=
##set1 SysSuppAirFlow
##set1 AvailSched
= 1.3
= "FanAndCoilAvailSched"
4/23/05
"VAV SYS 1"
3
"RESISTIVE ZONE"
"EAST ZONE"
"NORTH ZONE"
!
!
!
!
!
Air handling system name
Number of zones
Name of Zone 1
Name of Zone 2
Name of Zone 3
! System supply air flow rate [m3/s]
! System Availability Schedule
107
HVAC SYSTEM TEMPLATES
! Cooling Coil Parameters
##set1 ChWCoilType
=
##set1 CoolAvailSched
=
##set1 ChWCoilMaxChWFlw =
##set1 ChWCoilTubeOSA
=
##set1 ChWCoilTubeISA
=
##set1 ChWCoilFinSA
=
##set1 ChWCoilMinArea
=
##set1 ChWCoilDepth
=
##set1 ChWCoilHeight
=
##set1 ChWCoilFinThick =
##set1 ChWCoilTubeID
=
##set1 ChWCoilTubOD
=
##set1 ChWCoilTubeCond =
##set1 ChWCoilFinCond
=
##set1 ChWCoilFinSpace =
##set1 ChWCoilTubeDepth =
##set1 ChWCoilNumRow
=
##set1 ChWCoilTubPerRow =
SYSTEM MACRO COMMANDS
for COIL:Water:DetailedFlatCooling
"DETAILED"
! Cooling coil type: SIMPLE or DETAILED
"CoolingCoilAvailSched"
! Cooling coil availability schedule
0.0011
! Max Water Flow Rate of Coil [m3/sec]
6.23816
! Tube Outside Surf Area [m2]
6.20007018,
! Tube Inside Surf Area [m2]
101.7158224,
! Fin Surf Area [m2]
0.300606367,
! Min Air Flow Area [m2]
0.165097968,
! Coil Depth [m]
0.43507152,
! Coil Height [m]
0.001499982,
! Fin Thickness [m]
0.014449958,
! Tube Inside Diameter [m]
0.015879775,
! Tube Outside Diameter [m]
0.385764854,
! Tube Thermal Conductivity [W/m-K]
0.203882537,
! Fin Thermal Conductivity [W/m-K]
0.001814292,
! Fin Spacing [m]
0.02589977,
! Tube Depth Spacing [m]
6,
! Number of Tube Rows
16,
! Number of Tubes per Row
! Cooling Coil Parameters for COIL:Water:SimpleCooling
!##set1 ChWCoilType
= "SIMPLE"
! Cooling coil type: SIMPLE or DETAILED
!##set1 CoolAvailSched
= "CoolingCoilAvailSched"
! Cooling coil availability schedule
!##set1 ChWCoilUA
= autosize
! ChW Coil UA [W/K]
!##set1 ChWCoilMaxChWFlw = autosize
! ChW Coil Max Water Flow Rate [m3/sec]
!##set1 ChWCoilLvRH
= 0.9
! ChW Coil Leaving Relative Humidity [fraction, 0 to 1]
! Cooling Coil Controller
##set1 ChWCtrlOffset
=
##set1 ChWCtrlMaxFlow
=
##set1 ChWCtrlMinFlow
=
##set1 ColdSupplyTSch
=
Parameters for Controller:Simple
0.001
! Controller Convergence Tolerance [C]
0.0011
! Cooling Coil Control Max Actuated Flow [m3/s]
0.0
! Cooling Coil Control Min Actuated Flow [m3/s]
"Seasonal-Reset-Supply-Air-Temp-Sch" ! Cooling Coil Control Setpoint Schedule
! VAV Fan Parameters for FAN:SIMPLE:VariableVolume
##set1 FanEffic
= 0.7
! Fan Total Efficiency
##set1 FanPressure
= 600.0
! Delta Pressure [Pa]
##set1 FanMinVolFlow
= 0.20
! Min Vol Flow Rate [m3/s]
##set1 FanMtrEffic
= 0.9
! Motor efficiency
##set1 FanMtrInAir
= 1.0
! Motor in air stream fraction
##set1 VAVFanCoeff1
= 0.35071223
! Fan Coeff 1
##set1 VAVFanCoeff2
= 0.30850535,
! Fan Coeff 2
##set1 VAVFanCoeff3
=-0.54137364,
! Fan Coeff 3
##set1 VAVFanCoeff4
= 0.87198823,
! Fan Coeff 4
##set1 VAVFanCoeff5
= 0.000,
! Fan Coeff 5
! Outside Air Parameters
##set1 MinOAFlow
=
##set1 MaxOAFlow
=
##set1 EconoChoice
=
##set1 RATempLimit
=
LIMIT
##set1 RAEnthLimit
=
ENTHALPY LIMIT
##set1 EconoDXLockout
=
##set1 MinOALimit
=
##set1 EconoTempLimitHi =
##set1 EconoTempLimitLo =
##set1 EconoEnthLimit
=
##set1 MinOASched
=
0.4333
1.3
"ECONOMIZER"
"NO RETURN AIR TEMP LIMIT"
!
!
!
!
Minimum OA
Maximum OA
ECONOMIZER
RETURN AIR
Vol Flow Rate [m3/s]
Vol Flow Rate [m3/s]
or NO ECONOMIZER
TEMP LIMIT or NO RETURN AIR TEMP
"NO RETURN AIR ENTHALPY LIMIT" ! RETURN AIR ENTHALPY LIMIT or NO RETURN AIR
"NO LOCKOUT"
! NO LOCKOUT, LOCKOUT WITH HEATING, or LOCKOUT WITH COMPRESSOR
"PROPORTIONAL MINIMUM"
! FIXED MINIMUM or PROPORTIONAL MINIMUM
19.0
! Econo upper temperature limit [C] (" " if no limit)
4.0
! Econo lower temperature limit [C] (" " if no limit)
" "
! Econo upper enthalpy limit [J/kg] (" " if no limit)
" "
! Minimum Outside Air Schedule Name (" " if no schedule)
VAVAirLoop[]
Objects generated:
AIR PRIMARY LOOP
CONTROLLER LIST
BRANCH LIST
4/23/05
108
HVAC SYSTEM TEMPLATES
SYSTEM MACRO COMMANDS
BRANCH
ZONE SUPPLY AIR PATH
ZONE RETURN AIR PATH
ZONE SPLITTER
ZONE MIXER
CONTROLLER:SIMPLE
SYSTEM AVAILABILITY MANAGER LIST
SYSTEM AVAILABILITY MANAGER:SCHEDULED
SET POINT MANAGER:SCHEDULED
NODE LIST
COIL:WATER:DETAILEDFLATCOOLING
FAN:SIMPLE:VARIABLEVOLUME
OUTSIDE AIR INLET NODE LIST
OUTSIDE AIR SYSTEM
AIR LOOP EQUIPMENT LIST
OUTSIDE AIR MIXER
CONTROLLER:OUTSIDE AIR
UnitaryAirLoop-Autosize[ ] and UnitaryAirLoop[ ]
Describes the air loop for a unitary packaged system with a furnace with optional DX cooling
and optional outside air system.
The following parameters are required for both commands:
AirSysName
Air handling system name. This name is used as a prefix for the air handling system object
names and node names.
NumberOfZones
Number of zones serve by this air loop. Up to 50 zones may be served by one loop.
Zone1Name, Zone2Name, . . . Zone50Name
Names of zone 1, zone 2, . . . zone 50.
AvailSched
Availability schedule for this air loop. See AIR PRIMARY LOOP for more explanation.
SystemType
Type of unitary system:
FURNACE-HEATONLY, FURNACE-HEATCOOL, UNITARYHEATONLY, or UNITARY-HEATCOOL.
See FURNACE:BLOWTHRU:HEATONLY,
FURNACE:BLOWTHRU:HEATCOOL,
UNITARYSYSTEM:BLOWTHRU:HEATONLY,
or
UNITARYSYSTEM:BLOWTHRU:HEATCOOL, respectively, for more explanation.
4/23/05
109
HVAC SYSTEM TEMPLATES
SYSTEM MACRO COMMANDS
FanMode
Supply fan mode, CONTINUOUS or CYCLING. Used to set both the furnace or unitary
system Operating Mode field and the DX coil Supply Air Fan Operation Mode field. See the
selected furnace or unitary system type, and COIL:DX:CoolingBypassFactorEmpirical for
more explanation.
ControlZoneName
The zone name of the controlling zone or thermostat location for the furnace or unitary
system. See the selected furnace or unitary system type for more explanation.
HeatingCoilType
The type of heating coil: GAS or ELECTRIC.
COIL:ELECTRIC:HEATING type, respectively.
Selects the COIL:GAS:HEATING or
OASys
Outside air system flag: YES or NO. If YES, then an outside air mixing box and controller
will be included.
The following parameters are required only for the non-autosize command:
SysSuppAirFlow
System supply air flow rate [m3/s] at rated flow. See the selected furnace or unitary system
type for more explanation.
ControlZoneFrac
Fraction of the total or design volume flow that goes through the controlling zone. See the
selected furnace or unitary system type for more explanation.
HeatingCapacity
Furnace heating capacity [W]. See the selected furnace or unitary system type for more
explanation.
MaxSupplyTemp
See the selected furnace or unitary system type for more explanation.
GasBurnerEffic
Gas burner efficiency (decimal, not percent). See COIL:Gas:Heating for more explanation.
GasBurnerElec
Parasitic electric load associated with the gas coil operation [W]. See COIL:Gas:Heating for
more explanation.
GasBurnerPilot
Parasitic gas load associated with the gas coil’s operation [W], such as a standing pilot light.
See COIL:Gas:Heating for more explanation.
PLF-FPLR-Curve
Part Load Fraction Correlation (function of part load ratio). Enter a curve object name or
"DEFAULT" to use a default curve. See COIL:Gas:Heating for more explanation.
4/23/05
110
HVAC SYSTEM TEMPLATES
SYSTEM MACRO COMMANDS
The following parameters are required only if cooling is selected:
CoolingCapacity
Rated Total Cooling Capacity (gross) [W]. See COIL:DX:CoolingBypassFactorEmpirical for
more explanation.
RatedSHR
Rated sensible heat ratio.
explanation.
See COIL:DX:CoolingBypassFactorEmpirical for more
RatedCOP
Rated COP. See COIL:DX:CoolingBypassFactorEmpirical for more explanation.
DX-Cap-FT-Curve
Total cooling capacity modifier curve (function of temperature). Enter a curve object name or
"DEFAULT" to use a default curve. See COIL:DX:CoolingBypassFactorEmpirical for more
explanation.
DX-Cap-FF-Curve
Total cooling capacity modifier curve (function of flow fraction). Enter a curve object name or
"DEFAULT" to use a default curve. See COIL:DX:CoolingBypassFactorEmpirical for more
explanation.
DX-EIR-FT-Curve
Energy input ratio modifier curve (function of temperature). Enter a curve object name or
"DEFAULT" to use a default curve. See COIL:DX:CoolingBypassFactorEmpirical for more
explanation.
DX-EIR-FF-Curve
Energy input ratio modifier curve (function of flow fraction). Enter a curve object name or
"DEFAULT" to use a default curve. See COIL:DX:CoolingBypassFactorEmpirical for more
explanation.
DX-PLF-Curve
Part load fraction correlation (function of part load ratio). Enter a curve object name or
"DEFAULT" to use a default curve. See COIL:DX:CoolingBypassFactorEmpirical for more
explanation.
End cooling coil parameters.
The following parameters are required only if and outside air system is selected:
MinOAFlow
Minimum OA Vol Flow Rate [m3/s]. See CONTROLLER:OUTSIDE AIR for more explanation.
MaxOAFlow
Maximum OA Vol Flow Rate [m3/s]. See CONTROLLER:OUTSIDE AIR for more explanation.
4/23/05
111
HVAC SYSTEM TEMPLATES
SYSTEM MACRO COMMANDS
EconoChoice
ECONOMIZER or NO ECONOMIZER. See CONTROLLER:OUTSIDE AIR for more
explanation.
RATempLimit
RETURN AIR TEMP LIMIT or NO RETURN AIR TEMP LIMIT. See CONTROLLER:OUTSIDE
AIR for more explanation.
RAEnthLimit
RETURN AIR ENTHALPY LIMIT or NO RETURN AIR ENTHALPY LIMIT. See
CONTROLLER:OUTSIDE AIR for more explanation.
EconoDXLockout
NO LOCKOUT, LOCKOUT WITH HEATING, or LOCKOUT WITH COMPRESSOR See
CONTROLLER:OUTSIDE AIR for more explanation.
MinOALimit
FIXED MINIMUM or PROPORTIONAL MINIMUM. See CONTROLLER:OUTSIDE AIR for
more explanation.
EconoTempLimitHi
Econo upper temperature limit [C] (" " if no limit). See CONTROLLER:OUTSIDE AIR for more
explanation.
EconoTempLimitLo
Econo lower temperature limit [C] (" " if no limit). See CONTROLLER:OUTSIDE AIR for more
explanation.
EconoEnthLimit
Econo upper enthalpy limit [J/kg] (" " if no limit). See CONTROLLER:OUTSIDE AIR for more
explanation.
MinOASched
Minimum Outside Air Schedule Name (" " if no schedule). See CONTROLLER:OUTSIDE AIR
for more explanation.
End outside air system parameters.
4/23/05
112
HVAC SYSTEM TEMPLATES
! DX Air Loop - Autosized
##set1 AirSysName
=
##set1 AvailSched
=
##set1 NumberOfZones
=
##set1 Zone1Name
=
SYSTEM MACRO COMMANDS
"AHU 1"
"FanAndCoilAvailSched"
1
"ZONE ONE"
! Furnace Parameters
##set1 SystemType
= "FURNACE-HEATCOOL"
UNITARY-HEATONLY, or UNITARY-HEATCOOL)
##set1 FanMode
= Cycling
##set1 ControlZoneName = "ZONE ONE"
##set1 HeatingCoilType = "GAS"
##set1 OASys
= "NO"
0.00944 m3/s/person, 20cfm/person)
!
!
!
!
Air handling system name
System Availability Schedule
Number of zones
Name of Zone 1
! System type (FURNACE-HEATONLY, FURNACE-HEATCOOL,
!
!
!
!
Fan Operating Mode:
Controlling zone or
Heating coil type Outside air system?
Cycling or Continuous
thermostat location
Gas or Electric
(YES or NO, YES defaults to
UnitaryAirLoop-Autosize[]
! DX Air Loop
! (See comments in DXAirLoop macro definition for variable definitions)
##set1 AirSysName
= "Furnace SYS 1"
! Air handling system name
##set1 NumberOfZones
= 3
! Number of zones
##set1 Zone1Name
= "RESISTIVE ZONE"
! Name of Zone 1
##set1 Zone2Name
= "EAST ZONE"
! Name of Zone 2
##set1 Zone3Name
= "NORTH ZONE"
! Name of Zone 3
##set1 SysSuppAirFlow
##set1 AvailSched
= 1.3
= "FanAndCoilAvailSched"
! Furnace Parameters for FURNACE:BLOWTHRU:HEATCOOL
##set1 SystemType
= "FURNACE-HEATCOOL"
UNITARY-HEATONLY, or UNITARY-HEATCOOL)
##set1 FanMode
= Cycling
##set1 HeatingCapacity = 25000
##set1 MaxSupplyTemp
= 80
{C}
##set1 ControlZoneName = "EAST ZONE"
##set1 ControlZoneFrac = 0.276923
goes through the controlling zone
##set1 HeatingCoilType = "GAS"
##set1 GasBurnerEffic
= 0.8
##set1 GasBurnerElec
= 0.0
##set1 PLF-FPLR-Curve
= "None"
(function of part load ratio)
##set1 CoolingCapacity = 25000
##set1 RatedSHR
= 0.75
##set1 RatedCOP
= 3.0
##set1 DX-Cap-FT-Curve = "Default"
temperature)
##set1 DX-Cap-FF-Curve = "Default"
flow fraction)
##set1 DX-EIR-FT-Curve = "Default"
temperature)
##set1 DX-EIR-FF-Curve = "Default"
flow fraction)
##set1 DX-PLF-Curve
= "Default"
load ratio)
! Fan Parameters for FAN:SIMPLE:ONOFF
##set1 FanEffic
= 0.7
##set1 FanPressure
= 600.0
##set1 FanMinVolFlow
= 0.20
##set1 FanMtrEffic
= 0.9
##set1 FanMtrInAir
= 1.0
4/23/05
!
!
!
!
!
! System supply air flow rate [m3/s]
! System Availability Schedule
! System type (FURNACE-HEATONLY, FURNACE-HEATCOOL,
! Fan Operating Mode: Cycling or Continuous
! Furnace heating capacity [W]
! Maximum supply air temperature from furnace heater
! Controlling zone or thermostat location
! Fraction of the total or design volume flow that
!
!
!
!
Heating coil type - Gas or Electric
Gas Burner Efficiency of the Coil [fraction]
Gas Burner Parasitic Electric Load [W]
Gas Burner Part load fraction correlation
!
!
!
!
DX Coil cooling capacity [W]
rated SHR
rated COP
total cooling capacity modifier curve (function of
! total cooling capacity modifier curve (function of
! energy input ratio modifier curve (function of
! energy input ratio modifier curve (function of
! part load fraction correlation (function of part
Fan Total Efficiency
Delta Pressure [Pa]
Min Vol Flow Rate [m3/s]
Motor efficiency
Motor in air stream fraction
113
HVAC SYSTEM TEMPLATES
SYSTEM MACRO COMMANDS
! Outside Air Parameters
##set1 MaxOAFlow
= 0.0
! Maximum OA Vol Flow Rate [m3/s]
! If no outside air, the following parameters may be omitted:
! ##set1 MinOAFlow
= 0.4333
! Minimum OA Vol Flow Rate [m3/s]
! ##set1 EconoChoice
= "ECONOMIZER"
! ECONOMIZER or NO ECONOMIZER
! ##set1 RATempLimit
= "NO RETURN AIR TEMP LIMIT"
! RETURN AIR TEMP LIMIT or NO RETURN AIR TEMP
LIMIT
! ##set1 RAEnthLimit
= "NO RETURN AIR ENTHALPY LIMIT" ! RETURN AIR ENTHALPY LIMIT or NO RETURN AIR
ENTHALPY LIMIT
! ##set1 EconoDXLockout
= "NO LOCKOUT"
! NO LOCKOUT, LOCKOUT WITH HEATING, or LOCKOUT WITH COMPRESSOR
! ##set1 MinOALimit
= "PROPORTIONAL MINIMUM"
! FIXED MINIMUM or PROPORTIONAL MINIMUM
! ##set1 EconoTempLimitHi = 19.0
! Econo upper temperature limit [C] (" " if no
limit)
! ##set1 EconoTempLimitLo = 4.0
! Econo lower temperature limit [C] (" " if no
limit)
! ##set1 EconoEnthLimit
= " "
! Econo upper enthalpy limit [J/kg] (" " if no
limit)
! ##set1 MinOASched
= " "
! Minimum Outside Air Schedule Name (" " if no
schedule)
UnitaryAirLoop[]
Objects generated:
AIR PRIMARY LOOP
BRANCH LIST
BRANCH
ZONE SUPPLY AIR PATH
ZONE RETURN AIR PATH
ZONE SPLITTER
ZONE MIXER
SYSTEM AVAILABILITY MANAGER LIST
SYSTEM AVAILABILITY MANAGER:SCHEDULED
SET POINT MANAGER:SCHEDULED
Option – select one
FURNACE:BLOWTHRU:HEATONLY
FURNACE:BLOWTHRU:HEATCOOL
UNITARYSYSTEM:BLOWTHRU:HEATONLY
UNITARYSYSTEM:BLOWTHRU:HEATCOOL
Option – select one
COIL:ELECTRIC:HEATING
COIL:GAS:HEATING
CURVE:BIQUADRATIC – if default selected
CURVE:QUADRATIC – if default selected
COIL:DX:BF-EMPIRICAL – if cooling selected
FAN:SIMPLE:ONOFF
Option – if outside air system selected
OUTSIDE AIR INLET NODE LIST
4/23/05
114
HVAC SYSTEM TEMPLATES
SYSTEM MACRO COMMANDS
OUTSIDE AIR SYSTEM
CONTROLLER LIST
AIR LOOP EQUIPMENT LIST
OUTSIDE AIR MIXER
CONTROLLER:OUTSIDE AIR
SET POINT MANAGER:SINGLE ZONE REHEAT
SET POINT MANAGER:MIXED AIR
FanCoilLoops-Autosize[ ] and FanCoilLoops[ ]
Describes the demand-side chilled water and hot water loops for a four pipe fan coil system..
The following parameters are required for both commands (the two commands are identical):
DemandSysName
Demand side system name. This name is used to link supply-side loops to these demandside loops. This name is used as a prefix for the demand-side object names and node
names.
NumberOfZones
Number of zones served by these demand-side loops. Up to 50 zones may be served by one
loop.
Zone1Name, Zone2Name, . . . Zone50Name
Names of zone 1, zone 2, . . . zone 50.
FanCoilLoops[]! Fan Coil Loops
! (See comments in FanCoilLoops macro definition for variable definitions)
##set1 DemandSysName
= "FAN COILS"
! Demand side system name
##set1 NumberOfZones
= 3
! Number of zones
##set1 Zone1Name
= "RESISTIVE ZONE"
! Name of zone 1
##set1 Zone2Name
= "EAST ZONE"
! Name of zone 2
##set1 Zone3Name
= "NORTH ZONE"
! Name of zone 3
FanCoilLoops[]
Objects generated:
BRANCH LIST
CONNECTOR LIST
SPLITTER
MIXER
PIPE
ChilledWaterDemand-Autosize[ ] and ChilledWaterDemand[ ]
Describes a demand-side chilled water loop serving cooling coils serving zones or air loops.
The following parameters are required for both commands (the two commands are identical):
4/23/05
115
HVAC SYSTEM TEMPLATES
SYSTEM MACRO COMMANDS
ChWDemandSysName
Demand side system name. This name is used to link supply-side loops to these demandside loops. This name is used as a prefix for the demand-side object names and node
names.
NumberOfChWCoils
Number of chilled water coils served by these demand-side loops. Up to 50 coils may be
served by one loop.
ChWCoil1Name, ChWCoil2Name, . . . ChWCoil50Name
Names of chilled water coil 1, coil 2, . . . coil 50.
! Chilled Water Demand Side
##set1 ChWDemandSysName = "Chilled Water Loop 1"
##set1 NumberOfChWCoils = 1
##set1 ChWCoil1Name
= "VAV SYS 1"
! Chiller water demand side system name
! Number of chilled water coils on loop
! Name of Zone or Air Loop for ChW Coil 1
ChilledWaterDemand[]
Objects generated:
BRANCH LIST
CONNECTOR LIST
SPLITTER
MIXER
PIPE
HotWaterDemand-Autosize[ ] and HotWaterDemand[ ]
Describes a demand-side hot water loop serving heating coils serving zones or air loops.
The following parameters are required for both commands (the two commands are identical):
HWDemandSysName
Demand side system name. This name is used to link supply-side loops to these demandside loops. This name is used as a prefix for the demand-side object names and node
names.
NumberOfHWCoils
Number of hot water coils served by these demand-side loops. Up to 50 coils may be served
by one loop.
HWCoil1Name, HWCoil2Name, . . . HWCoil50Name
Names of hot water coil 1, coil 2, . . . coil 50.
4/23/05
116
HVAC SYSTEM TEMPLATES
! Hot Water Demand Side
##set1 HWDemandSysName
##set1 NumberOfHWCoils
##set1 HWCoil1Name
##set1 HWCoil2Name
##set1 HWCoil3Name
=
=
=
=
=
SYSTEM MACRO COMMANDS
"Hot Water Loop 1"
3
"RESISTIVE ZONE"
"EAST ZONE"
"NORTH ZONE"
!
!
!
!
!
Hot water demand side system
Number of hot water coils on
Name of Zone or Air Loop for
Name of Zone or Air Loop for
Name of Zone or Air Loop for
name
loop
HW Coil 1
HW Coil 2
HW Coil 3
HotWaterDemand[]
Objects generated:
BRANCH LIST
CONNECTOR LIST
SPLITTER
MIXER
PIPE
PurchasedSupplyWithBypass-Autosize[ ] (Not implemented yet) and
PurchasedSupplyWithBypass[ ]
Describes the supply side equipment and branches for a purchased hot water and chilled
water plant with bypass branches.
The following parameters are required for both commands:
SupplyPlantName
Name of this supply side loop. This name is used as a prefix for the supply-side object
names and node names.
ChWDemandSysName
Name of the chilled water demand-side loop served by this supply-side loop.
HWDemandSysName
Name of the hot water demand-side loop served by this supply-side loop.
PurchChWSched
Purchased ChW availability schedule.
explanation.
See PLANT OPERATION SCHEMES for more
PurchHWSched
Purchased HW availability schedule.
explanation.
See PLANT OPERATION SCHEMES for more
The following parameters are required only for the non-autosize command:
PurchChWCap
Purchased ChW capacity [W]. See PURCHASED:CHILLED WATER for more explanation.
PurchHWCap
Purchased HW capacity [W] . See PURCHASED:HOT WATER for more explanation.
4/23/05
117
HVAC SYSTEM TEMPLATES
SYSTEM MACRO COMMANDS
All parameters in the Chilled Water Loop Parameter Group (see below)
All parameters in the Hot Water Loop Parameter Group (see below)
All parameters in the Chilled Water Pump Parameter Group (see below)
All parameters in the Hot Water Pump Parameter Group (see below)
! Purchased Heating and Cooling Supply
! (See comments in PurchasedSupply macro definition for variable definitions)
##set1 ChWDemandSysName = "FAN COILS" ! ChW demand-side loop served by this supply-side loop
##set1 HWDemandSysName = "FAN COILS" ! HW demand-side loop served by this supply-side loop
##set1 SupplyPlantName = "PURCHASED PLANT" ! Name of this supply side loop
##set1
##set1
##set1
##set1
##set1
##set1
##set1
ChWLoopMaxFlow
ChWLoopMinFlow
ChWLoopTempSch
ChWLoopSetPoint
ChWLoopMaxTemp
ChWLoopMinTemp
ChWLoopVolume
=
=
=
=
=
=
=
0.004
0
"None"
6.67
50
1
autosize
!
!
!
!
!
!
!
Max ChW flow (total to all zones) [m3/s]
Min ChW flow (total to all zones) [m3/s]
Chilled water setpoint schedule [C]
Chilled water setpoint [C] if schedule=None
Max ChW temperature [C]
Min ChW temperature [C]
ChW loop volume [m3]
##set1
##set1
##set1
##set1
##set1
##set1
##set1
HWLoopMaxFlow
HWLoopMinFlow
HWLoopTempSch
HWLoopSetPoint
HWLoopMaxTemp
HWLoopMinTemp
HWLoopVolume
=
=
=
=
=
=
=
0.002
0
"None"
60
100
10
autosize
!
!
!
!
!
!
!
Max HW flow (total to all zones) [m3/s]
Min HW flow (total to all zones) [m3/s]
Hot water setpoint schedule [C]
Hot water setpoint [C] if schedule=None
Max HW temperature [C]
Min HW temperature [C]
HW loop volume [m3]
##set1
##set1
##set1
##set1
PurchChWCap
PurchChWSched
PurchHWCap
PurchHWSched
=
=
=
=
1000000
"ON"
1000000
"ON"
!
!
!
!
Purchased
Purchased
Purchased
Purchased
##set1
##set1
##set1
##set1
##set1
##set1
##set1
##set1
##set1
##set1
ChWPmpType
ChWPmpHead
ChWPmpPower
ChWPmpMtrEff
ChWPmpMtrToFluid
ChWPmpPtLdCoeff1
ChWPmpPtLdCoeff2
ChWPmpPtLdCoeff3
ChWPmpPtLdCoeff4
ChWPmpCtrl
=
=
=
=
=
=
=
=
=
=
"Variable"
300000
1800
0.87
0.0
1.0
0.0
0.0
0.0
"INTERMITTENT"
!
!
!
!
!
!
!
!
!
!
ChW
ChW
ChW
ChW
ChW
ChW
ChW
ChW
ChW
ChW
##set1
##set1
##set1
##set1
##set1
##set1
##set1
##set1
##set1
##set1
HWPmpType
HWPmpHead
HWPmpPower
HWPmpMtrEff
HWPmpMtrToFluid
HWPmpPtLdCoeff1
HWPmpPtLdCoeff2
HWPmpPtLdCoeff3
HWPmpPtLdCoeff4
HWPmpCtrl
=
=
=
=
=
=
=
=
=
=
"Variable"
300000
900
0.87
0.0
1.0
0.0
0.0
0.0
"INTERMITTENT"
!
!
!
!
!
!
!
!
!
!
HW
HW
HW
HW
HW
HW
HW
HW
HW
HW
Pump
Pump
Pump
Pump
Pump
Pump
Pump
Pump
Pump
pump
Pump
Pump
Pump
Pump
Pump
Pump
Pump
Pump
Pump
pump
ChW capacity [W]
ChW availability schedule
HW capacity [W]
HW availability schedule
Type [Variable or Constant]
Rated Pump Head [Pa]
Rated Power Consumption [W]
Motor Efficiency
Frac Motor Inefficiencies to Fluid
Coefficient1 Part Load Perf. Curve
Coefficient2 Part Load Perf. Curve
Coefficient3 Part Load Perf. Curve
Coefficient4 Part Load Perf. Curve
control type: INTERMITTENT or CONTINUOUS
PurchasedSupplyWithBypass[]
Objects generated:
PLANT LOOP
BRANCH LIST
4/23/05
118
HVAC SYSTEM TEMPLATES
SYSTEM MACRO COMMANDS
CONNECTOR LIST
SPLITTER
MIXER
BRANCH
PIPE
Option – select one
PUMP:VARIABLE SPEED
PUMP:CONSTANT SPEED
PLANT OPERATION SCHEMES
COOLING LOAD RANGE BASED OPERATION
HEATING LOAD RANGE BASED OPERATION
LOAD RANGE EQUIPMENT LIST
PURCHASED:CHILLED WATER
PURCHASED:HOT WATER
BoilerSupply1-Autosize[ ] (Not implemented yet) and BoilerSupply1[ ]
BoilerSupply1WithBypass-Autosize[ ] and BoilerSupply1WithBypass[ ]
Describes the supply side loop, equipment, and branches for a single boiler plant or
purchased hot water plant with or without bypass.
The following parameters are required for both autosize and non-autosize commands:
HWLoopName
Name of this supply side loop. This name is used as a prefix for the supply-side object
names and node names.
HWDemandSysName
Name of the hot water demand-side loop served by this supply-side loop.
HWLoopAvailSch
Boiler loop availability schedule. See PLANT OPERATION SCHEMES for more explanation.
HWLoopTempSch
Hot water setpoint schedule [C]. If fixed setpoint, then set this to "None". See PLANT LOOP
for more explanation. For the autosized command, if omitted or set to "None", defaults to
constant setpoint of 82C.
BoilerType
Type of boiler object: BOILER-SIMPLE or PURCHASED-HOT-WATER.
BOILER:SIMPLE or PURCHASED:HOT WATER, respectively.
Uses
BoilerFuel
Boiler fuel type (required only if BoilerType=BOILER:SIMPLE). The fuel type can be
Electricity, NaturalGas, PropaneGas, FuelOil#1, FuelOil#2, Coal, Diesel, or Gasoline. For the
4/23/05
119
HVAC SYSTEM TEMPLATES
SYSTEM MACRO COMMANDS
autosized command, if omitted, defaults to NaturalGas.
explanation.
See BOILER:SIMPLE for more
BoilerFlowMode
Boiler
Flow
Mode:
ConstantFlow
or
VariableFlow
(required
only
if
BoilerType=BOILER:SIMPLE).
For the autosized command, if omitted, defaults to
ConstantFlow. See BOILER:SIMPLE for more explanation.
HWPmpType
Hot water pump type, VARIABLE or CONSTANT speed. For autosized command, if omitted,
defaults to VARIABLE.
HWPmpCtrl
Hot water pump control type: INTERMITTENT or CONTINUOUS. See PUMP:VARIABLE
SPEED or PUMP:CONSTANT SPEED for more explanation. For autosized command, if
omitted, defaults to INTERMITTENT.
The following parameters are required only for the non-autosize command:
All parameters in the Hot Water Loop Parameter Group (see below)
All parameters in the Hot Water Pump Parameter Group (see below)
All parameters in the Boiler Parameter Group (see below)
! Single Boiler Supply - Autosized
##set1 HWLoopName
= "Boiler Plant"
##set1 HWDemandSysName = "HW Demand 1"
##set1 HWLoopAvailSch
= "PlantOnSched"
##set1 HWLoopTempSch
= "HW-Loop-Temp-Schedule"
##set1 BoilerType
= "BOILER-SIMPLE"
##set1 BoilerFuel
= "NaturalGas"
##set1 BoilerFlowMode
= "VariableFlow"
##set1 HWPmpType
= "Variable"
##set1 HWPmpCtrl
= "INTERMITTENT"
!
!
!
!
!
!
!
!
!
Supply side plant name
Hot water demand side system name
Boiler availability schedule
Hot water setpoint schedule [C]
Boiler Object Type (all dashes)
Boiler fuel type
Boiler Flow Mode: ConstantFlow or VariableFlow
HW Pump Type [Variable or Constant]
HW pump control type: INTERMITTENT or CONTINUOUS
BoilerSupply1WithBypass-Autosize[]
4/23/05
120
HVAC SYSTEM TEMPLATES
! Single Boiler Supply
##set1 HWDemandSysName
##set1 HWLoopName
##set1 HWLoopAvailSch
##set1 HWLoopTempSch
##set1 HWLoopSetPoint
##set1 HWLoopMaxTemp
##set1 HWLoopMinTemp
##set1 HWLoopMaxFlow
##set1 HWLoopMinFlow
##set1 HWLoopVolume
=
=
=
=
=
=
=
=
=
=
SYSTEM MACRO COMMANDS
"Hot Water Loop 1"
"Boiler Plant"
"ON"
"HW-Loop-Temp-Schedule"
100
1
#[3 * 0.0013]
0
autosize
!
!
!
!
!
!
!
!
!
!
! Boiler Parameters for PURCHASED:HOT WATER
! ##set1 BoilerType
= "PURCHASED-HOT-WATER"
! ##set1 BoilerCap
= 1000000
! Boiler Parameters for
##set1 BoilerType
##set1 BoilerCap
##set1 BoilerFuel
##set1 BoilerEffic
##set1 BoilerMinPtLd
##set1 BoilerMaxPtLd
##set1 BoilerOptPtLd
##set1 BoilerPtLdCoeff1
##set1 BoilerPtLdCoeff2
##set1 BoilerPtLdCoeff3
##set1 BoilerFlowMode
BOILER:SIMPLE
= "BOILER-SIMPLE"
= 30000
= GAS
= 0.8
= 0.010
= 1.00
= 1.00
= 1.0
= 0.0
= 0.0
= ConstantFlow
Hot water demand side system name
Supply side plant name
Boiler availability schedule
Hot water setpoint schedule [C]
Hot water setpoint [C] if schedule=None
Max hot water temperature [C]
Min hot water temperature [C]
Max HW flow (total to all zones) [m3/s]
Min HW flow (total to all zones) [m3/s]
HW loop volume [m3]
! Boiler Object Type (all dashes)
! Boiler capacity [W]
!
!
!
!
!
!
!
!
!
!
!
Boiler
Boiler
Boiler
Boiler
Boiler
Boiler
Boiler
Boiler
Boiler
Boiler
Boiler
Object Type (all dashes)
capacity [W]
fuel
Theoretical Efficiency
Minimum Part Load Ratio
Maximum Part Load Ratio
Optimum Part Load Ratio
Coefficient1 Part Load Perf. Curve
Coefficient2 Part Load Perf. Curve
Coefficient3 Part Load Perf. Curve
Flow Mode: ConstantFlow or VariableFlow
! Hot Water Pump Parameters for PUMP:VARIABLE SPEED
##set1 HWPmpType
= "Variable"
! HW Pump Type [Variable or Constant]
##set1 HWPmpHead
= 300000
! HW Pump Rated Pump Head [Pa]
##set1 HWPmpPower
= 2273
! HW Pump Rated Power Consumption [W]
##set1 HWPmpMtrEff
= 0.87
! HW Pump Motor Efficiency
##set1 HWPmpMtrToFluid = 0.0
! HW Pump Frac Motor Inefficiencies to Fluid
##set1 HWPmpPtLdCoeff1 = 1.0
! HW Pump Coefficient1 Part Load Perf. Curve
##set1 HWPmpPtLdCoeff2 = 0.0
! HW Pump Coefficient2 Part Load Perf. Curve
##set1 HWPmpPtLdCoeff3 = 0.0
! HW Pump Coefficient3 Part Load Perf. Curve
##set1 HWPmpPtLdCoeff4 = 0.0
! HW Pump Coefficient4 Part Load Perf. Curve
##set1 HWPmpCtrl
= "INTERMITTENT"
! HW pump control type: INTERMITTENT or CONTINUOUS
! BoilerSupply1[]
BoilerSupply1WithBypass[]
Objects generated:
PLANT LOOP
BRANCH LIST
CONNECTOR LIST
SPLITTER
MIXER
BRANCH
PIPE
PUMP:VARIABLE SPEED
PLANT OPERATION SCHEMES
HEATING LOAD RANGE BASED OPERATION
LOAD RANGE EQUIPMENT LIST
4/23/05
121
HVAC SYSTEM TEMPLATES
SYSTEM MACRO COMMANDS
PURCHASED:HOT WATER
Option – select one
BOILER:SIMPLE
(additional options will be made available)
ChillerSupply1-Autosize[ ] (Not implemented yet) and ChillerSupply1[ ]
ChillerSupply1WithBypass-Autosize[ ] and ChillerSupply1WithBypass[ ]
Describes the supply side equipment and branches for a single chiller plant or purchased
chilled water plant with or without bypass.
The following parameters are required for both autosize and non-autosize commands:
ChillerCondType
Chiller condenser type: WATER-COOLED, AIR-COOLED, or EVAP-COOLED.
See
CHILLER:ELECTRIC or CHILLER:CONST COP for more explanation. For autosized
command, if omitted, defaults to WATER-COOLED.
ChWLoopName
Name of this supply side loop. This name is used as a prefix for the supply-side object
names and node names.
ChWDemandSysName
Name of the chilled water demand-side loop served by this supply-side loop.
ChWLoopAvailSch
Chiller loop availability schedule. See PLANT OPERATION SCHEMES for more explanation.
ChWLoopTempSch
Chilled water setpoint schedule name [C]. If fixed setpoint, then set this to "None". See
PLANT LOOP for more explanation. For the autosized command, if omitted or set to "None",
defaults to constant setpoint of 7.22 C.
ChillerType
Type of chiller object: CHILLER-ELECTRIC (autosized only), CHILLER-CONST-COP (nonautosized only) or PURCHASED-CHILLED-WATER.
Uses CHILLER:ELECTRIC,
CHILLER:CONST COP or PURCHASED:CHILLED WATER, respectively.
ChillerCOP
Chiller COP. See CHILLER:ELECTRIC or CHILLER:CONST COP for more explanation. For
autosized command, if omitted, defaults to 3.2.
ChillerCondType
Chiller condenser type: WATER COOLED, AIR COOLED, or EVAP COOLED. See
CHILLER:ELECTRIC or CHILLER:CONST COP for more explanation. For autosized
command, if omitted, defaults to WATER-COOLED.
4/23/05
122
HVAC SYSTEM TEMPLATES
SYSTEM MACRO COMMANDS
ChillerFlowMode
Chiller Flow Mode: ConstantFlow or VariableFlow.
See CHILLER:ELECTRIC or
CHILLER:CONST COP for more explanation. Not required if ChillerType – PURCHASEDCHILLED-WATER. For autosized command, if omitted, defaults to ConstantFlow.
ChWPmpType
Chilled water pump type, VARIABLE or CONSTANT speed. For autosized command, if
omitted, defaults to VARIABLE.
ChWPmpCtrl
Chilled water pump control type: INTERMITTENT or CONTINUOUS. See PUMP:VARIABLE
SPEED or PUMP:CONSTANT SPEED for more explanation. For autosized command, if
omitted, defaults to INTERMITTENT.
The following parameters are required only for the non-autosize command:
All parameters in the Chilled Water Loop Parameter Group (see below)
All parameters in the Chilled Water Pump Parameter Group (see below)
All parameters in the Chiller Parameter Group (see below)
! Single Chiller Supply
##set1 ChWLoopName
##set1 ChWDemandSysName
##set1 ChWLoopAvailSch
##set1 ChWLoopTempSch
##set1 ChillerType
=
=
=
=
=
##set1 ChillerCOP
##set1 ChillerFlowMode
##set1 ChillerCondType
= 3.2
= "VariableFlow"
= "WATER-COOLED"
##set1 ChWPmpType
##set1 ChWPmpCtrl
= "Variable"
= "INTERMITTENT"
4/23/05
Autosized
"Chiller Plant"
"CHW Demand 1"
"PlantOnSched"
"CW-Loop-Temp-Schedule"
"CHILLER-ELECTRIC"
!
!
!
!
!
!
!
!
!
!
!
!
Supply side plant name
Chilled water demand side system
Chiller availability schedule
Chilled water setpoint schedule [C]
Chiller Object Type (PURCHASED-CHILLED-WATER or
CHILLER-ELECTRIC)
Chiller COP (optional, defaults to 3.2)
Chiller Flow Mode: ConstantFlow or VariableFlow
Chiller condenser type: WATER-COOLED, AIR-COOLED, or
EVAP-COOLED
ChW Pump Type [Variable or Constant]
ChW pump control type: INTERMITTENT or CONTINUOUS
123
HVAC SYSTEM TEMPLATES
!
!
!
!
SYSTEM MACRO COMMANDS
Single Chiller Supply
Chiller Parameters for PURCHASED:CHILLED WATER
##set1 ChillerType
= "PURCHASED-CHILLED-WATER"! Chiller Object Type (all dashes)
##set1 ChillerCap
= 1000000
! Chiller capacity [W]
! Chiller Parameters for CHILLER:CONST COP
##set1 ChillerType
= "CHILLER-CONST-COP"
! Chiller Object Type (all dashes)
##set1 ChillerCap
= 30000
! Chiller capacity [W]
##set1 ChillerCOP
= 5.85
! Chiller COP
! 4.312E-8 m3/s per W is equivalent to 2.4 gpm per ton
##set1 ChillerEvWFlow
= #[ChillerCap[] * 0.00000004312] ! Chiller evaporator vol flow rate [m3/s]
! 5.39E-8 m3/s per W is equivalent to 3 gpm per ton
##set1 ChillerCdWFlow
= #[ChillerCap[] * 0.0000000539] ! Chiller condenser vol flow rate [m3/s]
##set1 ChillerCondType = "WATER COOLED"
! Chiller condenser type: WATER COOLED, AIR COOLED, or
EVAP COOLED
##set1 ChillerFlowMode = ConstantFlow
! Chiller Flow Mode: ConstantFlow or VariableFlow
##set1
##set1
##set1
##set1
##set1
##set1
##set1
##set1
##set1
##set1
ChWDemandSysName
ChWLoopName
ChWLoopAvailSch
ChWLoopTempSch
ChWLoopSetPoint
ChWLoopMaxTemp
ChWLoopMinTemp
ChWLoopMaxFlow
ChWLoopMinFlow
ChWLoopVolume
=
=
=
=
=
=
=
=
=
=
"Chilled Water Loop 1"
"Chiller Plant"
"ON"
"CW-Loop-Temp-Schedule"
6.67
98
1
ChillerEvWFlow[]
0
autosize
!
!
!
!
!
!
!
!
!
!
Chilled water demand side system
Supply side plant name
Chiller availability schedule
Chilled water setpoint schedule [C]
Chilled water setpoint [C] if schedule=None
Max chilled water temperature [C]
Min chilled water temperature [C]
Max ChW flow (total to all zones) [m3/s]
Min ChW flow (total to all zones) [m3/s]
ChW loop volume [m3]
! Chilled Water Pump Parameters for PUMP:VARIABLE SPEED
##set1 ChWPmpType
= "Variable"
! ChW Pump Type
##set1 ChWPmpHead
= 300000
! ChW
##set1 ChWPmpPower
= 500
! ChW
##set1 ChWPmpMtrEff
= 0.87
! ChW
##set1 ChWPmpMtrToFluid = 0.0
! ChW
##set1 ChWPmpPtLdCoeff1 = 1.0
! ChW
##set1 ChWPmpPtLdCoeff2 = 0.0
! ChW
##set1 ChWPmpPtLdCoeff3 = 0.0
! ChW
##set1 ChWPmpPtLdCoeff4 = 0.0
! ChW
##set1 ChWPmpCtrl
= "INTERMITTENT"
! ChW
[Variable or Constant]
Pump Rated Pump Head [Pa]
Pump Rated Power Consumption [W]
Pump Motor Efficiency
Pump Frac Motor Inefficiencies to Fluid
Pump Coefficient1 Part Load Perf. Curve
Pump Coefficient2 Part Load Perf. Curve
Pump Coefficient3 Part Load Perf. Curve
Pump Coefficient4 Part Load Perf. Curve
pump control type: INTERMITTENT or CONTINUOUS
ChillerSupply1[]
Objects generated:
PLANT LOOP
BRANCH LIST
CONNECTOR LIST
SPLITTER
MIXER
BRANCH
PIPE
PUMP:VARIABLE SPEED
PLANT OPERATION SCHEMES
LOAD RANGE BASED OPERATION
COOLING LOAD RANGE EQUIPMENT LIST
Option – select one
PURCHASED:CHILLED WATER
CHILLER:CONST COP
4/23/05
124
HVAC SYSTEM TEMPLATES
SYSTEM MACRO COMMANDS
(additional options will be made available)
Condenser1-Autosize[ ] (Not implemented yet) and Condenser1[ ]
Condenser1WithBypass-Autosize[ ]
Describes the condenser loop for a single chiller plant.
The following parameters are required for both autosize and non-autosize commands:
ChWLoopName
Name of this supply side loop – must match the chiller plant name. This name is used as a
prefix for the supply-side object names and node names.
CndLoopAvailSch
Chiller loop availability schedule. See PLANT OPERATION SCHEMES for more explanation.
CndLoopTempCntrl
Loop Temperature Setpoint control type: SCHEDULED, FIXED, AIR, or GROUND. For
autosized command, if omitted, defaults to AIR. See CONDENSER LOOP for more
explanation.
CondenserType
Type of condenser (tower) object: COOLING-TOWER-SINGLE-SPEED or COOLINGTOWER-TWO-SPEED (non-autosized only). Uses COOLING TOWER:SINGLE SPEED or
COOLING TOWER:TWO SPEED, respectively.
CndLoopTempSch
Condenser water setpoint schedule [C]. If fixed setpoint, then set this to "None". See
CONDENSER LOOP for more explanation. For autosized command, if omitted, defaults to
"None".
CndLoopSetPoint
Condenser water setpoint [C] if schedule="None". For a fixed setpoint, the template will
generate an automatic set point schedule with this value. For autosized command, if omitted,
defaults to 21C.
CndPmpType
Condenser water pump type, VARIABLE or CONSTANT speed. For autosized command, if
omitted, defaults to VARIABLE.
CndPmpCtrl
Condenser water pump control type: INTERMITTENT or CONTINUOUS.
PUMP:VARIABLE SPEED or PUMP:CONSTANT SPEED for more explanation.
autosized command, if omitted, defaults to INTERMITTENT.
See
For
The following parameters are required only for the non-autosize command:
4/23/05
125
HVAC SYSTEM TEMPLATES
SYSTEM MACRO COMMANDS
All parameters in the Condenser Water Loop Parameter Group (see below)
All parameters in the Condenser Water Pump Parameter Group (see below)
All parameters in the Cooling Tower Parameter Group (see below)
! Condenser Loop for Single Chiller Plant - Autosized
##set1 ChWLoopName
= "Chiller Plant"
! Supply side plant name (must match chiller plant
name)
##set1 CndLoopAvailSch = "PlantOnSched"
! Condenser availability schedule
##set1 CndLoopTempCntrl = "AIR"
! Loop Temperature Setpoint control type [SCHEDULED,
!
FIXED, AIR, or GROUND] (optional, defaults to AIR)
! ##set1 CndLoopSetPoint = 21
! Condenser loop fixed setpoint temperature [C] (optional, defaults to
21C)
! ##set1 CndLoopTempSch
= "None"
! Condenser loop setpoint schedule [C] or "None"
!
(optional, defaults to "None")
##set1 CondenserType
= "COOLING-TOWER-SINGLE-SPEED" ! Condenser Object Type (all dashes)
##set1 CndPmpType
= "Variable"
! Cnd Pump Type [Variable or Constant]
##set1 CndPmpCtrl
= "INTERMITTENT"
! Cnd pump control type: INTERMITTENT or CONTINUOUS
4/23/05
126
HVAC SYSTEM TEMPLATES
! Condenser Loop for Single Chiller Plant
##set1 ChWLoopName
= "Chiller Plant"
name)
##set1 CndLoopAvailSch = "ON"
##set1 CndLoopTempCntrl = "FIXED"
FIXED, AIR, or GROUND]
##set1 CndLoopSetPoint = 21
##set1 CndLoopTempSch
= "None"
##set1 CndLoopMaxTemp
= 80
##set1 CndLoopMinTemp
= 5.0
##set1 CndLoopMaxFlow
= 0.0011
##set1 CndLoopMinFlow
= 0
##set1 CndLoopVolume
= autosize
##set1 CndLoopLdDist
= Sequential
SYSTEM MACRO COMMANDS
! Supply side plant name (must match chiller plant
! Condenser availability schedule
! Loop Temperature Setpoint control type [SCHEDULED,
!
!
!
!
!
!
Condenser loop fixed setpoint temperature [C]
Condenser loop setpoint schedule [C] or "None"
Max condenser water temperature [C]
Min condenser water temperature [C]
Max condenser water flow rate [m3/s]
Min condenser water flow rate [m3/s]
! Condenser loop volume [m3]
! Load Distribution Scheme [Optimal or Sequential]
! Condenser Parameters for COOLING TOWER:SINGLE SPEED
##set1 CondenserType
= "COOLING-TOWER-SINGLE-SPEED" ! Condenser Object Type (all dashes)
##set1 CondenserCap
= 9000000000
! Condenser capacity [W]
##set1 CondenserAirFlow = 16.0
! Condenser Design Air Flow Rate [m3/s]
##set1 CondenserFanPwr = 1000
! Condenser Fan Power at Design Air Flow Rate [W]
##set1 CondenserUA
= 1750.0
! Condenser UA value at Design Air Flow Rate [W/C]
##set1 CondenserAirFree = 0.0
! Condenser Air Flow Rate in Free Convection Regime
[m3/s]
##set1 CondenserUAFree = 0.0
! Condenser UA value at Free Convection Air Flow Rate
[W/C]
! Condenser Parameters for COOLING TOWER:SINGLE SPEED
! ##set1 CondenserType
= "COOLING-TOWER-SINGLE-SPEED" ! Condenser Object Type (all dashes)
! ##set1 CondenserCap
= 1000000
! Condenser capacity [W]
! ##set1 CondenserAirHi
=
! Condenser Air Flow Rate at High Fan Speed [m3/s]
! ##set1 CondenserFanHi
=
! Condenser Fan Power at High Fan Speed [W]
! ##set1 CondenserUAHi
=
! Condenser UA value at High Fan Speed [W/C]
! ##set1 CondenserAirLo
=
! Condenser Air Flow Rate at Low Fan Speed [m3/s]
! ##set1 CondenserFanLo
=
! Condenser Fan Power at Low Fan Speed [W]
! ##set1 CondenserUALo
=
! Condenser UA value at Low Fan Speed [W/C]
! ##set1 CondenserAirFree =
! Condenser Air Flow Rate in Free Convection Regime
[m3/s]
! ##set1 CondenserUAFree =
! Condenser UA value at Free Convection Air Flow Rate
[W/C]
! Condenser Water Pump Parameters for PUMP:VARIABLE SPEED
##set1 CndPmpType
= "Variable"
! Cnd Pump Type [Variable or Constant]
##set1 CndPmpHead
= 300000
! Cnd Pump Rated Pump Head [Pa]
##set1 CndPmpPower
= 500
! Cnd Pump Rated Power Consumption [W]
##set1 CndPmpMtrEff
= 0.87
! Cnd Pump Motor Efficiency
##set1 CndPmpMtrToFluid = 0.0
! Cnd Pump Frac Motor Inefficiencies to Fluid
##set1 CndPmpPtLdCoeff1 = 1.0
! Cnd Pump Coefficient1 Part Load Perf. Curve
##set1 CndPmpPtLdCoeff2 = 0.0
! Cnd Pump Coefficient2 Part Load Perf. Curve
##set1 CndPmpPtLdCoeff3 = 0.0
! Cnd Pump Coefficient3 Part Load Perf. Curve
##set1 CndPmpPtLdCoeff4 = 0.0
! Cnd Pump Coefficient4 Part Load Perf. Curve
##set1 CndPmpCtrl
= "INTERMITTENT"
! Cnd pump control type: INTERMITTENT or CONTINUOUS
Condenser1[]
Objects generated:
CONDENSER LOOP
BRANCH LIST
CONNECTOR LIST
SPLITTER
MIXER
BRANCH
PIPE
4/23/05
127
HVAC SYSTEM TEMPLATES
SYSTEM MACRO COMMANDS
PUMP:VARIABLE SPEED
CONDENSER OPERATION SCHEMES
COOLING LOAD RANGE BASED OPERATION
LOAD RANGE EQUIPMENT LIST
Option – select one
COOLING TOWER:SINGLE SPEED
COOLING TOWER:TWO SPEED
Chilled Water Loop Parameter Group
ChWLoopMaxFlow
Maximum chilled water flow rate (total to all coils) [m3/s].
explanation.
See PLANT LOOP for more
ChWLoopMinFlow
Minimum chilled water flow (total to all coils) [m3/s]. See PLANT LOOP for more explanation.
ChWLoopTempSch
Chilled water setpoint schedule [C]. If fixed setpoint, then set this to "None". See PLANT
LOOP for more explanation.
ChWLoopSetPoint
Chilled water setpoint [C] if schedule="None". For a fixed setpoint, the template will generate
an automatic set point schedule with this value.
ChWLoopMaxTemp
Maximum chilled water temperature [C]. See PLANT LOOP for more explanation.
ChWLoopMinTemp
Minimum chilled water temperature [C]. See PLANT LOOP for more explanation.
ChWLoopVolume
Chilled water loop volume [m3] . May be set to "autosize". See PLANT LOOP for more
explanation.
Hot Water Loop Parameter Group
HWLoopMaxFlow
Max HW flow (total to all coils) [m3/s] . See PLANT LOOP for more explanation.
HWLoopMinFlow
Min HW flow (total to all coils) [m3/s] . See PLANT LOOP for more explanation.
4/23/05
128
HVAC SYSTEM TEMPLATES
SYSTEM MACRO COMMANDS
HWLoopTempSch
Hot water setpoint schedule [C]. If fixed setpoint, then set this to "None". See PLANT LOOP
for more explanation.
HWLoopSetPoint
Hot water setpoint [C] if schedule="None". For a fixed setpoint, the template will generate an
automatic set point schedule with this value.
HWLoopMaxTemp
Max HW temperature [C] . See PLANT LOOP for more explanation.
HWLoopMinTemp
Min HW temperature [C] . See PLANT LOOP for more explanation.
HWLoopVolume
HW loop volume [m3] . See PLANT LOOP for more explanation.
Condenser Water Loop Parameter Group
CndLoopMaxFlow
Maximum condenser water flow rate [m3/s]. See CONDENSER LOOP for more explanation.
CndLoopMinFlow
Minimum condenser water flow (total to all coils) [m3/s]. See CONDENSER LOOP for more
explanation.
CndLoopTempSch
Condenser water setpoint schedule [C]. If fixed setpoint, then set this to "None".
CONDENSER LOOP for more explanation.
See
CndLoopSetPoint
Condenser water setpoint [C] if schedule="None". For a fixed setpoint, the template will
generate an automatic set point schedule with this value.
CndLoopMaxTemp
Maximum condenser water temperature [C]. See CONDENSER LOOP for more explanation.
CndLoopMinTemp
Minimum condenser water temperature [C]. See CONDENSER LOOP for more explanation.
CndLoopVolume
Condenser water loop volume [m3] . May be set to "autosize". See CONDENSER LOOP for
more explanation.
4/23/05
129
HVAC SYSTEM TEMPLATES
SYSTEM MACRO COMMANDS
Chilled Water Pump Parameter Group
ChWPmpType
Chilled water pump type, "Variable" or "Constant" speed.
ChWPmpHead
Chilled water pump rated pump head [Pa].
PUMP:CONSTANT SPEED for more explanation.
See PUMP:VARIABLE SPEED or
ChWPmpPower
Chilled water pump rated power consumption [W].
PUMP:CONSTANT SPEED for more explanation.
See PUMP:VARIABLE SPEED or
ChWPmpMtrEff
Chilled water pump motor efficiency. See PUMP:VARIABLE SPEED or PUMP:CONSTANT
SPEED for more explanation.
ChWPmpMtrToFluid
Chilled water pump fraction of motor inefficiencies to fluid. See PUMP:VARIABLE SPEED or
PUMP:CONSTANT SPEED for more explanation.
ChWPmpPtLdCoeff1
ChWPmpPtLdCoeff2
ChWPmpPtLdCoeff3
ChWPmpPtLdCoeff4
These parameters are the coefficients of the chilled water pump part load performance curve.
See PUMP:VARIABLE SPEED for more explanation.
(Applicable only if
ChWPmpType="Variable".)
ChWPmpCtrl
Chilled water pump control type: INTERMITTENT or CONTINUOUS. See PUMP:VARIABLE
SPEED or PUMP:CONSTANT SPEED for more explanation.
Hot Water Pump Parameter Group
HWPmpType
Hot water pump type, "Variable" or "Constant" speed.
HWPmpHead
Hot water pump rated pump head [Pa].
PUMP:CONSTANT SPEED for more explanation.
See
PUMP:VARIABLE
SPEED
or
HWPmpPower
Hot water pump rated power consumption [W].
PUMP:CONSTANT SPEED for more explanation.
4/23/05
See PUMP:VARIABLE SPEED or
130
HVAC SYSTEM TEMPLATES
SYSTEM MACRO COMMANDS
HWPmpMtrEff
Hot water pump motor efficiency.
SPEED for more explanation.
See PUMP:VARIABLE SPEED or PUMP:CONSTANT
HWPmpMtrToFluid
Hot water pump fraction of motor inefficiencies to fluid. See PUMP:VARIABLE SPEED or
PUMP:CONSTANT SPEED for more explanation.
HWPmpPtLdCoeff1
HWPmpPtLdCoeff2
HWPmpPtLdCoeff3
HWPmpPtLdCoeff4
These parameters are the coefficients of the hot water pump part load performance curve.
See PUMP:VARIABLE SPEED for more explanation.
(Applicable only if
HWPmpType="Variable".)
HWPmpCtrl
Hot water pump control type: INTERMITTENT or CONTINUOUS. See PUMP:VARIABLE
SPEED or PUMP:CONSTANT SPEED for more explanation.
Condenser Water Pump Parameter Group
CndPmpType
Condenser water pump type, "Variable" or "Constant" speed.
CndPmpHead
Condenser water pump rated pump head [Pa].
PUMP:CONSTANT SPEED for more explanation.
See PUMP:VARIABLE SPEED or
CndPmpPower
Condenser water pump rated power consumption [W]. See PUMP:VARIABLE SPEED or
PUMP:CONSTANT SPEED for more explanation.
CndPmpMtrEff
Condenser water pump motor efficiency.
PUMP:CONSTANT SPEED for more explanation.
See
PUMP:VARIABLE
SPEED
or
CndPmpMtrToFluid
Condenser water pump fraction of motor inefficiencies to fluid.
SPEED or PUMP:CONSTANT SPEED for more explanation.
4/23/05
See PUMP:VARIABLE
131
HVAC SYSTEM TEMPLATES
SYSTEM MACRO COMMANDS
CndPmpPtLdCoeff1
CndPmpPtLdCoeff2
CndPmpPtLdCoeff3
CndPmpPtLdCoeff4
These parameters are the coefficients of the condenser water pump part load performance
curve.
See PUMP:VARIABLE SPEED for more explanation.
(Applicable only if
CndPmpType="Variable".)
CndPmpCtrl
Condenser water pump control type: INTERMITTENT or CONTINUOUS.
PUMP:VARIABLE SPEED or PUMP:CONSTANT SPEED for more explanation.
See
Boiler Parameter Group
BoilerCap
Boiler capacity [W].
explanation.
See BOILER:SIMPLE
or PURCHASED:HOT WATER for more
The following parameters are only required if BOILER:SIMPLE is the selected boiler type:
BoilerFuel
Boiler fuel type. The fuel type can be Electricity, NaturalGas, PropaneGas, FuelOil#1,
FuelOil#2, Coal, Diesel, or Gasoline. See BOILER:SIMPLE for more explanation.
BoilerEffic
Boiler Theoretical Efficiency. See BOILER:SIMPLE for more explanation.
BoilerMinPtLd
Boiler Minimum Part Load Ratio. See BOILER:SIMPLE for more explanation.
BoilerMaxPtLd
Boiler Maximum Part Load Ratio. See BOILER:SIMPLE for more explanation.
BoilerOptPtLd
Boiler Optimum Part Load Ratio. See BOILER:SIMPLE for more explanation.
BoilerPtLdCoeff1
Boiler Coefficient1 Part Load Perf. Curve. See BOILER:SIMPLE for more explanation.
BoilerPtLdCoeff2
Boiler Coefficient2 Part Load Perf. Curve. See BOILER:SIMPLE for more explanation.
BoilerPtLdCoeff3
Boiler Coefficient3 Part Load Perf. Curve. See BOILER:SIMPLE for more explanation.
4/23/05
132
HVAC SYSTEM TEMPLATES
SYSTEM MACRO COMMANDS
BoilerFlowMode
Boiler Flow Mode: ConstantFlow or VariableFlow. .
explanation.
See BOILER:SIMPLE for more
Chiller Parameter Group
ChillerCap
Chiller capacity [W]. See CHILLER:CONST COP or PURCHASED:CHILLED WATER for
more explanation.
The following parameters are only required if CHILLER:CONST COP is the selected boiler
type:
ChillerCOP
Chiller COP. See CHILLER:CONST COP for more explanation.
ChillerEvWFlow
Chiller evaporator vol flow rate [m3/s]. 4.312E-8 m3/s per W of cooling capacity is equivalent
to 2.4 gpm per ton. See CHILLER:CONST COP for more explanation.
ChillerCdWFlow
Chiller condenser vol flow rate [m3/s]. 5.39E-8 m3/s per W of cooling capacity is equivalent
to 3 gpm per ton. See CHILLER:CONST COP for more explanation.
ChillerCondType
Chiller condenser type: WATER COOLED, AIR COOLED, or EVAP COOLED.
CHILLER:CONST COP for more explanation.
See
ChillerFlowMode
Chiller Flow Mode: ConstantFlow or VariableFlow. See CHILLER:CONST COP for more
explanation.
Cooling Tower Parameter Group
The following parameters are applicable to both COOLING TOWER:SINGLE SPEED and
COOLING TOWER:TWO SPEED:
CondenserCap
Condenser capacity [W].
See COOLING TOWER:SINGLE SPEED or COOLING
TOWER:TWO SPEED for more explanation.
CondenserAirFree
Condenser Air Flow Rate in Free Convection Regime [m3/s] .
See COOLING
TOWER:SINGLE SPEED or COOLING TOWER:TWO SPEED for more explanation.
CondenserUAFree
Condenser UA value at Free Convection Air Flow Rate [W/C] .
See COOLING
TOWER:SINGLE SPEED or COOLING TOWER:TWO SPEED for more explanation.
The following parameters are applicable to only COOLING TOWER:SINGLE SPEED:
4/23/05
133
HVAC SYSTEM TEMPLATES
SYSTEM MACRO COMMANDS
CondenserAirFlow
Condenser Design Air Flow Rate [m3/s]. See COOLING TOWER:SINGLE SPEED for more
explanation.
CondenserFanPwr
Condenser Fan Power at Design Air Flow Rate [W].
SPEED for more explanation.
See COOLING TOWER:SINGLE
CondenserUA
Condenser UA value at Design Air Flow Rate [W/C].
SPEED for more explanation.
See COOLING TOWER:SINGLE
End COOLING TOWER:SINGLE SPEED parameters.
The following parameters are applicable to only COOLING TOWER:TWO SPEED:
CondenserAirHi
Condenser Air Flow Rate at High Fan Speed [m3/s]. See COOLING TOWER:TWO SPEED
for more explanation.
CondenserFanHi
Condenser Fan Power at High Fan Speed [W]. See COOLING TOWER:TWO SPEED for
more explanation.
CondenserUAHi
Condenser UA value at High Fan Speed [W/C]. See COOLING TOWER:TWO SPEED for
more explanation.
CondenserAirLo
Condenser Air Flow Rate at Low Fan Speed [m3/s]. See COOLING TOWER:TWO SPEED
for more explanation.
CondenserFanLo
Condenser Fan Power at Low Fan Speed [W]. See COOLING TOWER:TWO SPEED for
more explanation.
CondenserUALo
Condenser UA value at Low Fan Speed [W/C]. See COOLING TOWER:TWO SPEED for
more explanation.
End COOLING TOWER:TWO SPEED parameters.
4/23/05
134
WINEPDRAW
INTRODUCTION
WinEPDraw
Introduction
The WinEPDraw program is a simple utility that can be used to generate a dxf file from an
input file without going entirely through the input scan for EnergyPlus. It is a simple
Windows™ applet that is stored in the primary EnergyPlus folder upon installation. A
companion DLL (EplusDrw.dll) is also needed should you want to put this application in
another folder.
Figure 14. WinEPDraw Main Screen
File Menu
The file menu has four options:
Select Input File
The Select Input File option corresponds to the folder open icon on the tool bar area and
allows you to select an IDF file.
Create DXF File
The Create DXF File option corresponds to the traffic signal icon on the tool bar area and
creates a DXF file from the “current” input file.
4/23/05
135
WINEPDRAW
INTRODUCTION
Select DXF File
The Select DXF File option corresponds to the DXF icon on the tool bar area and allows you
to select an existing DXF file for viewing.
Select DXF Viewer
The Select DXF Viewer option allows you to select the appropriate DXF Viewer program to
be used when you want to view a DXF file from within WinEPDraw.
Options Menu
The Options Menu has one option:
Options for >4 sided polygons
Polygons with >4 sides do not display with the 3DFACE command we use for surfaces of 3
and 4 sides which subsequently will display very nicely as a “solid” in many DXF viewers.
Thus there are two options which the user may choose to display >4 sided polygons.
Thick Polyline
With this option, the >4 sided polygon appears as a thicker line in all views of the building
model.
Thin Polyline
With this option, the >4 sided polygon appears as a wire frame line in all views of the building
model.
View Menu
The view menu has one option:
DrawingFile
Using this option (or the camera icon in the tool bar area), the DXF viewer program presents
the building model for viewing on screen.
Help Menu
There is no online help but you can select:
About
Brings up the “about” box for the WinEPDraw program.
For example, Choosing the File->Select Input File menu or open file toolbar button, the
standard common dialog is displayed:
4/23/05
136
WINEPDRAW
INTRODUCTION
Figure 15. Dialog for WinEPDraw File Selection
Select one and it will be read in and a DXF file will be produced in the same folder as the
original IDF file. Then, a message box will appear notifying you that the process was
successful (or that it failed). If it failed, no DXF file is produced.
You may process as many IDFs as you like during WinEPDraw execution.
You may view pre-existing DXF files without needing to re-create them.
To exit the program, choose File->Exit menu.
Note that the WinEPDraw program only processes building and shading surfaces. It does not
process daylighting reference points though the similar option in the EnergyPlus program
(Report, Surfaces, DXF;) does show the daylighting reference points (but not illuminance
map points) in the DXF view.
4/23/05
137
INPUT MACROS
INTRODUCTION
Input Macros
Introduction
The Input Macros feature increases the flexibility of the EnergyPlus input files. This feature is
intended for advanced users who are already familiar with EnergyPlus IDF files and need to
prepare input manually. The basic capabilities are:
Incorporating external files containing pieces of IDF into the main EnergyPlus input
stream.
Selectively accepting or skipping portions of the input.
Defining a block of input with parameters and later referencing this block.
Performing arithmetic and logical operations on the input.
Input macro debugging and listing control.
These capabilities are invoked in the EP-MACRO program by using macro commands.
Macro commands are preceded by ## to distinguish them from regular EnergyPlus input
commands. After execution by the EP-MACRO processor, macro commands produce
regular lines of EnergyPlus input that are shown in the resultant IDF file (out.idf) and,
subsequently, in the EnergyPlus echo print (audit.out). Following are descriptions of the
macro commands associated with the above capabilities. A detailed example of input macros
is given at the end of this section; you should review it before reading the macro command
descriptions.
Incorporating External Files
##include {includefilename}
This command puts all of the lines in an external file into the EnergyPlus input stream starting
right after the command line. The name of the file that is included is the concatenation of
{prefixpathname}, entered using ##fileprefix , and {includefilename}. The lines in the
external file will be listed in the resultant IDF file. When all the lines in the external file have
been read in, input reverts back to the original input file at the line following the ##include
command.
##fileprefix {prefixpathname}
specifies a pathname that will be prefixed to the filename given in an ##include command.
The ##fileprefix command allows commonly-used include files to be kept in a directory other
than the directory in which the current input file resides.
Example: on a PC, the combination
##fileprefix C:\EnergyPlus\Library
##include SCHEDULES.IDF
will include into the EnergyPlus input stream the file whose full name is
C:\EnergyPlus\Library\SCHEDULES.IDF
##includesilent {includefilename}
This command is identical to ##include, except that the lines in the included file will not be
listed in the EP-MACRO echo.
##nosilent
4/23/05
138
INPUT MACROS
SELECTIVELY ACCEPTING OR SKIPPING LINES OF INPUT
Overrides the listing suppression of ##includesilent. Used for debugging purposes only.
After ##nosilent , all following ##includesilent commands are treated as ##include
commands.
Example: Assume the following files contain the indicated lines:
Main input file:
External file:
input1.inp
file2.inp
line 1a
line 2a
##include file2.inp line 2b
line 1b
line 2c
line 1c
The end result of processing ##include input1.inp will be:
line 1a (from input1.inp)
line 2a (from file2.inp)
line 2b (from file2.inp)
line 2c (from file2.inp)
line 1b (from input1.inp)
line 1c (from input1.inp)
External files can also contain ##include commands, as shown in the following example:
Main input file:
First external file:
Second external file:
input1.inp
file2.inp
file3.inp
line 1a
line 2a
line 3a
##include file2.inp line 2b
line 3b
line 1b
##include file3.inp
line 3c
line 1c
line 2c
line 3d
The end result of processing ##include input1.tmp will be:
line 1a (from input1.inp)
line 2a (from file2.inp)
line 2b (from file2.inp)
line 3a (from file3.inp)
line 3b (from file3.inp)
line 3c (from file3.inp)
line 3d (from file3.inp)
line 2c (from file2.inp)
line 1b (from input1.inp)
line 1c (from input1.inp)
Note: Up to nine ##include commands can be nested. However, there should be no
recursion. This is an example of a recursion:
file1.inp contains ##include file2.inp
file2.inp contains ##include file1.inp
Selectively Accepting or Skipping Lines of Input
The ##if series of commands is used to selectively accept or skip lines of input according to
the following sequence:
##if {condition1}
line1a
line1b
4/23/05
139
INPUT MACROS
SELECTIVELY ACCEPTING OR SKIPPING LINES OF INPUT
….
##elseif
line2a
line2b
{condition2}
##elseif
line3a
line3b
….
{condition3}
##else
line N a
line N b
….
##endif
Then the lines that will be included into the EnergyPlus input stream are:
If {condition 1} is TRUE,
line1a
line1b
….
otherwise
If {condition 2} is TRUE,
line2a
line2b
….
otherwise
If {condition 3} is TRUE,
line3a
line3b
….
otherwise
If {condition 1}, {condition 2}, {condition 3} are all FALSE.
line N a
line N b
….
There are six different ##if... commands:
Command
##ifdef
##ifndef
##if
##elseif
Result
{macro
name}
{macro
name}
{condition}
{condition}
: if macro name defined, include following lines
: if macro name NOT defined, include following lines
: if condition is TRUE, include following lines
: if condition is TRUE, and previous conditions are FALSE,
include
following lines
: if all previous conditions are FALSE, include following lines
: indicates the end of the if block
##else
##endif
Notes:
{macro name} is explained in section Defining Blocks of Input, below.
4/23/05
140
INPUT MACROS
DEFINING BLOCKS OF INPUT
{condition} is 0 or BLANK meaning FALSE, and any other character meaning TRUE.
##ifdef and ##ifndef do not have corresponding ##elseif commands, but they do have
corresponding ##else and ##endif commands.
Defining Blocks of Input
The ##def command allows a block of input text to be defined and given a name. The block
of text can then be inserted anywhere in the EnergyPlus input stream by simply referencing
the name of the block. (This process is called macro expansion.) The block can have
parameters (also called arguments) that can be given different values each time the block is
referenced.
The syntax of the ##def command is as follows:
unique name
|
|
|
##def
|_
|
|
zero
or
more
spaces
macro-name [ arg1 arg2,arg3 ...]
|
|
|
one
or
more
spaces
Example:
zero or more arguments
|
|
| |
| |
| |
zero_|
or
more
spaces
|_
|
_|
| | |
| | |
space(s)
or comma
__ macro text
|
|
text line 1
|
|__ one
or
more
spaces
Define a schedule macro with name "All_Const":
##def All_Const[x]
Fraction, WeekON, 1,1, 12,31;
WEEKSCHEDULE, WeekON,
DayON,DayON,DayON,
DayON,DayON,DayON,
DayON,DayON,DayON,
DayON,DayON,DayON;
DAYSCHEDULE, DayON, Fraction,
x,x,x,x,x,x,x,x,x,x,x,x,
x,x,x,x,x,x,x,x,x,x,x,x ;
##enddef
Then, in the EnergyPlus input stream (file in.imf), when we write :
SCHEDULE, Constant At 0.8, All_Const[0.8]
the result (file out.idf) is equivalent to:
SCHEDULE, Constant At 0.8,
Fraction, WeekON, 1,1, 12,31;
WEEKSCHEDULE, WeekON,
DayON,DayON,DayON,
DayON,DayON,DayON,
DayON,DayON,DayON,
DayON,DayON,DayON;
DAYSCHEDULE, DayON, Fraction,
0.8,0.8,0.8,0.8,0.8,0.8,0.8,0.8,0.8,0.8,0.8,0.8,
0.8,0.8,0.8,0.8,0.8,0.8,0.8,0.8,0.8,0.8,0.8,0.8 ;
Macro definitions may have one or more arguments; the maximum number of arguments is
32. When a macro with arguments is referenced, its arguments must be given values. When
4/23/05
141
INPUT MACROS
DEFINING BLOCKS OF INPUT
a macro has no arguments, the brackets are still required both for macro definition and
reference.
Caution: Square brackets [ ] have been used in some versions of EnergyPlus inputs as comment/units
fields. These will be expanded if left in the IDF and sent to EPMacro.
Macro names must be unique (except see ##set1 below); i.e., when a macro name is defined
it cannot be defined again. Macro names are limited to 40 characters.
To summarize, commands you use to define macros are the following:
##def macro-name [arg1,..,argn ] macro-text
Defines a macro with the name macro-name and arguments "arg1" through "argn". "Macrotext" is one or more lines of text. If there are no arguments, the syntax is ##def macro-name
macro-text.
##enddef
Indicates the end of the macro definition initiated by ##def.
##def1
macro-name [arg1,..,argn ] macro-text
This is the same as ##def but there is only one line of text so that the terminating command
##enddef is not required.
##set1
macro-name macro-text
Like ##def1 but has no arguments and macro-text is evaluated before storing. "Macro-text
is evaluated" means that if macro-text contains other macros, these macros will be expanded,
and the expanded text becomes the macro-text defined by ##set1.
Example:
is equivalent to:
##set1
##set1
.
.
.
##set1
##def1
##set1
xx
yy
123
xx[]
##set1
yy
123
can also be used to redefine macro-name.
x
x
0
#eval[ x[]+1 ]
(see Arithmetic Operations for description of the #eval macro.)
Arithmetic Operations
The built-in macro called #eval[ ] can be used to perform arithmetic, literal, and logical
operations. It can be abbreviated to # [ ].
#eval[ X OP Y ] or #[ X OP Y ]
gives the result X OP Y. The allowed values for X, OP, and Y, and the corresponding result,
are shown in the following table.
X*
number
number
4/23/05
OP **
+ (plus)
- (minus)
Y
number
number
Result
number
number
142
INPUT MACROS
DEFINING BLOCKS OF INPUT
number
number
number
number
number
number
SIN
COS
TAN
SQRT
ABS
ASIN
ACOS
ATAN
INT
LOG10
LOG
literal1
literal1
literal
* (times)
/ (divided by)
min
max
mod
** (power)
OF
OF
OF
OF
OF
OF
OF
OF
OF
OF
OF
// (concatenate)
/// (concatenate)
EQS (=)
number
number
number
number
number
number
number (degrees)
number (degrees)
number (degrees)
number
number
number
number
number
number
number
number
literal2
literal2
literal
literal
NES (≠)
literal
literal
EQSU (=)
literal
literal
NESU (≠)
literal
logical
logical
AND
OR
NOT
EQ (=)
logical
logical
logical
number
number
number
number
number
number
number
number
number
number
number
number
number
number (degrees)
number (degrees)
number
number
number
number
literal "literal1literal2"
literal "literal1 literal2"
logical (true or false)
case sensitive
logical (true or false)
case sensitive
logical (true or false)
not case sensitive
logical (true or false)
not case sensitive
logical (true or false)
logical (true or false)
logical (true or false)
logical (true or false)
logical (true or false)
number
number
logical (true or false)
logical (true or false)
number
number
logical (true or false)
logical (true or false)
number
number
number
number
number
number
NE (≠)
GT (>)
GE (≥)
LT (<)
LE (≤)
* Upper or lower case is allowed for SIN, COS, etc.
** Upper or lower case is allowed for OF, EQS, etc.
Example
#eval[ 1 + 2 ]
when expanded becomes 3.
#eval[ 1 + #eval[2 * 3] ] when expanded becomes 7.
Example
##set1 city[] Washington
DesignDay, #[ city[ ] /// SUMMER ], ! Design Day Name
4/23/05
143
INPUT MACROS
MACRO DEBUGGING AND LISTING CONTROL
gives
DesignDay, "Washington SUMMER", ! Design Day Name
The following example illustrates the use of #eval inside #if commands:
##if #[ city[ ] EQS Chicago ]
##if #[#[ city[ ] EQS Chicago ] and #[ occup[ ] NES low ] ]
Notes:
1. For logical values:
False = 0 or BLANK,
True = any other character
2. A literal must be enclosed inside a pair of double quotes if it contains BLANKs or
reserved characters like [ ] ( ) ,
E.g., "abc *def"
Otherwise, the quotes around the literals are optional.
3. Literal concatenation operators // and /// produce quoted literals.
E.g., # [ large /// office ] gives "large office"
4. Literals are case sensitive.
distinct.
For example, "Chicago", "CHICAGO" and "chicago" are
5. EQS and NES are case sensitive string comparisons.
insensitive string comparisons.
EQSU and NESU are case
6. Literals are limited to 40 characters.
Macro Debugging and Listing Control
##list
Turn on listing; echo of input lines on the OUTPUT file is enabled. This is the default
condition.
##nolist
Turn off listing; echo of input lines on the output file is disabled.
##show
Start printing expanded line on output file. After this command, if a macro expansion was
done, the expanded line is printed on the output file. In this way you can see the end result of
macro expansions, which is the input as seen by the EnergyPlus Input processor.
##noshow
Stop printing expanded line on output file. This is the default condition.
##showdetail
Start printing each macro expansion. After this command, every time a macro expansion is
done the result of the expansion is printed. This can produce lots of output.
##noshowdetail
Stop printing each macro expansion. This is the default condition.
##traceback
4/23/05
144
INPUT MACROS
MACRO DEBUGGING AND LISTING CONTROL
Give full traceback when printing an error message. After this command, if there is a EPMACRO error, a full traceback of the macro expansions in progress is printed. This is the
default condition.
##notraceback
Don't give full traceback when printing an error message.
##write
Start writing expanded text into file 22. This is similar to ##show except that the expanded
lines are written into file 22. Therefore, file 22 will contain only the text that will be seen by
the EnergyPlus processor. This file is used only for debugging purposes. It allows you to see
what the macro-processed input file looks like.
##nowrite
Stop writing expanded text into file 22. This is the default condition.
##symboltable
Prints table of current macro names. All of the macro names that are defined will be printed.
##clear
Clear all macro definitions. All the macro names defined up to this point will be deleted.
##reserve TEXT k
NAMES l
STACK m
Allocates memory.
Reserves
k
words of space in AA array for macro definition storage.
Reserves
l
positions in macro definition names table.
Reserves
m
words of stack space.
If used, the ##reserve command must precede all other macro commands in the EPMACRO input. This command should be used only if one or more of the following error
messages is received:
"Need more memory for storing macro definitions"
Use "##reserve TEXT nnnnnn" command to get more memory. Current value of nnnnnn
is: _ _ _
"Macro table capacity exceeded"
Use "##reserve NAMES nnnnnn" command to get more memory. Current value of nnnnnn
is: _ _ _
"Macro stack overflow"
Use "##reserve STACK nnnnnn" command to get more memory. Current value of nnnnnn
is: _ _ _
##! <comment>
Allows you to enter comment lines inside a macro. <comment>
MACRO echo but is not acted on by the macro processor.
is printed in the EP-
Example:
This example shows the use of the ##set, ##include, ##eval and ##if commands. Let an
external file called cities.idf contain the following text:
##if #[ city[ ] EQS CHICAGO ]
Location,Chicago IL, !- Location Name
4/23/05
145
INPUT MACROS
LISTING FORMAT
41.880, !- Latitude
-87.63, !- Longitude
-6.0,
!- Time Zone
2.;
!- Elevation {m}
##elseif #[ city[ ] EQS WASHINGTON ]
Location,Washington DC, !- Location Name
38.9,
!- Latitude
-77.0, !- Longitude
-5.0,
!- Time Zone
15.;
!- Elevation {m}
##else
ERROR --- City Undefined
##endif
Then the EnergyPlus input
##set1 city[ ] CHICAGO
##include cities.idf
will be converted, after macro processing, to:
Location,Chicago IL, !- Location Name
41.880, !- Latitude
-87.63, !- Longitude
-6.0,
!- Time Zone
2.;
!- Elevation {m}
Listing Format
The format of listing from EP-MACRO gives information about the status of the input macros,
as shown in the following:
1. 1.1
- - -
* 123 * ...... EnergyPlus input line
------- ----------------------------------
| | |
|
echo of EnergyPlus input line
| | |
|
| | |
line number ( if the current line is being skipped
| | |
by " ##if... " etc, this is indicated
| | |
by printing "- 123 -" instead of
| | |
"* 123 *" in the line number field;
| | |
if the current line is part of a
| | |
macro command, it is indicated by
| | |
printing "# 123 #" )
| | |
| | macro expansion nesting level
| |
|"##if" nesting level
|
"##include" nesting level
4/23/05
146
HVAC DIAGRAM
INTRODUCTION
HVAC Diagram
Introduction
The HVAC-Diagram program is a simple utility that can be used to generate a svg file based
on the bnd file generated by EnergyPlus.
It is a stored in the primary
EnergyPlus\PostProcessor folder upon installation.
It creates a series of diagrams for the layout of the HVAC system components. The SVG file
can be viewed with a number of internet browser plug-ins such as produced by Adobe that
can be downloaded at www.adobe.com/svg. To get help within the Adobe viewer, right click
anywhere on the drawing.
Each diagram should be read from left to right, which is the direction of the flow of the fluid
through the components.
The HVAC-Diagram program is automatically called when using EP-Launch but can also be
included in other batch files. To view the drawing in EP-Launch, click on the drawing button.
You can zoom in on this drawing and with the “copy” command, paste a zoomed in portion as
a bitmap in your document.
Figure 16. HVAC Diagram -- SVG Drawing
Objects that are recognized by the HVAC diagram are shown in Table 24 (sorted by Object
Name) and Table 25 (sorted by color).
Table 24. HVAC Diagram Object Names (primary sort) Colors
Object Name
4/23/05
Color
BASEBOARD HEATER:WATER:CONVECTIVE
salmon
BOILER:SIMPLE
indianred
CHILLER:ABSORPTION
powderblue
CHILLER:COMBUSTION TURBINE
powderblue
CHILLER:CONSTCOP
powderblue
147
HVAC DIAGRAM
INTRODUCTION
CHILLER:DIRECT FIRED ABSORPTION
powderblue
CHILLER:ELECTRIC
powderblue
CHILLER:ENGINEDRIVEN
powderblue
COIL:DX:COOLINGBYPASSFACTOREMPIRICAL skyblue
COIL:DX:HEATINGEMPIRICAL
skyblue
COIL:DX:MULTISPEED:COOLINGEMPIRICAL
skyblue
COIL:ELECTRIC:HEATING
salmon
COIL:GAS:HEATING
salmon
COIL:WATER:DETAILEDFLATCOOLING
skyblue
COIL:WATER:SIMPLECOOLING
skyblue
COIL:WATER:SIMPLEHEATING
salmon
COIL:WATERTOAIRHP:COOLING
skyblue
COIL:WATERTOAIRHP:HEATING
salmon
CONNECTION COMPONENT:PLANTLOOP
wheat
CONSTANT FLOW RADIANT SYSTEM
orangered
CONTROLLED ZONE EQUIP CONFIGURATION chartreuse
CONTROLLER:OUTSIDE AIR
4/23/05
none
CONTROLLER:SIMPLE
none
CONTROLLER:STAND ALONE ERV
none
COOLING TOWER:SINGLE SPEED
pink
DESICCANT DEHUMIDIFIER:SOLID
tan
DIRECT AIR
none
DOMESTIC HOT WATER
orange
DUAL DUCT:CONST VOLUME
wheat
DUAL DUCT:VAV
wheat
EVAPCOOLER:DIRECT:CELDEKPAD
aliceblue
EVAPCOOLER:INDIRECT:CELDEKPAD
aliceblue
EVAPCOOLER:INDIRECT:RDDSPECIAL
alicblue
FAN:SIMPLE:CONSTVOLUME
silver
FAN:SIMPLE:ONOFF
silver
FAN:SIMPLE:VARIABLEVOLUME
silver
FREE COOLING HEAT EXCHANGER
paleturquoise
GENERATOR:COMBUSTION TURBINE
orange
GENERATOR:IC ENGINE
orange
GROUND HEAT EXCHANGER:VERTICAL
paleturquoise
HEAT EXCHANGER:AIR TO AIR:FLAT PLATE
paleturquoise
HEAT EXCHANGER:AIR TO AIR:GENERIC
paleturquoise
HEATPUMP:WATERTOWATER COOLING
lightslategray
HEATPUMP:WATERTOWATER HEATING
lightslategray
HUMIDIFIER:STEAM:ELECTRICAL
lavender
HYDRONIC RADIANT SYSTEM
orangered
MIXER
lightgreen
148
HVAC DIAGRAM
INTRODUCTION
OUTSIDE AIR INLET NODE LIST
none
OUTSIDE AIR MIXER
lawngreen
PIPE
wheat
PLANT LOAD PROFILE
none
POND GROUND HEAT EXCHANGER
paleturquoise
PUMP:CONSTANT SPEED
springgreen
PUMP:VARIABLE SPEED
springgreen
PURCHASED AIR
none
PURCHASED:CHILLED WATER
none
PURCHASED:HOT WATER
none
SINGLE DUCT:VAV:NOREHEAT
wheat
SINGLE DUCT:VAV:REHEAT
wheat
SOLAR COLLECTOR:FLAT PLATE
yellow
SPLITTER
wheat
SURFACE GROUND HEAT EXCHANGER
paleturquoise
UNIT VENTILATOR
sandybrown
WATER HEATER:SIMPLE
orange
WATER HEATER:STRATIFIED
orange
ZONE EXHAUST FAN
silver
ZONE MIXER
wheat
ZONE RETURN PLENUM
lightgreen
ZONE SPLITTER
wheat
ZONE SUPPLY PLENUM
lightgreen
Table 25. HVAC Diagram Object Names and Color (primary sort)
Object Name
Color
EVAPCOOLER:INDIRECT:RDDSPECIAL
alicblue
EVAPCOOLER:DIRECT:CELDEKPAD
aliceblue
EVAPCOOLER:INDIRECT:CELDEKPAD
aliceblue
CONTROLLED ZONE EQUIP CONFIGURATION chartreuse
4/23/05
BOILER:SIMPLE
indianred
HUMIDIFIER:STEAM:ELECTRICAL
lavender
OUTSIDE AIR MIXER
lawngreen
MIXER
lightgreen
ZONE RETURN PLENUM
lightgreen
ZONE SUPPLY PLENUM
lightgreen
HEATPUMP:WATERTOWATER COOLING
lightslategray
HEATPUMP:WATERTOWATER HEATING
lightslategray
CONTROLLER:OUTSIDE AIR
none
CONTROLLER:SIMPLE
none
CONTROLLER:STAND ALONE ERV
none
149
HVAC DIAGRAM
INTRODUCTION
DIRECT AIR
none
OUTSIDE AIR INLET NODE LIST
none
PLANT LOAD PROFILE
none
PURCHASED AIR
none
PURCHASED:CHILLED WATER
none
PURCHASED:HOT WATER
none
DOMESTIC HOT WATER
orange
GENERATOR:COMBUSTION TURBINE
orange
GENERATOR:IC ENGINE
orange
WATER HEATER:SIMPLE
orange
WATER HEATER:STRATIFIED
orange
CONSTANT FLOW RADIANT SYSTEM
orangered
HYDRONIC RADIANT SYSTEM
orangered
FREE COOLING HEAT EXCHANGER
paleturquoise
GROUND HEAT EXCHANGER:VERTICAL
paleturquoise
HEAT EXCHANGER:AIR TO AIR:FLAT PLATE
paleturquoise
HEAT EXCHANGER:AIR TO AIR:GENERIC
paleturquoise
POND GROUND HEAT EXCHANGER
paleturquoise
SURFACE GROUND HEAT EXCHANGER
paleturquoise
COOLING TOWER:SINGLE SPEED
pink
CHILLER:ABSORPTION
powderblue
CHILLER:COMBUSTION TURBINE
powderblue
CHILLER:CONSTCOP
powderblue
CHILLER:DIRECT FIRED ABSORPTION
powderblue
CHILLER:ELECTRIC
powderblue
CHILLER:ENGINEDRIVEN
powderblue
BASEBOARD HEATER:WATER:CONVECTIVE
salmon
COIL:ELECTRIC:HEATING
salmon
COIL:GAS:HEATING
salmon
COIL:WATER:SIMPLEHEATING
salmon
COIL:WATERTOAIRHP:HEATING
salmon
UNIT VENTILATOR
sandybrown
FAN:SIMPLE:CONSTVOLUME
silver
FAN:SIMPLE:ONOFF
silver
FAN:SIMPLE:VARIABLEVOLUME
silver
ZONE EXHAUST FAN
silver
COIL:DX:COOLINGBYPASSFACTOREMPIRICAL skyblue
4/23/05
COIL:DX:HEATINGEMPIRICAL
skyblue
COIL:DX:MULTISPEED:COOLINGEMPIRICAL
skyblue
COIL:WATER:DETAILEDFLATCOOLING
skyblue
COIL:WATER:SIMPLECOOLING
skyblue
COIL:WATERTOAIRHP:COOLING
skyblue
150
HVAC DIAGRAM
INTRODUCTION
PUMP:CONSTANT SPEED
4/23/05
springgreen
PUMP:VARIABLE SPEED
springgreen
DESICCANT DEHUMIDIFIER:SOLID
tan
CONNECTION COMPONENT:PLANTLOOP
wheat
DUAL DUCT:CONST VOLUME
wheat
DUAL DUCT:VAV
wheat
PIPE
wheat
SINGLE DUCT:VAV:NOREHEAT
wheat
SINGLE DUCT:VAV:REHEAT
wheat
SPLITTER
wheat
ZONE MIXER
wheat
ZONE SPLITTER
wheat
SOLAR COLLECTOR:FLAT PLATE
yellow
151
COEFFCONV/COEFFCHECK
COEFFCONV
CoeffConv/CoeffCheck
These two programs are stored in the PreProcess folder of your EnergyPlus installation
under a folder CoeffConv.
CoeffConv
CoeffConv is a program to convert DOE-2 temperature dependent curves in Fahrenheit to
EnergyPlus curves in Centigrade. The program converts the Doe-2 coefficients of a
biquadratic curve to the equivalent EPlus biquadratic curve coefficients.
Input is from file CoeffConvInput.txt (status=OLD). There are 6 lines of ascii input.
For example:
VarSpeedCoolCapFt
-0.29382,0.0222213,0.00006988,0.0040928,-0.00000226,-0.00013774
55.,75.
75.,115.
67.0,95.0
5.0
The 1st line is the user selected name of the curve.
The 2nd line contains the 6 biquadratic curve coefficients, comma separated. These are the
Doe-2 coefficients.
The 3rd line contains the min and max values of the 1st independent variable, comma
separated, deg F.
The 4th line contains the min and max values of the 2nd independent variable, comma
separated, deg F.
The 5th line contains the rated values of the 1st & 2nd independent variables, comma
separated, deg F.
The 6th line contains the delta T for the output performance maps.
All the input lines should start in column 1.
The above sequence can be repeated up to 100 times.
The output file is CoeffConvOutput.txt (status=NEW) (that means you need to delete any
existing CoeffConvOutput.txt).
The output file will contain the EnergyPlus idf input for the curve, as well as any error
messages;
Also the Doe-2 and EnergyPlus curve values at the rating point (where the value should be
1.0) and performance maps for the curves - both Doe-2 and EnergyPlus.
There is an example input file and an example output file installed with the program.
CoeffCheck
CoeffCheck is a program to print out a performance map given a bi-quadratic performance
curve.
Input is from file CoeffCheckInput.txt (status=OLD). There are 6 lines of ascii input.
For example:
VarSpeedCoolCapFt
4/23/05
152
COEFFCONV/COEFFCHECK
COEFFCHECK
0.476428E+00,0.401147E-01,0.226411E-03,-0.827136E-03,-0.732240E-05,0.446278E-03
12.777778,23.888889
23.888889,46.111111
19.444444,35.0
2.777778
The 1st line is the user selected name of the curve.
The 2nd line contains the 6 biquadratic curve coefficients, comma separated.
The 3rd line contains the min and max values of the 1st independent variable, comma
separated
The 4th line contains the min and max values of the 2nd independent variable, comma
separated
The 5th line contains the rated values of the 1st & 2nd independent variables, comma
separated
The 6th line contains the delta T for the output performance map
The output file is CoeffCheckOutput.txt (status=NEW).
There is an example input file and an example output file installed with the program.
4/23/05
153
EXPANDOBJECTS
INTRODUCTION
ExpandObjects
Introduction
The ExpandObjects program is a preprocessor that is currently used with the CompactHVAC
objects. The preprocessor reads an in.idf file and generates an expanded.idf file. The in.idf
file contains objects that will be read by the preprocessor and those that are ignored by the
preprocessor. The objects read can be either commented out or left as is. The objects
created by the preprocessor in the expanded.idf file should require no further preprocessing.
The preprocessor does not read the Energy+.IDD and does limited validation. Most of the
object values that are created are “passed” through from input objects. This allows
EnergyPlus to provide most of the validation. If errors are found the expandedidf.err file is
created. In the EPL-RUN.BAT file the expanded.idf file is renamed to the original file name
with the extension expidf.
The objects that are currently read by the ExpandObjects preprocessor are:
•
COMPACT HVAC:THERMOSTAT
•
COMPACT HVAC:ZONE:VAV
•
COMPACT HVAC:SYSTEM:UNITARY
•
COMPACT HVAC:ZONE:UNITARY
•
COMPACT HVAC:SYSTEM:VAV'
•
COMPACT HVAC:ZONE:PURCHASED AIR
•
COMPACT HVAC:PLANT:CHILLED WATER LOOP
•
COMPACT HVAC:PLANT:CHILLER
•
COMPACT HVAC:PLANT:TOWER
•
COMPACT HVAC:PLANT:HOT WATER LOOP
•
COMPACT HVAC:PLANT:BOILER'
The objects created by ExpandObjects include:
4/23/05
•
AIR DISTRIBUTION UNIT
•
AIR LOOP EQUIPMENT LIST
•
AIR PRIMARY LOOP
•
BOILER:SIMPLE
•
BRANCH
•
BRANCH LIST
•
CHILLER:ELECTRIC:EIR
•
COIL:DX:CoolingBypassFactorEmpirical
•
COIL:Electric:Heating
•
COIL:Gas:Heating
•
COIL:Water:Cooling
•
COIL:Water:SimpleHeating
154
EXPANDOBJECTS
4/23/05
INTRODUCTION
•
CONDENSER LOOP
•
CONDENSER OPERATION SCHEMES
•
CONNECTOR LIST
•
CONTROLLED ZONE EQUIP CONFIGURATION
•
CONTROLLER LIST
•
CONTROLLER:OUTSIDE AIR
•
CONTROLLER:SIMPLE
•
COOLING LOAD RANGE BASED OPERATION
•
COOLING TOWER:SINGLE SPEED
•
COOLING TOWER:TWO SPEED
•
CURVE:BIQUADRATIC
•
CURVE:CUBIC
•
CURVE:QUADRATIC
•
DIRECT AIR
•
DUAL SETPOINT WITH DEADBAND
•
FAN:SIMPLE:CONSTVOLUME
•
FAN:SIMPLE:ONOFF
•
FAN:SIMPLE:VariableVolume
•
FURNACE:BLOWTHRU:HEATCOOL
•
FURNACE:BLOWTHRU:HEATONLY
•
HEATING LOAD RANGE BASED OPERATION
•
MIXER
•
NODE LIST
•
OUTSIDE AIR INLET NODE LIST
•
OUTSIDE AIR MIXER
•
OUTSIDE AIR SYSTEM
•
PIPE
•
PLANT EQUIPMENT LIST
•
PLANT LOOP
•
PLANT OPERATION SCHEMES
•
PLANT SIZING
•
PUMP:CONSTANT SPEED
•
PUMP:VARIABLE SPEED
•
PURCHASED AIR
•
PURCHASED:CHILLED WATER
155
EXPANDOBJECTS
4/23/05
INTRODUCTION
•
PURCHASED:HOT WATER
•
SET POINT MANAGER:MIXED AIR
•
SET POINT MANAGER:SCHEDULED
•
SET POINT MANAGER:SINGLE ZONE REHEAT
•
SINGLE DUCT:VAV:NOREHEAT
•
SINGLE DUCT:VAV:REHEAT
•
SPLITTER
•
SYSTEM AVAILABILITY MANAGER LIST
•
SYSTEM AVAILABILITY MANAGER:SCHEDULED
•
SYSTEM SIZING
•
ZONE CONTROL:THERMOSTATIC
•
ZONE EQUIPMENT LIST
•
ZONE MIXER
•
ZONE RETURN AIR PATH
•
ZONE RETURN PLENUM
•
ZONE SIZING
•
ZONE SPLITTER
•
ZONE SUPPLY AIR PATH
•
ZONE SUPPLY PLENUM
156
CSVPROC
INTRODUCTION
CSVproc
This simple post processing utility may be useful when doing parametric analyses. It takes a
CSV (comma separated values file) and performs some simple statistics. It is a very small
application with no interface. In a batch file or on the command line type:
CVSproc <filename>
Where <filename> is the name of a CSV file. It performs some simple statistics on each
column and creates a new file with the same name without extension and -PROC.CSV added
to the name.
The statistics performed on each column are:
4/23/05
•
SUM
•
MAX
•
MIN
•
AVERAGE
•
COUNT
•
COUNTIF > 0
•
COUNTIF > 5
•
COUNTIF > 10
•
COUNTIF > 15
•
COUNTIF > 20
•
COUNTIF > 25
•
COUNTIF > 30
•
COUNTIF > 35
•
COUNTIF > 40
•
COUNTIF > 45
•
COUNTIF > 50
•
COUNTIF > 55
•
COUNTIF > 60
•
COUNTIF > 65
•
COUNTIF > 70
•
COUNTIF > 75
•
COUNTIF > 80
•
COUNTIF > 85
•
COUNTIF > 90
157
CSVPROC
INTRODUCTION
•
COUNTIF > 95
•
COUNTIF > 100
•
COUNTIF = 1
•
COUNTIF < 19.9
•
COUNTIF > 24.0
These statistics are put into another CSV file with the name -PROC.csv. Obviously, not all
statistics are relevant for every output report variable. The average is based on the sum
divided by the number of non-blank rows. The average is not based on the length of time for
that timestep. Due to this, CSVproc is best suited for an hourly output file.
Source code is available upon request from [email protected].
4/23/05
158