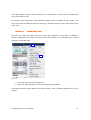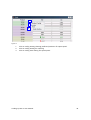
1
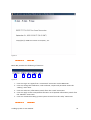
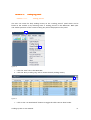
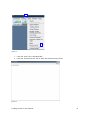
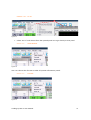
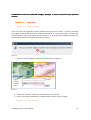
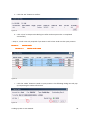
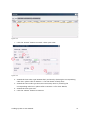
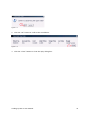
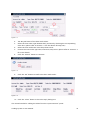
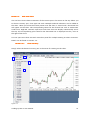
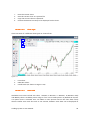
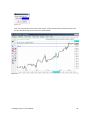
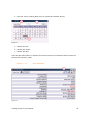
2. Click the “Chart” tab to open the Real-time chart.
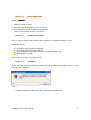
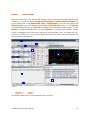
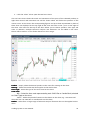
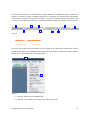
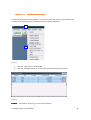
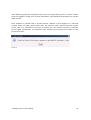
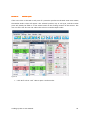
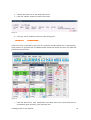
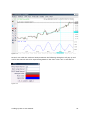
The real-time chart shows the trend and movement of the price of the selected product, A
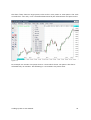
light-blue vertical and horizontal line will be shown which will follow the position of the
mouse cursor on the chart, the corresponding figures and price level represented by both of
these lines are displayed on the top right of the chart and also on the y-axis on the right of
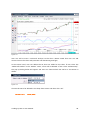
the chart. The menu on the top of the chart allows you to choose product, chart type and
scale. In addition, multiple technical analyses and indicators can be added to the chart.
Please refer to Section 10 for further details on chart usage.
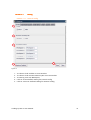
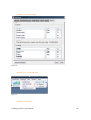
Figure 24
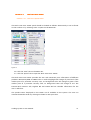
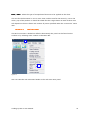
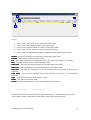
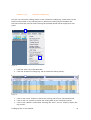
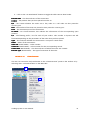
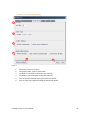
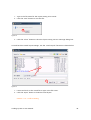
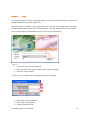
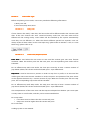
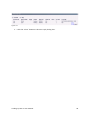
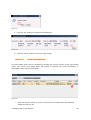
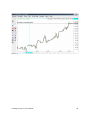
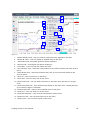
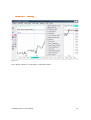
Product – Simply select the desired product in the menu for viewing on the chart.
Settings
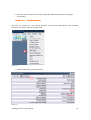
Settings – Select the Look & Feel that applies to the whole chart.
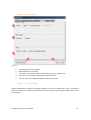
Chart Type – Select the type of line to be used on the chart.
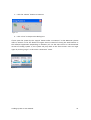
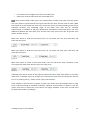
Time Scale:
Min – Select the time scale represented by each OHLC Bar or Candle Stick (selected
on Chart Type) on the chart.
Points – Select the period of interest to be shown on the chart (e.g. 100 Points will
show the last 100 OHLC Bar or Candle Stick on the chart).
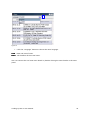
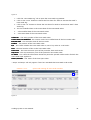
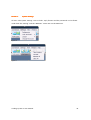
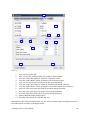
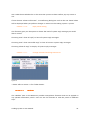
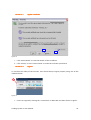
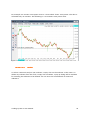
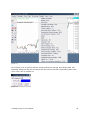
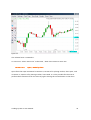
Studies – Select from a large range of technical analysis functions that can be applied on the
chart.
Trading System 2 User Manual
22