1
N PS ARCHIVE
1997
GAHAGAN,
S.
NAVAL POSTGRADUATE SCHOOL
Monterey, California
THESIS
PRESSURE-SENSITIVE PAINT MEASUREMENTS ON A
ROTOR DISK SURFACE AT HIGH SPEEDS
by
Shane G. Gahagan
June, 1997
Thesis Advisor:
Thesis
G126
Approved
Raymond
for public release; distribution
is
P.
Shreeve
unlimited.
DUDLEV KNOX LIBRARY
'GRADUATE SCHOOL
NAV
MC
01
REPORT DOCUMENTATION PAGE
Public reporting burden for this collection of information
estimated to average
Form Approved
OMB No.
0704-0188
hour per response, including the time for reviewing instruction,
searching existing data sources, gathering and maintaining the data needed, and completing and reviewing the collection of information. Send
comments regarding this burden estimate or any other aspect of this collection of information, including suggestions for reducing this burden, to
Washington headquarters Services, Directorate for Information Operations and Reports, 1215 Jefferson Davis Highway, Suite 1204, Arlington, VA
22202-4302, and
to the Office of
AGENCY USE ONLY
1.
is
1
Management and Budget, Paperwork Reduction
(Leave blank)
Project (0704-0188) Washington
REPORT DATE
2.
3.
June 1997
TITLE
4.
DC
20503.
REPORT TYPE AND DATES COVERED
Master's Thesis
AND SUBTITLE
5.
FUNDING NUMBERS
PRESSURE-SENSITIVE PAINT MEASUREMENTS ON A ROTOR DISK SURFACE
AT HIGH SPEEDS
AUTHOR(S)
6.
Gahagan, Shane G.
7.
PERFORMING
ORGANIZATION REPORT
8.
PERFORMING ORGANIZATION NAME(S) AND ADDRESS(ES)
Naval Postgraduate School
Monterey, CA 93943-5000
9.
NUMBER
SPONSORING MONITORING AGENCY NAME(S) AND ADDRESS(ES)
10.
/
SPONSORING
/
MONITORING
AGENCY REPORT NUMBER
11.
SUPPLEMENTARY NOTES
The views expressed in this thesis are those of the author and do not
Defense or the U.S. Government.
12a.
of the Department of
12b.
DISTRIBUTION CODE
DISTRIBUTION / AVAILABILITY STATEMENT
Approved
13.
reflect the official policy or position
for public release; distribution unlimited.
ABSTRACT (maximum 200 words)
Measurement of the
paint (PSP).
A
was attempted using pressure-sensitive
and operated at speeds in
once-per-revolution trigger signal was converted to a
static-pressure distribution over the surface of a rotor disk
uniform-stress, high-speed rotor disk, fitted with a shock generator,
was
built, installed
fuel pump. A
(TTL) format and used to gate an intensified charged-coupled device (CCD) video camera. Multiple
low-intensity-level camera exposures were integrated and captured to produce a single usable image. Ten captured images were
averaged to increase the image's signal-to-noise ratio and the result was used to produce an image ratio with respect to a static
reference condition.
Finally, a pseudo-coloring process was used to develop a color image that related intensities to both
temperature and pressure distributions in accordance with the Stern- Volmer relation. Paint stripping and temperature dependence
prevented the measurement of pressure at transonic speeds. The test-bed facility and acquisition techniques developed here could
now be used to overcome those limitations.
excess of 20,000
RPM by a Hamilton-Standard turbine-driven
transistor-to-transistor logic
14.
SUBJECT TERMS
NUMBER OF
PAGES
15.
Pressure-Sensitive Paint, PSP, Rotor Measurements
,
Photoluminescence, Imaging
61
17.
SECURITY CLASSIFICATION
OF REPORT
Unclassified
NSN
7540-01-280-5500
18.
SECURITY CLASSIFICATION OF
THIS
PAGE
Unclassified
19.
SECURITY CLASSIFI- CATION
OF ABSTRACT
Unclassified
16.
PRICE CODE
20.
LIMITATION
OF ABSTRACT
UL
Standard Form 298 (Rev. 2-89)
Prescribed by ANSI Std. 239-18
11
Approved
for public release; distribution
is
unlimited
PRESSURE-SENSITIVE PAINT MEASUREMENTS ON A ROTOR DISK
SURFACE AT HIGH SPEEDS
Shane G. Qahagan
Lieutenant
Commander, United
States
Navy
B.S., North Carolina State University 1986
Submitted in
partial fulfillment
of the
requirements for the degree of
MASTER OF SCIENCE
IN
AERONAUTICAL ENGINEERING
from the
NAVAL POSTGRADUATE SCHOOL
June 1997
DUDl EY KNOX LIBRARY
fTGRADUATE SCHOOL
N;.
Measurement of the
was attempted using
disk, fitted
20,000
trigger signal
by a Hamilton-Standard turbine-driven
was used
to
Volmer
at
A
speeds in excess of
once-per-revolution
(TTL) format and used
ratio
to
to
low-intensity-
produce a single usable image.
image's signal-to-noise ratio and the
with respect to a
was used
to
static reference condition.
develop a color image that related
both temperature and pressure distributions in accordance with the Stem-
relation.
of pressure
of a rotor disk
(CCD) video camera. Multiple
to increase the
produce an image
Finally, a pseudo-coloring process
intensities to
pump.
to a transistor-to-transistor logic
Ten captured images were averaged
result
fuel
camera exposures were integrated and captured
^^
uniform-stress, high-speed rotor
and operated
built, installed
gate an intensified charged-coupled device
level
A
pressure-sensitive paint (PSP).
was converted
'
static-pressure distribution over the surface
with a shock generator, was
RPM
CA
MC
ABSTRACT
at
Paint stripping and temperature dependence prevented the measurement
transonic
developed here could
speeds.
The
test-bed
facility
now be used to overcome those
and acquisition techniques
limitations.
VI
TABLE OF CONTENTS
I.
INTRODUCTION
1
II.
THEORY OF PRESSURE-SENSITIVE PAINT
3
III.
PSP
IV.
V.
VI.
MEASUREMENT APPARATUS
5
A.
ROTOR DISK
5
B.
TURBINE-DRIVEN FUEL PUMP
8
C.
IMAGE CAPTURE AND PROCESSING ASSEMBLY
9
1.
Rotor Illumination System
2.
Camera System
10
3.
Once-per-Revolution Trigger
13
4.
Imaging System
13
EXPERIMENTAL PROGRAM
15
9
A.
PROCEDURES
15
B.
PROGRAM OF TESTS
18
RESULTS AND DISCUSSION
19
CONCLUSIONS AND RECOMMENDATIONS
31
APPENDIX A: PSP SCRIPTS
33
APPENDEK B: PSP SETUP AND PROCEDURES
39
LIST OF
REFERENCES
49
INITIAL DISTRIBUTION LIST
51
vn
Vlll
I.
INTRODUCTION
Recent developments in the use of luminescent coatings on turbomachinery
blading as a means for measuring spatial distributions of blade surface pressure and
temperature has generated significant
interest.
Current methods for obtaining surface
pressure measurements require the installation of individual pressure ports along each
aerodynamic surface. Although highly accurate, the information
is
is
spatially discrete
and
usually not cost effective for rotor blade analysis (due to the complex array of pressure
lines that
must be
installed
Pressure-sensitive
paints
and led out of a "pressure-instrumented" model) [Refs. 1-10].
(PSP);
however, offer a conceptually simple means
determining continuous blade surface pressure distributions. Such information
in the validation
(CFD)
of new rotor designs
that are
for
is critical
based on computational fluid dynamic
calculations.
Originally applied to high pressure gradient external flows (supersonic and
transonic), the
wide application of PSP's
as a quantitative
measurement tool has been
slowed as a result of the strong/moderate temperature dependence of the active probe
molecule and associated chemical binder.
PSP's temperature dependencies have been
cited as the reason for errors in measuring correct surface pressure
conventional pressure taps and probe measurements.
when compared with
Attempts to calibrate these
temperature effects and to incorporate the results to produce comparable surface pressure
measurements with conventional methods
is
the subject of on-going research.
The present study continues
the
the
Naval Postgraduate School (NPS)
quantitative, temperature-corrected,
on high-speed
rotors [Refs. 1-3].
to
installed,
and operated
The PSP
in the area
where
built
by Varner
[Ref. 2]
and further
12-inch diameter, aluminum, uniform-stress,
speeds (>20,000
RPM). PSP was
built,
applied locally
a result of the generation of
Images, measuring local luminescent intensities, were
exist.
EPIX 4MIP
PSP was
over the
bed
significant surface pressure gradients, as
shock waves, would
captured using
A
test
surface pressure distributions
shock generators inserted near the rim was designed,
at transonic tip
at
develop the means and capability to produce
PSP measurements of
developed by Quinn [Ref. 3] was used.
rotor disk, with small
work done by Sievwright, Vamer, and Quinn
frame-grabber software.
The image
intensity distribution
then interpreted to determine variations in surface pressure and surface
temperature using the Stern- Volmer relationship.
The following section
sensitive paints
Section
III
gives a brief description of the image acquisition systems developed to capture
VI discusses
analysis.
and application of pressure
and the governing relationships between pressure and luminescence.
pressure distribution images.
V and
briefly describes the concept
Section IV describes the
test
methodology, while Sections
the results and conclusions and provide recommendations for further
II.
PSP
THEORY OF PRESSURE-SENSITIVE PAINT
uses a photoluminescence and oxygen-quenching process by which the
molecular energy state of an active molecule, excited by radiation from
state,
S
,
to a higher energy state, S,
A
naturally occurring processes.
(10
9
-
10" 12 sees) converts the
then returned to
ground
its
Oxygen quenching
process.
the result
molecule
of oxygen in
to its lowest excited state, S,.
The molecule
(collisions) with an
is
diffused in a
amount of emitted
radiation [Ref.
air is 0.21, as the air pressure
oxygen molecules are diffused and
PSP
interact
1
oxygen molecule. As a
paint layer
and
1
1].
is
or via a radiationless
light,
one radiationless process in which the transfer of energy
of oxygen that
proportional to the
through a series of
2), returns to its original state
through the emission of
of molecular interactions
partial pressure
>
ground energy
molecular internal conversion process instantaneously
state
is
(I
its
medium
is
is
result, the
inversely
Since the mole fraction
over the paint surface
is
increased,
more
with the PSP, resulting in increased oxygen
quenching and less radiation emittance from the PSP. The oxygen-quenching process has
been modelled by the Stern- Volmer
relation,
= A(T) + B(T)£
(1)
!f
where
and P
I
respectively,
conditions.
and
The
are
I
at
coefficients
ambient
reference
luminescent
and P are measured
temperature dependent.
measured
the
A
and
B
intensity
intensity
and reference pressure,
and pressure
at
the experimental
are derived from calibration data and generally are
In the present study, the reference intensity and pressures were
static
conditions (e.g. wind-off) and experimental conditions (wind-
on) were measured using a phase-locked acquisition technique
The PSP used
in the present
The
active
molecule was
photoluminescence occurred
at
various rotor speeds.
work was composed of Platinum Octaethyl Porphyrin
(PtEOP) as the active molecule dissolved
10].
at
in an
excited
at
oxygen-permeable binder, GP-197
an
absorption
650 nm, corresponding
respectively, in the visible light spectrum.
[Ref.
peak of 380nm and
to the colors
of violet and
red,
III.
A PSP
MEASUREMENT APPARATUS
PSP
test-bed
facility
at
the Naval Postgraduate
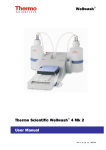
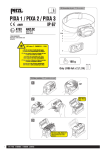
A
Laboratory was used for the present study.
acquisition system
drive for a fuel
is
shown
pump was
in
Figure
1
Oriel
hardware and software devices required
facility
by
RPM
and PSP test-bed
a shock generator
test-bed facility
set up.
counter,
CCD
camera, camera control unit
frame-grabber
to capture
Varner and Quinn [Refs. 2 and
speeds.
aluminium rotor disk mounted on a turbine
EPIX
system,
illumination
pressure event generated
schematic of the facility and image-
enclosed in an open-ended cylindrical steel spin chamber. The
image acquisition system consisted of a
(CCU),
An
.
School's Gas Dynamics
on
software,
and
associated
and store "freeze frame" images of a
the rim of a disk
moving
at
3] provided detailed descriptions
The following provides a
supersonic
of the
brief description of the
test
PSP
components and the modifications made during the course of the present
work.
A.
ROTOR DISK
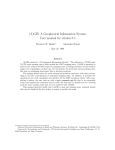
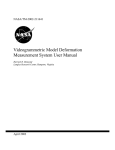
A
machined
12-inch diameter, aluminium, rotor disk, designed for uniform stress and
at
NPS, was used
as the
disk dimensions and Figure 3
shaft.
High
PSP
shows the
centrifugal stress loading
rotor's tapered profile.
Two
experimental platform. Figure 2 shows the rotor
rotor as
was
it
was mounted on
the prime design consideration and led to the
Vi-inch stainless steel Allen set screws
set 180° apart at a radial distance
the turbine-driven
were machined and
of 5.8 inches from the rotor center.
The
set screws,
extended 3/32 inches above the rotor face, were intended to act as shock generators
at
XYBION ISG 350
650 nm
Hamilton-Standard
Fuel
Pump
oriel
rjCD Camera
filter
Turbine
ipurpose
i
,H»>.v
WaveTech Function Generator
-Off Waveform)
3CD Photodiode
28V Rev Bias Input
PIN
oB
"l
y^ N^
o o o
-^m
28 v Dc
Power
Camera Control Unit (CCU)
*©"
i
Op-Amp
Waveshaper
©
Hiil
O
-•
Out
° °+9 VD# O O
In
• 0{lOO
20:1
BCD Counter
5V DC
Power
"7"\
®li
M
+=
H
-0]
G ate
'
"o
o
©
+5 VB(
Logic
^©
_
OUT
CLOCK
OUT
.&
to EXT TRIGGER
o
Voltage
VIDEO
o-
©
to IMAGE INHIBIT
>
Monostable Pulse Gate
Divider / Inverter
O
o o o
©
B
WaveTech Function Generator
••--.
(Camera Trigger)
5V DC
Power
i
]
RED
IN
GRN IN
BLUIN
<
to
£
©
©
1
/REV
Trigger
Amplified
©
®
©
9V
SONY
Active
1
^
120 MHz 586 PC
Trinitron
EXT
to
IN
VIDEO
IN
«to PIXEL CLOCK
'14.318 MHZ)
Video Monitor
/REV Trigger
Low
1
/REV
5VHighTTL 1/REV
5V
0©
Trigger Pulse
5V Active
High Monostable Pulses
5V Low TTL
Signal
Figure
Source: Quinn, K.
J.,
1.
Image Acquisition System
"Pressure-Sensitive Paint
Measurement Technique Development
for
Turbomachinery Application," M.S. Thesis, Naval Postgraduate School, Monterey, California.
6
NOTE.
1
'.
Kflpruo
1-
np
n,2 S
rrci-
(TV-)
5~.
'I
\
x
J
Figure
Figure
3.
2.
5"«/?
RH?
.00 R«p
L
8oR.£ C
.(
$ p><p
_
_
P/fl
Rotor Disk Dimensions
Rotor Mounted on Turbine Driven Fuel
Pump
supersonic rotor speeds.
rotor center.
other
was
One
hole
Two
was
1/8-inch holes
were located 5.8 inches
used, with an optical system, as a
The
partially filled with a non-transparent epoxy.
radially
from the
RPM pick-up point, and the
rotor assembly (turbine-drive
and rotor disk) was dynamically balanced as a single unit before experimental runs
in the
transonic region were attempted.
TURBINE-DRIVEN FUEL PUMP
B.
The
rotor
was driven by
TPC-13, mounted and enclosed
was used
the turbine
in the spin
to operate the turbine.
An 8000
chamber.
However, only 10-20
psi air
turbine at speeds in excess of 25,000 rpm. [Ref. 11].
provided by a
Brown and Sharpe
oil
pump
heat exchanger before flowing into the reservoir.
4.
The temperature of the
pump, Model
300
psi air supply
was needed
to operate the
cu.
ft.,
Turbine bearing lubrication was
providing 40 psi gauge pressure, with the
returned to the reservoir via a separate scavenge pump.
Figure
fuel
of a Hamilton-Standard
oil exiting
The
from the
Scavenged
oil
was cooled
lubrication system
turbine,
pump
are given in Reference
1 1
via a
shown
in
an indication of the turbine
bearing operating temperature, was monitored throughout the run cycle.
fuel
is
oil
Details of the
Figure
C.
4.
Lubrication System
IMAGE CAPTURE AND PROCESSING ASSEMBLY
1.
Rotor Illumination System
The
the spin
rotor
was illuminated through an open hole
in the center
of the cover plate of
chamber using an Oriel 1000- Watt quartz tungsten-halogen lamp, Model 66187
with a P/0.7 condensing lens assembly [Ref.
13].
The lamp was
gel and interference filters (#66228 and #575, respectively)
with the wavelength centered
at
380nm.
voltage via an Oriel lamp controller,
118% of
line voltage to
fitted
with an Oriel blue-
which provided illumination
The lamp was supplied with
Model 6405-M. The
control voltage
variable
AC
was adjusted
to
ensure ample illumination uniformly across the disk surface.
Control voltage to the lamp was turned off between image capture periods to preserve the
luminescent characteristics of the PSP. The lamp and camera set up are shown in Figure
5.
Camera access was through a
Figure
2.
5.
separate hole in the cover plate.
Camera, Lamp, and Rotor Disk Housing
Camera System
Rotor disk images were acquired using a Xybion ISG-350, externally
triggered and gated
used
to
control
CCD
the
camera.
camera's
multipurpose connector [Ref.
television lens
14].
A
remote Xybion Camera Control Unit (CCU) was
and gating functions through a 23-pin
triggering
The camera was
and an Oriel interference
#53590
filter
response to the desired 650 run wavelength. The
up on the spin chamber are shown in Figure
5.
10
fitted
PSP
with a
75mm,
to limit the
fl.4
Cosmicar™
camera's spectral
illumination system and camera set
A timing diagram
for the
camera control
is
shown
in Figure 6.
A
5-volt external trigger pulse (D)
exposure while the range gate function of the
The exposure period was
the captured
varied, depending
image was focused.
CCU
on the
signal.
to trigger
camera
determined the length of exposure.
rotor disk
RPM, and was
set so that
Multiple exposures were obtained to form a single
image through the use of an externally applied image
(TTL) low
was used
The image-inhibit TTL high-low
inhibit transistor-transistor logic
transition allowed the integrated
exposures to be captured as a single image. Similar to the procedure for setting exposure
duration times, image-inhibit signal periods were based on the rotor disk
and
intensifier gain
were controlled manually from the CCU.
11
RPM. Camera
A.
300
B.
4V
mV
1
/REV
Trigger
AfAjUAXAXU
Amplified 1/REV
Trigger
C.
9 V Active
D.
5VHighTTL 1/REV
E.
5V
F.
Signal
Low 1/REV
Trigger Pulse
5V
Active High
Monostable Pulse
G.
Image Inhibit 5V Active
High Monostable Pulse
H.
5V Low TTL
Signal
Figure
Source: Quinn, K.
J.,
J
6.
Image Capture Timing Sequence
"Pressure-Sensitive Paint
Measurement Technique Development
for
Turbomachinery Application," M.S. Thesis, Naval Postgraduate School, Monterey, California.
12
Once-Per-Revolution Trigger
3.
The image
trigger
illuminating a photodiode.
triggered a
+50
was supplied by a
millivolt pulse that
was amplified and converter
to 5 volt
TTL
active-low
2].
Imaging System
A
camera
(LED)
The photodiode when illuminated (once-per-revolution)
format required by the imaging circuitry [Ref.
4.
diode
light-emitting
high-low transition of the 5 volt
intensifier
and image the rotor disk PSP
only during periods
when
captured to a single image
TTL
area.
the image-inhibit function
when
signal
was used
expose the
to
Multiple exposures were integrated
was
activated (+5
VDC)
the function transitioned from high to low.
and were
Activation
and duration of the image-inhibit function was controlled by a Wavetek function
generator and separate resistor-capacitor (RC) time constants respectively [Ref.
Additionally, the duration of the camera exposure
was
set using the
2].
CCU. An exposure
time of 500 nanoseconds was required to adequately focus and freeze the moving image.
A
trial-and-error procedure
different
to adjust the intensity
wheel speeds. As the exposure time required
integration periods
captured using an
V3.2 software
scripts
was used
were required to be
EPIX
4MEG Video
installed in a
were developed so
set
for focusing
at
was decreased, longer
using the image-inhibit function. Images were
Model 12
120MHz Pentium
that the
of the captured image
integrated circuit board and
EPIX 4MEP
personal computer [Ref. 15].
Software
image acquisition was completed autonomously. Ten
13
images were captured each for wind-off, wind-on, and dark-current image. These images
were then processed by taking the
ratio
between them
14
to
develop a single image.
IV.
A.
EXPERIMENTAL PROGRAM
PROCEDURES
The PSP
test
methodology was similar
to that discussed in references
1
and
order to produce significant static pressure variations on the plate surface, tip
numbers of the order of 0.9 (1015.2
ft/sec)
and above were required.
surrounding the shock generator was painted with an
interior/exterior
Krylon
paint.
PSP was
initial
0.
1
In
Mach
The rim
area
coating of glossy white
air-bushed onto the surface after the Krylon paint
had dried. Subsequently, experimental runs with PSP only applied to the rotor disk were
also
attempted.
applications
Figure 7 shows the painted areas of the rotor disk.
were done with the rotor
Figure
7.
installed
on the
turbine. This procedure reduced the
Rotor Disk Paint Area
15
Both paint
PSP degradation that results from exposure
set
up were used to ensure
repeatability.
to
room
light.
Floor markings for the camera
Minor adjustments of the camera position were
used to center the shock generator in the image. The camera focal adjustments were used
to
optimize the image clarity [Ref. 14].
Camera
gate durations were set to optimize the image focus and then the image-
time was adjusted to maintain adequate image intensity. Since rotor wheel
inhibit signal
speed was maintained
to
Hz, gate duration time was calculated
at +/- 1
approximately .007 inches in order to prevent blurred images [Ref.
to limit rotor travel
2].
Table
1
shows
the gate duration times used for the reported run conditions.
RPM
Mach#
Image
Frequency
Rotor
(Hz)
Speed
Signal
(ft/sec)
(sees)
Inhibit
Number of
Gate
Exposures
Duration
(nsecs)
20,000
333
1047.20
0.93
8.0
2663
560
23,400
390
1225.22
1.08
12.8
4992
470
Table
1.
Gate Duration Times for Rotor Travel of .007 inches
Since gate duration times could not be
used
to
focus.
set exactly, a trial-and-error
procedure was
vary the image-inhibit and gate-duration times to optimize image intensity and
Table
durations,
1
shows the length of the image-inhibit
signal used with
two
and the corresponding number of integrated exposures necessary
usable image.
16
different gate
to
produce a
An image
wheel
to
acquisition script
be operated remotely
was
written with a "time delay" included to allow the
was
after execution
triggered at the keyboard.
developed for image acquisition are given in Appendix A.
captured, averaged, and saved as a
images.
TIFF
Wind-off images were captured
file,
after
the process
The
scripts
After wind-on images were
was repeated
for wind-off
wind-on images were obtained
in
an
attempt to ensure that the surface temperature of the rotor was as near as possible to those
during the wind-on
current images
tests.
To remove
the thermal noise generated
by the camera, dark
were obtained and subtracted from both the wind-on and wind-off images.
The two images were
first
aligned and then the ratio (wind-off7wind-on)
and multiplied by a scaling factor
to
produce a
final
image corresponding
side of the Stern- Volmer relation (IJl). This final 0-255 grey-scale
was computed
to the left
hand
image represented
inverse pressure ratio of wind-on to wind-off in accordance with equation (1).
the
A
histogram showing frequency of individual pixel intensity values was inspected in order
to select the range
of minimum intensity
The pseudo-coloring technique
final
to
maximum
intensity for further processing.
reported by Seivweight [Ref.
1]
was applied
to obtain the
image.
Appendix
B
details the
methodology developed
17
for the
PSP
set
up and procedure.
B.
PROGRAM OF TESTS
In previous studies, rotational speeds
by
rotational stresses
new high-speed
rotor
and lubrication [Ref.
was intended
to
were limited by available power
3].
[Ref. 2] or
In the present study, the construction of a
extend the
test capability to
After mounting the rotor to the drive turbine, which
was
30,000
RPM.
fitted to
the shaft with
dowels, the unit was dynamically balanced, installed in the spin chamber, and operated
progressively increased speeds.
3], rotational
pump was
oil
Using the lubrication system described by Quinn
speeds were found to be limited to about 20,000
RPM. When
at
[Ref.
the hydraulic
replaced with a combination lubrication-supply and scavenge-pump system,
temperatures again reached 175° F after minutes of operation.
supplied) heat-exchanger
was
installed in the oil return line
A shell-and-tube (water
and was found
to keep oil
temperatures steady below 135° F.
In order to extend testing above 20,000
move
modified so that the operator could
operate the drive turbine.
rotor speeds.
section.
A
series
Results for 23,400
of
tests
RPM
RPM,
the acquisition software
to a protected control
room and remotely
was then conducted using PSP
are described
Higher speeds were not attempted when
not withstand supersonic tip speeds, and that the
18
it
and discussed
was found
was
at increasing
in the following
that the present paint could
RPM indication was lost.
RESULTS AND DISCUSSION
V.
The
rotor disk configuration for each in a series of four tests
Complete images were acquired successfully
above
Mach
generator.
1.0,
intensity could
1.
In
Run
shown
in
Table
2.
speeds
2, at rotor tip
paint stripping occurred in the local area surrounding the shock
In an attempt to prevent the paint from
to the rotor disk
without the Krylon undercoat.
coming
off, in
While the
test
Run
3
PSP was
showed
applied
that sufficient
be accumulated without using the Krylon, the PSP again came off around
the shock generator.
before applying
runs over
Run
in
is
PSP
Mach
1 .0,
Increasing blade surface roughness using a bead-blasting technique
only,
was attempted
in
Run
4.
In
Run
4, as well in all
experimental
a loss of paint occurred in the local area surrounding the shock
generator.
RUN
RPM
PAINT
ROTOR SURFACE
1
20,000
Krylon + PSP
Smooth
2
23,400
Krylon + PSP
Smooth
3
23,400
PSP
Smooth
4
23,400
PSP
Rough
Table
2.
Rotor Disk Configuration
19
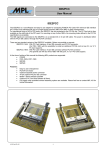
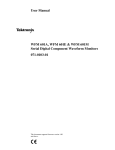
Pseudo-colored images of the intensity ratio
in Figures
1 1
.
8-10,
(I</I)
Runs
1
through 3 are shown
A grey-scale wind-off image of Run 2 is shown in Figure
respectively.
Figure 12 shows a grey-scale wind-off image of Run
The pseudo-colored image of the
8, clearly
for
shows a non-uniform
4.
intensity ratio (Iq/I) for
intensity distribution varying
Run
1,
shown
from red (lowest intensity
A
ratio/lowest pressure) to blue (highest intensity ratio/highest pressure).
showing the frequency (number of pixels)
by a
factor of
50
shown
vs. pixel
in Figure 13. Pixel value plots for a horizontal
multiplied
line
10 pixels above and below the set-screw are
shown
respectively. In a two-dimensional uniform flow, at a speed
=
0.9), a
shock would occur just behind the
the airflow velocity
number
conditions.
is
first
The
maximum
in
of 1047
Figures
ft/sec
14 and
15,
(Mach number
diameter of the shock generator as
Mach
increased to supersonic then decreased to subsonic
resultant intensity distribution in Figure 8, if interpreted to
represent the surface pressure distribution
for transonic
histogram
value (intensity) of the image ratio
(I(/I)
is
in Figure
is
not consistent with what would be expected
The
flow over the shock generator.
should show a low-high variation across a shock.
[Ref. 2] discusses the viscous
pumping
effect
along the centerline axis and
pumped
radially
plotted intensity ratio distribution
No
such transition
is
evident.
of a rotating disk in which
air is
Varner
sucked
outward along the surface of the
Qualitatively, with respect to Figure 8, stagnation
from the pumping
effect
disk.
would not be
consistent with the red-yellow areas (indicating lower pressure) along the inner portion of
the shock generator.
However, since a portion of the set-screw threads were
20
slightly
exposed above the disk surface, stagnation areas could occur, which would be consistent
with the dark blue areas along the leading semi-circle of the set-screw.
An
surface,
is
alternate explanation for the intensity ratio distribution radially along the disk
that
it
results
increases with radius.
3),
A
from the increased stagnation temperature as wheel velocity
strong temperature gradient effect
however, the present disk had a
much higher
was reported by Quinn
(Ref.
thermal capacity than the 0.25 inch plate
used by Quinn, and more nearly uniform temperatures would be expected.
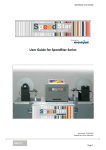
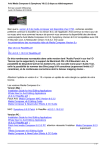
Results in Figure 13 indicated that the significant pixel value range in
Run
1
extended from approximately 50-150 across the disk surface. Results in Figures 14 and
15
show
a slightly negative slope of surface intensity ratio from leading to trailing edge
of the image, implying a decreasing pressure and/or temperature.
The psuedo-colored image of
the intensity ratio for
illustrates the paint stripping effect that
came off
paint
shock.
A
is
at
2,
shown
in Figure 9,
higher rotation speeds.
consistent with the occurrence of a detached
,
Where
the
and possibly unsteady,
shock positioned in front of the shock generator would interact with the
boundary layer on the disk surface.
shows
occurred
Run
the exact location
showed a high-to-low
The gray-scale image from Run 2
where the paint came
off.
in Figure
Intensity ratio distributions for
intensity gradient horizontally across the set-screw
1 1
Run
2
and a nearly
uniform intensity distribution below and behind the shock generator. This intensity
ratio
inconsistent with respect to the pressure distribution from a
bow
distribution
would be
shock located
Run
1
in front
of the set-screw. Possible temperature
effects similar to those in
can be seen in front of the area where the paint was stripped.
21
A histogram showing
the frequency
shown
(number of
pixels) vs. pixel value (intensity)
ratio (I/i) is
in Figure 16.
The pseudo-colored image of
was applied without Krylon,
seen to be similar to that of
the set-screw.
The
is
the intensity ratio (IJ[) for
shown
Run
2,
in Figure 10.
The
paint stripping above the set-screw
of the set-screw, similar
to
Run
2.
pixels) vs. pixel value (intensity) of the
Finally, the result
Run
3, for
which PSP
intensity ratio distribution is
with the exception that the paint was stripped above
experimental runs. Runs at similar conditions to
front
of the image
Run
was not repeated
two similar
3 produced paint stripping only in
A histogram showing
image
in
ratio (1/1) for
the frequency (number of
Run
3
shown
is
in Figure 17.
of the attempt made to keep the paint from stripping by
roughing the surface using the bead-blasting technique,
is
shown
in Figure 12.
stripping occurred in the local area in front of the set-screw similar to
22
Runs 2 and
3.
Paint
o
o
o
©
5-
.o
5
a
00
3
OJD
23
3
5
»
oro
D
»9
SB
O
©
o
o
B
24
a
s
©
o
r.
.o
5
as
1/5
a
(9X1
s
u
3
OX)
25
ore
e
re
IS)
OS
O
"i
<«*
I
CO
»
B
50
S6
V
o
©
B
26
a
s
%
©
S-
.O
P<
a
—
>>
i-
o
in
)»
3
OXi
27
6eee
*i
20
Figure
40
13. Pixel
60
80
100
120 140 160
Pixel Value
vs.
200
220
Frequency vs Intensity Ratio (20,000
300
400
X Coordinate
Figure 14. Pixel Value
180
Single Line of Pixels
28
;
RPM)
751
Above Set-Screw (20,000
RPM)
255-
308
480
X Coordinate
Figure
15.
Pixel Value vs. Single Line of Pixels
20
40
60
88
Figure 16. Pixel Frequency
100
120 140
Pixel Ualue
vs. Intensity
29
688
;
751
Below Set-Screw (20,000
160
180
200
Ratio (23,400
RPM)
220
RPM/Run
2)
leoee
-»*
140
160
126
Pixel Value
Figure 17. Pixel Frequency
vs. Intensity
30
180
200
Ratio (23,400
220
RPM/Run
3)
VI
A
CONCLUSIONS AND RECOMMENDATIONS
high-speed rotor
test facility
using pressure-sensitive paint to obtain surface-
pressure distributions has been developed and operated successfully.
PSP image
focused
intensity-ratio
maps were produced
At supersonic wheel speeds, paint
speeds.
generator occurred.
The
speeds.
A
more adhesive
facility itself was
PSP measurements before
To continue
shown
application
to
Additionally,
subsonic and supersonic
at
stripping around the leading edge of the shock
paint
was required
be a suitable
test
for operation at supersonic
bed
for developing quantitative
on a transonic compressor rig.
the development of the
PSP measurement
technique for supersonic
speeds and transonic rotors, the following are recommended:
1
Install
more responsive
higher rotation speeds.
amount of light passed
2.
to
provide
RPM counter readings
at
Alternatively, enlarge the 1/rev hole to increase the
to the detector.
Investigate paint and application techniques that provide
at
3.
LED photodiodes
good PSP adherence
supersonic rim wheel speeds.
methods
Investigate
for
separating
pressure
and
temperature
effects
quantitatively.
4.
In 2 and 3, develop techniques that are suitable for use on the transonic
compressor
rig,
rotor can not
where surfaces are curved, access
be removed readily between
31
tests
is
more
limited,
-
and the
32
APPENDIX A: PSP SCRIPTS
Executable
4MIP TOOL
scripts
provide "hands-off and remote image capture.
'
into the
AVG.TEST
stabilize before
was
script to
image
provide time to
acquisition.
were modified
developed by Quinn [Ref. 2]
start
An
executable pause
command
software frame-grabber board data transfer and receive
RSI 70 14.3MHz
rate at
for the
RPM to
"Trigger: External Input"
activated during the image acquisition period to synchronise
reverted back to the
was incorporated
up the drive turbine and
Additionally, the
to
rates.
CCU
and EPIX
Synchronisation was
image acquisition completion.
Script
file;
CHECKERT.MPX
provided a quick feedback showing the 10 images captured; and
PSPAVGT.MPX
AVG.TEST
provided the complete image acquisition executable
averaged the 10 images to produce a single captured image.
33
AVG.TEST
{!}pause
1
<QuitMenu
>SpecialOperations&Modes
>TriggerImageCapture
>6)WaitNfields.N: 2
<QuitMenu
<QuitMenu
>MotionSequenceCapture/Display
>TriggerOptions
Trigger: Extemallnput[ * * ]
A
DelayedbyNfields.N:
1
<QuitMenu
<QuitMemu
>VideoFormats
>CustomInterfaceModes
!ExternalPixelClock
<QuitMenu
<QuitMenu
{!}KEY 0x5900 SF6
A Screenl Height
10
A Screen2Height
9
A Screen3Height
9
ISetSplitScreen
<QuitMenu
>VideoDigitize/Display
CurrentlmageBuffer 1
!
{!}KEY 0x4000 F6
>SpecialOperations&Modes
>TriggeredImageCapture
!
ExecuteTriggeredCapture:
{!}KEY 0x4000 F6
{!}KEY 0x4000 F6
!
CurrentImageBuffer2
{!}KEY 0x4000 F6
lExecuteTriggeredCapture:
{!}KEY 0x4000 F6
{!}KEY 0x4000 F6
!
CurrentImageBuffer3
{!}KEY 0x4000 F6
34
!
ExecuteTriggeredCapture
{!}KEY 0x4000 F6
{!}KEY 0x4000 F6
!
CurrentImageBuffer4
{!}KEY 0x4000 F6
!
ExecuteTriggeredCapture
{!}KEY 0x4000 F6
{!}KEY 0x4000 F6
!
CurrentImageBuffer5
{!}KEY 0x4000 F6
!
ExecuteTriggeredCapture
{!}KEY 0x4000 F6
{!}KEY 0x4000 F6
!
CurrentImageBuffer6
{!}KEY 0x4000 F6
!
ExecuteTriggeredCapture
{!}KEY 0x4000 F6
{!}KEY 0x4000 F6
!
CurrentImageBuffer7
{!}KEY 0x4000 F6
!
ExecuteTriggeredCapture
{!}KEY 0x4000 F6
{!}KEY 0x4000 F6
!
CurrentlmageBuffer 8
{!}KEY 0x4000 F6
!
ExecuteTriggeredCapture:
{!}KEY 0x4000 F6
{!}KEY 0x4000 F6
!
CurrentImageBuffer9
{!}KEY 0x4000 F6
!
ExecuteTriggeredCapture:
{!}KEY 0x4000 F6
{!}KEY 0x4000 F6
!
CurrentlmageBuffer 1
{!}KEY 0x4000 F6
lExecuteTriggeredCapture:
<QuitMenu
{!}KEY 0x4000 F6
>MIPXScripts
ExecuteMIPXScriptFile.Name
scripts/checkert.mpx
!
ExecuteMIPXScriptFile.Name
scripts/checkert.mpx
!
ExecuteMIPXScriptFile.Name
scripts/psp_avgt.mpx
!
<QuitMenu
<QuitMenu
35
{!}KEY 0x5900 SF6
A
Screenl Height
A
Screen2Height
30
A Screen3Height
!SetSplitScreen
<QuitMenu
>VideoFormats
!
SetFormat:RS- 1 70iffl 4. 3MHzClock
<QuitMenu
<QuitMenu
36
PSPAVGT.MPX
<QuitMenu
>VideoDigitize/Display
!
CurrentlmageBuffer
1
<QuitMenu
>ImageProcessing
>ImageSequenceOperations
-SequenceStartingBuffer
-SequenceEndingBuffer
!
1
10
AveragelmageSequence
!
ImageAreaoflnterestFullImage
<QuitMenu
<QuitMenu
>MIPXScripts
CHECKERT.MPX
<QuitMenu
>VideoDigitize/Display
!
!
CurrentlmageBuffer 1
CurrentImageBuffer2
!
CurrentImageBuffer3
!
CurrentImageBuffer4
!
CurrentImageBuffer5
!
CurrentImageBuffer6
!
CurrentlmageBuffer 7
!
CurrentImageBuffer8
!
!
CurrentImageBuffer9
CurrentlmageBuffer 1
<QuitMenu
>MIPXScripts
37
38
APPENDIX B. PSP SETUP AND PROCEDURE
The following describes
disk using the
of the
1
test
PSP
bed are
bed
test
the current procedure for
PSP measurements over
The procedures assume
facility.
all
of the
test
a rotor
bed elements
available.
Compressed Air Setup Procedures
-
Check
that all access valves are closed.
-
Check
air pressure
-
Switch
MOV -ON
-
Open
-
Charge
-
Apply power
gauge (>50 psi
is
required for sustained runs above 20,000
RPM).
line to charge
control valve set
2.
lines
manifold
by opening access valves (2-3
to oil cooling
pump;
turns).
adjust setting for oil pressure of 38 psi and
A turn.
l
-
Open
-
Ensure remote activation set-up
cooling water valve
1
turn.
Rotor Disk Attachment To Turbine Driven Fuel Pump.
-
Use 3/32
alien
wrench
to slide
LED
and photodiode back into attaching plate
before attaching rotor disk; this clears area to avoid contact with rotor disk preventing
dents, scratches, etc.
39
Slide rotor disk onto dowels on turbine drive flange while avoiding contact
-
with
LED
Dowels
mounting bracket.
are different diameters to prevent improper
attachment of rotor disk.
Press wheel fully onto turbine drive flange and insert attachment bolts
-
are similar size)
and tighten using 7/16" wrench.
Safety wire
all
(all
bolts
four bolts with .032"
diameter wire.
3.
Krylon Paint Application
Align rotor disk with shock generator
-
hole will be aligned with
LED
12 o'clock position; 3/32" transparent
and photodiode.
Clean rotor disk with acetone
-
at
to
remove greasy film and or contamination
before applying paint. Let dry for 1-2 minutes.
Attach cardboard mask for paint application;
-
LED
and photodiode should be
completely covered prior to painting.
Apply a
-
thin layer (1-2 coats) of glossy Interior/Exterior Krylon paint (#1501);
Avoid paint drips and/or runs along
rotor disk.
Let dry for approximately 30-45 minutes
or until dry.
4.
PSP Application
Clean airbrush and PSP paint container thoroughly with acetone and
-
this
let
dry;
avoids contamination of PSP before application.
Connect airbrush hose
-
to
N
2
bottle
and
set pressure to
check for proper operation.
-
Half fill PSP container and attach
to airbrush
40
approximately 40
psi;
-
MUCH AS
POSSIBLE TO AVOID
rotor disk surface in a
sweeping motion; again
LIMIT PSP EXPOSURE TO LIGHT AS
DEGRADATION OF THE PAINT.
-
Spray PSP 8-10 inches from
Apply paint
avoid any drips, runs or excessive concentration areas of paint.
smooth, even finish
-
Turn
-
Remove
is
until
a
evident (approximately 1-2 minutes of airbrush time).
lights off in the
room and
let
dry for approximately 10 minutes.
cardboard mask and check
area
for
smooth paint
application:
(Excessive paint application will cause weight imbalances on the rotor disk).
-
is
Adjust
LED
and photodiode
required to obtain proper
RPM
to as close as 1/16 inch (trial
pick-up 1/16 inch
is
and error procedure
too large for
speeds of 30,000
RPM).
-
Hand
spin wheel to
ensure proper clearance and that the wheel rotates
unhindered.
with washer and bolts.
Attach spin chamber cover plate and lock
-
Slide Oriel light source into position (markings on floor provide
lamp positioning
5.
down
-
for
uniform and sufficient illumination over rotor
-
Position camera using markings on the floor.
-
Turn on
LED
and
most
effective
disk).
rotate disk until 3/32" hole is located in the center.
Image Focusing
-
Disconnect image inhibit
BNC connector on back of CCU (this step
since an erroneously high setting of image inhibit signal
state).
41
is
is
required
possible in the non-powered
BNC
Disconnect
-
"Vin" from
CCU
CCU
"VD",
to
CP
and connect to Video In Line
A
on
back of Sony the monitor.
Set trigger source on
-
"max", and
damage
set
start
to
set
camera gain
to
"max",
range to either 100|is or higher to see real-time image
range
at
(to
a lower setting and adjust higher later until image
-
Increase line voltage to Oriel lamp to
-
Only "A/RGB" position on
front
1 1
is
set intensity to
avoid intensifier
viewed)
8%
of Sony monitor should be illuminated to
view real-time image.
-
Focus image using camera focus and move camera position
by
monitor; focal length of camera can be changed
to center
image on
adjusting position of the entire lens
assembly (refer to Xybion reference manual before adjusting).
-
image
Once image
inhibit
inhibit pulse
-
BNC
will vary
6.
centered and properly focused, turn off Oriel lamp and reinstall
connector (Wavetek pulse function generator that supplies the image
should be off before connecting image inhibit connector to
Connect "Vin" input
front panel (both
-
is
to
computer and
"A/RGB" and "L/RGB"
Set trigger source
on
CCU
to
select
"L/RGB" on
CCU)
the
Sony monitor
should be illuminated).
"EXT" and
select proper range gate (range gate
depending camera exposures times required)
Software Set-up
The main EPIX program
AVERAGE
scripts.
script is called
AVG.MPX, which
AVG.MPX
and incorporates
LOOK
incorporates a execution delay time,
42
is
and
used to
capture images for wind-on conditions;
current" image capture.
modified for use with
-
file
name
Use a stop-watch
lights
7.
to
5MIP
exiting
developed for wind-off and "dark
EPIX 4MIP
but can be
version.
select the
"MIPX
Scripts" option from the
"c:\4mip\scripts\avg.mpx" in the execute
MIPX
script file
main
prompt.
monitor elapsed time.
Set Oriel lamp control voltage to
when
is
Software script can only be used for
Open EPIX 4MIP program and
menu; enter
-
AVGF.MPX
room and
close
all
1 1
8%
to illuminate rotor disk
and turn off
access doors.
Rotation of Rotor Disk
-
From remote
activation area slowly turn control valve
CAUTION: Avoid over-speeding rotor disk with excess
turbine.
CW
for air supply to
air supply.
RPM and stabilize at desired reading.
-
Monitor
-
Throughout image capture execution, monitor
oil
temperature,
RPM
counter,
and proper software execution.
-
Remove
air
supply after capture sequence
a safe rotation speed (<80
RPM)
is
complete and once rotor disk
is at
enter test bed facility and zero out control voltage to
Oriel lamp.
8.
Saving Wind-on Image
-
(i.e.
9.
Select
"Image
File
Load/Save" from main menu save
file
as a
TIFF format
file
c:\4mip\images\xxx.tiff).
Wind-off Image Capture
The
reference images
(wind-off)
are
43
used to provide a reference intensity
condition for the wind-on image captured above. For the present work, wind-off images
Proper
are referenced to static rotor conditions.
facilitate
-
alignment of the rotor disk will
proper post processing of images.
execute image focusing procedures in step3 above (through image focusing
step); rotate rotor disk until set-screw is centered
-
initial
around black marker on video monitor.
Complete step 3
-
Disconnect 1/rev trigger from rotor disk and connect second Wavetek pulse
function generator
-
Set pulse function generator frequency to the identical value as wind-on
frequency to simulate wheel rotation.
-
Increase
AVGF.MPX
line
execution
control
file.
voltage
File
is
to
Oriel
identical to
lamp
118%
to
AVG.MPX
with the exception of an
execution time delay. Averaged image will be stored in image buffer
-
Select
"Image
File
Load/Save" from main menu save
(i.e.
c:\4mip\images\xxx.tiff).
10.
Dark Current Image Capture
The dark
Dark current
and select script
file
1
as a
TIFF format
file
current image captures the internal thermal noise of camera system.
intensities are subtracted
from wind-on and wind-off images
to increase
signal-to-noise ratios.
-
to the
Repeat procedure for wind-off image capture but with the lens cover attached
camera
-
to isolate noise intensities.
Select
"Image
File
Load/Save" from main menu and save
44
file as
a
TIFF format
c:\4mip\images\xxx.tiff).
file (i.e.
1 1
.
Post Processing
Processing of the captured images results in a single image of the ratio of wind-off
to
wind-on images.
To
increase the signal-to-noise ratio of the images, thermal noise
generated within the acquisition system
-
and
direct
-
Select "Load/Save
subtracted from wind-on and wind-off images.
Image" from the main menu; and load wind-on, wind-off,
images into image buffers
Select
is
1 ,2,
and 3 respectively.
"Image Processing" from main menu and then "Two Image Arithmetic";
select "Subtract Images:
PixB<- Abs(PixB-PixA)" from menu options.
The Subtract Images operation forms a
single
corresponding pixels of two original images. PixA
PixB
is
the
-
image
image
to
is
image from the difference of the
the source
image (dark current) and
be replaced (wind-on and wind-off images).
Select image buffer 3 as the source (PixA) and select image
buffer.
is
complete, image buffer
and 2 should contain the
1
noise- free images of the wind-on and wind-off images respectively.
of wind-off image with respect
Volmer relation shown
Select
-
is
to
in Equation
wind-on image forms the
left
The
hand
final
side
image
ratio
of the Stem-
1
"Image Processing" from main menu and then "Two Image Arithmetic";
select "Ratio images:
(wind-on)
as the destination
Repeat procedure with image 2 as the destination image.
After image subtraction
-
1
PixB <- (cO*PixB+cl)/(c2*PixA+c3)" where image buffer
the source (PixA) and image buffer 2 (wind-off)
Change value
for ratio coefficient, cO, to
45
is
1
the destination (PixB).
produce a usable image (values
between 20-80
will
produce adequate image brightness). Large values of cO will produce
pixel intensity values of 255 and produce
image
the final
"Image File Load/Save" from main menu and save
file
as a
TIFF format
c:\4mip\images\xxx.tiff).
file (i.e.
12.
will contain
ratio.
Select
-
image blooming. Image buffer 2
Psuedo-coloring of Image Ratio
-
Select "Load/Save Image" from the
image buffer
From "Image Measurements" menu
-
Select "Histogram
of Pixel Frequency
The
image
into
Horizontal (Linear
&
Determine the range of pixel values in which
For example, an image where
position C, while the values for
40 and
Logarithmic)" to display histogram
[Ref. 1] determine values for
20 and 80 (A and B,
the median, such as
"Histograms Displays"
select
pixel value range determines the
From Sievwright
pixel value range.
-
vs. Pixel Value.
the data are located.
pixel values
final
1
-
coloring.
main menu and load
respectively), the
D
and
E can be
90%
min/max values
A,B,C,D, and
E
90%
for
of
image
according the
of the data are located between
median value
is
varied, but usually
50, corresponding to
have values closer
to
60, respectively.
Lookup Tables" from main menu
-
Select "Contrast and
-
Select "Numerically Set
&
Show: Red Table"; and enter each segment of the
Red, Green, and Blue tables corresponding to the values chosen for A, B, C, D, and
E
[Ref. 1]
-
Select
"Image File Load/Save" from main menu and save
46
file
as a
TIFF format
file (i.e.
c:\4mip\images\xxx.tiff).
To save
the color
option.
47
image
select
"Save
LUT
w. Image
48
LIST OF REFERENCES
1
Sievwright, D.L., "Application of Pressure-Sensitive Paint in Shock-Boundary Layer
Interaction Experiments,"
California,
2.
March
M.S. Thesis, Naval Postgraduate School, Monterey,
1996.
Varner, D.R., "Pressure Sensitive Paint Measurement
On a Rotor," M.S.
Thesis,
Naval Postgraduate School, Monterey, California, March 1995.
3.
J., "Pressure-Sensitive Paint Measurement Technique Development for
Turbomachinery Application," M.S. Thesis, Naval Postgraduate School, Monterey,
Quinn, K.
California.
4.
Liu, T., Torgerson, S.D., Sullivan, J.P., Johnston, R., Fleeter, S., "Rotor Blade
Pressure Measurement in a High Speed Axial Compressor using Pressure and
Temperature Sensitive Paints,"
Meeting
5.
AIAA Paper No.
97-0162, 35
& Exhibit, Reno, Nevada, January 6-10,
Schanze, K.S., Carroll, B.F., Korotkevitch,
Dependence of Pressure Sensitive
Paints,"
S.,
th
Aerospace Sciences
1997.
Morris, M.J., "Temperature
AIAA Journal
,
Vol. 35, No. 2, February
1997.
6.
Woodmansee, M.A. and Dutton,
J.C.,
Effects of Pressure-Sensitive Paints,"
Sciences Meeting
7.
"Methods
for Treating Temperature- Sensitivity
AIAA Paper No.
97-0387, 35
& Exhibit, Reno, Nevada, January 6-10,
Schanze, K.S., Carroll, B.F., Korotkevitch,
S.,
th
Aerospace
1997.
Morris, M.J., "Concerning the
Temperature Dependence of Pressure Sensitive Paints", AIAA Paper No. 97-0386,
th
35 Aerospace Sciences Meeting & Exhibit, Reno, Nevada, January 6-10, 1997.
8.
9.
and Hand, L.A., " Pressure-Sensitive Paint Measurements on
th
Aeroelasstic Wings in Transonic Flow," AIAA Paper No. 97-0389, 35 Aerospace
Sciences Meeting & Exhibit, Reno, Nevada, January 6-10, 1997.
Schairer, E.T.
Shimbo, Y., Mehta, R.D., Cantwell, B.J., "Vortical Flow Field Investigation Using
The Pressure Sensitive Paint Technique at Low Speed," AIAA Paper No. 97-0388,
th
35 Aerospace Sciences Meeting & Exhibit, Reno, Nevada, January 6-10, 1997.
and Fitzgerald, R.V., "New Technique of Surface Flow Visualization
Based on Oxygen Quenching of Fluoresence", Rev. Sci. Instruments. Vol. 51, pp.
10. Peterson,
670-671,
J.I.
May
1980.
49
11.
Hamilton Standard Technical Manual "Turbine Driven Fuel Pump," Model No. TPC13, 15 April 1968.
Manual "Quartz Tungsten Halogen Lamp Housings," Models 66186
Through 66188, 1993.
12. Oriel Instruction
,
13. Oriel Instruction
Manual "Lamp
,
Controller,"
Model 6405, 1992.
CCD
14.
Xvbion Electronic Systems User's Manual "Electronically Gated
Video Camera," Model ISG-350, May 1992.
15.
Xvbion Electronic Systems User's Manual "Video Camera Control Unit," Model
CCU-01, September 1990.
16.
Epix User's Manual
.
Intensified
,
,
"4MIP-4MIPTOOL
Interactive
1993.
50
Image Analysis," Version
2.8,
INITIAL DISTRIBUTION LIST
1
.
Defense Technical Information Center
8725 John J. Kingman Road., Ste 0944
Ft. Belvoir,
2.
22060
Dudley Knox Library
Naval Postgraduate School
411 DyerRd.
Monterey,
3.
VA
.
CA
93943-5101
Chairman
Department of Aeronautics and Astronautics
Code AA/Co
Naval Postgraduate School
699 Dyer Road - Room 137
Monterey,
4.
C A 93943-5106
Professor R. P. Shreeve
Department of Aeronautics and Astronautics
Code AA/SF
Naval Postgraduate School
699 Dyer Road - Room 137
Monterey, CA 93943-5106
5.
Professor G. V.
Hobson
Department of Aeronautics and Astronautics
Code AA/Hg
Naval Postgraduate School
699 Dyer Road - Room 137
Monterey, CA 93943-5106
6.
Curricular Officer,
Code 31
Naval Postgraduate School
Monterey, CA 93943-5002
7.
Commander
Naval Air Systems
Command
Code Air 4.4T
1421 Jefferson Davis Hwy.
Arlington,
VA
22243
51
8.
Naval Air Warfare Center
Code Air
-
4.4.3.1 [S.
-
Aircraft Division
..
McAdams]
Propulsion and Power Engineering, Bldg. 106
Patuxent River,
MD
20670-5304
LCDR Shane Gahagan
7209 Madiera
Raleigh,
NC
Ct.
27615
52
DUDLEY KNOX LIBRARY
TGRADUATE SCHOOL
MON'fcftEY CA £:.
NA
|
DUDLEY KNOX LIBRARY
3 2768 00338878 6