1
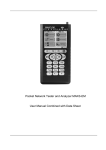
Packet Network Tester and Analyzer MAKS-EMK
User Manual Combined with Data Sheet
Contents
List of Abbreviations
1
Purpose
2
Scope of Supply
3
Tester Structure and Operation
4
Marking
5
Packaging
6
General Operation
7
Safety Precautions
8
Preparation for Work
9
Operation Procedure
10.1 Working with Menus and Entry Fields
10.2 “Measurement” Menu
10.3 Process Topology
10.4 Connection Variants
10.5 Traffic Test
10.6 RFC 2544 Method
10.7 Y.1564 Method
10.8 Multistream
10.9 Packet Jitter
10.12 Cable Diagnostics
10.13 Optical Test
10.14 Remote ОАМ Management
10.15 BER Test
10.16 MDI IPTV Testing
10.17 Loopback Testing
10.18 Thru Mode
10.19 Statistics
10.20 Memory
10.21 Interface Settings
10.22 Remote Management
10.23 Tester Settings and Options
11 Checking Procedure
12 Maintenance
13 Transportation and Storage
14 Product Details
Manufacturer’s Warranty
Acceptance Certificate
Packing Certificate
Information on Primary Checking and Periodic Re-Checking
Reclamation
Appendix А
9
12
13
20
21
22
23
24
25
25
27
26
29
31
38
43
48
50
58
60
61
62
65
68
69
71
72
75
79
82
91
92
93
94
95
96
97
98
100
The present MAKS–EMK User Manual is meant to make the user familiar
with the Tester/Analyzer characteristics and service instructions to operate it
correctly and effectively.
In the present Manual, the following abbreviations and designations are
used:
Table 1.1
ARP
Address Resolution Protocol
AVAIL
Channel Availability
Back-to-back
Limit Load test
BER
Bit Error Rate
Committed Burst Size, guaranteed load. This parameter
CBS
indicates maximum quantity of transmitted test traffic bytes
CIR conditions being fulfilled
Committed Information Rate. This parameter defines
CIR
average test traffic rate in bps, up to which CoS conditions
are fulfilled
CoS
Class of Service
CRC
Cyclic Redundancy Checksum
DDM
Digital Diagnostics Monitoring
DF
Delay Factor
DHCP
Dynamic Host Configuration Protocol
DNS
Domain Name System
DSCP
Differentiated Services Code Point
DUT
Device Under Test
EBS
Excess Burst Size
Excess Information Rate, maximum admissible exceeding
EIR
of CIR. The parameter defines average test traffic rate in
bps up to which CoS conditions are fulfilled
FDV
Frame Delay Variation, packet jitter
FLR
Frame Loss Ratio
Frame Loss Rate Frame Loss Rate test
FTD
Frame Transfer Delay
GPS
Global Positioning System
IFG
Inter Frame Gap
IP
Internet Protocol
Unique identifier (address) of a device connected to the
IP address
integrated network on TCP/IP basis
LAN
Local Area Network
Latency
Frame latency test
MAC
Media Access Control
Unique identifier (address) used for network devices
MAC address
addressing at the physical layer
MDI
Media Delivery Index
MLR
OAM
OSI
QoS
PCP
PDV
Ping
Policy
Precedence
PTP
RJ45
SFD
SFP
SLA
Throughput
ToS
TPID
VID
VLAN
VLAN tag
VLAN ID
TP
SC
PC
SW
Media Loss Rate
Operations Administration Maintenance (Channel status
monitoring protocol)
Open Systems Interconnection Reference Model
Quality of Service settings
Priority Code Point (for VLAN as per IEEE 802.1p)
Packet Delay Variation
Utility used for connection test in TCP/IP-based networks
The test showing traffic spikes. Spikes occur at a speed
exceeding CIR+EIR value
Traffic Precedence
Precision Time Protocol
One of Registered Jack standard connectors used for
connection of twisted pairs
Start of Frame Delimiter
Small Form-factor Pluggable (A transmitter/receiver used
for data transmission in telecommunications)
Service Level Agreement (An agreement on the service
level between an operator rendering communication
services and a client)
Throughput test
Type of Service
Tag Protocol Identifier
VLAN Identifier
Virtual Local Area Network
The corresponding field of Ethernet frame
VLAN Identifier
Twisted Pair
Short Circuit
Personal Computer
Software
Conventions
Conventions listed in the table below are used in the present User Manual.
Table 1.2
Description
Text in bold shows user’s action
Names of menu items and input & display
fields are represented in bold
Text to be entered into menu fields or the
PC is displayed in the following font
Paragraphs marked with “Caution!” warn
the user against a hazardous situation that
may damage the equipment or cause
bodily injuries.
Example
press “Save” button
on the “Statistics” menu
in the following way:
http://192.168.0.111
Caution!
1 Purpose
Packet Network Tester and Analyzer MAKS-EMK is destined for use while
servicing, commissioning and certifying Ethernet and Gigabit Ethernet
networks.
MAKS-EMK performs accurate measurements of copper Ethernet
(10BASE-T, 100BASE-T, 1000BASE-T) and optical Ethernet (1000BASE-Х).
MAKS-EMK functional capabilities include:
− Traffic generation and testing at data link, networking and transport
Layers at two interfaces simultaneously
− RFC 2544-recommended test procedure
− Y.1564-recommended test procedure
− Packet jitter measurement
− Loopback testing at physical, data link and networking Layers
− Testing of channel integrity and IP routes
− Received and transmitted traffic statistics collection and display
− Connection between measuring ports (Through mode)
− Copper cable diagnostics
− Remote control via USB port and Ethernet
1.1. Utmost Permissible Operation Conditions
MAKS-EMK is a portable Tester designed for operation within the following
conditions:
− environment temperature + 5 °С… + 40 °С
− relative air humidity up to 90% at the temperature of + 25 °С
− atmospheric pressure 450 Mmhg (60 kPa) min. and 795 Mmhg
( 106 kPa) max.
The Tester is powered from a built-in battery (1 ea, LiIon type) or AC mains
220-230 V 50-60 Hz (if a power unit is used). MAKS-EMK is meant for
continuous 24 hours operation.
2 Technical Information and Specifications
The Tester provides:
− support and testing of two fully independent Ethernet/Gigabit
Ethernet interfaces
− traffic generation at physical, data link and networking Layers
− received and transmitted traffic statistics collection and display
(sorting according to frame types, sizes and erroneous frames)
− current test results generation and on-screen display
− RFC 2544-recommended measurements of throughput, latency,
frame loss and back-to-back
− Y.1564-recommended
performance
measurements
of
configuration
and
− channel integrity and IP routes testing: ping, traceroute, DNS support,
IP scanner
− loopback at physical, data link, networking and transport layers, with
or without MAC and IP swapping
− pass-through connection from one measurement port to another with
monitoring and statistics collection (Through mode)
− incoming traffic filtering at data link and networking layers
− cable diagnostics
− ARP & DHCP support
− remote device detection via Ethernet OAM
− RFC 4445-recommended testing of MDI metrics
− optical test including input and output power measurement
− symmetric and asymmetric channel traffic transmission test
− testing in Multistream mode
− packet jitter measurement
− measurement of clock conditions according to PTP IEEE1588
− remote control via USB port and separate Ethernet port by means of
remote management software
− independent storage of test/interface settings and test results in the
internal memory of the Tester
Specifications
Table 2.1
Characteristics
Interfaces
Electrical Ethernet/IP
Optical Ethernet/IP
Managing interface for
connection to PC
Display
Battery
Weight and Size
Depth
Width
Height
Weight
Power
Stand-alone operation in test
mode
Battery charge time
Supply voltage
Description
Two RJ45 interfaces 10 Mbps, 100
Mbps,1000 Mbps
Two SFP interfaces 1000 Mbps
USB client, Ethernet 10/100 BASE-T
Graphical, multicolour, 320х240 dpi
Li-Ion, 1 ea
225 mm
110 mm
53 mm
0.67 kg
up to 9 h
2 h max.
12 V
Utmost Permissible Operation Conditions
Environment temperature
+ 5 °С… + 40 °С
Relative air humidity
up to 90% at the temperature of + 25oС
Atmospheric pressure
450 Mmhg (60 kPa) min. and 795
Mmhg (106 kPa) max.
Other Characteristics
TST test output pulse amplitude
1.5 V ± 0.5 V
3 Scope of Supply
Name
Quantity
MAKS-EMK Tester and Analyzer
1
Power unit
1
USB cable
1
Duplex patch cord
3
Duplex optical patch cord
2
K-08 сable for checking and reference
2
signals
Fiber optic SFP module
2
Carrier bag
1
Software CD
1
User Manual combined with Data Sheet
1
* It is possible to use items of other types providing the same
characteristics of the Tester
** Supplied at customer’s request
Table 3.1
Note
*
*
*
**
**
**
*
4 Tester Structure and Operation
4.1. Front Panel
Figure 4.1 shows front panel of the Tester where LED indicators, display
and keypad are located.
Figure 4.1 Front Panel
4.1.1. LED Indicators
LED indicators (LEDs) provide visual control of measuring conditions and
data transmission/reception.
LEDs are placed directly above the display. Both A and B ports are
provided with four LEDs each: Test, Rx, Tx, Link (left to right). Depending on
Tester operation modes, LEDs show different types of status information. On
the display under LEDs you can find captions describing mode of the Tester
and the LEDs.
LED Description
Test LEDs show port engagement in test fulfillment. At that, they can be of
three different colours:
− green – either “Loopback” or “Through” mode is on, or the port is
engaged in test fulfillment;
− orange – one of unfinished tests containing errors is being fulfilled at the
moment;
− red – the last test on the port was unsuccessful;
On-screen captions of Test LEDs can be as follows:
A->A – traffic transmission topology from Port A to Port A selected;
A->B – traffic transmission topology from Port A to Port B selected;
A->R – for asymmetric test mode - traffic transmission topology from Port A
to a remote point, or from a remote point to Port A selected;
B->A – traffic transmission topology from Port B to Port A selected;
B->B – traffic transmission topology from Port B to Port B selected;
B->R – for asymmetric test mode - traffic transmission topology from Port B
to a remote point, or from a remote point to Port B selected;
BERT – port is busy with “BER” test traffic reception/transmission;
CAB – port is busy with cable test signals reception/transmission;
DNS – port is busy with “DNS” test packets reception/transmission;
JIT – port is busy with “Packet Jitter” test traffic reception/transmission;
LB – “Loopback” menu option has been selected;
LB1 – Layer 1 “Loopback” mode is on;
LB2 – Layer 2 “Loopback” mode is on;
LB3 – Layer 3 “Loopback” mode is on;
LB4 – Layer 4 “Loopback” mode is on;
MDI – port is busy with MDI test traffic transmission;
MS – port is busy with “Multistream” test traffic transmission and
reception
OAM – ОАМ mode is activated;
PING – port is busy with “Ping” test traffic reception/transmission;
RFC – port is busy with “RFC 2544” test traffic reception/transmission;
SCAN – port is busy with “IP Scanner” test traffic reception/transmission.
THRU – “Through” menu has been selected or “Through” mode is on;
TRR – port is busy with “Traceroute” test packets reception/transmission;
TRAF – port is busy with test traffic data reception/transmission.
РТР – port is busy with “PTP” test data reception or transmission.
Y1564 – port is busy with “Y.1564” test traffic reception/transmission.
Test LED caption is highlighted white in “Loopback” and “Through”
modes. Test LED caption is highlighted yellow on “Process Topology” menu
at traffic generation port and also during tests with traffic generation. Test LED
caption is highlighted red if the last test performed at that port was not
successful.
Rx LEDs report data reception status:
green – frames are being received at the corresponding port.
Green highlighting of Rx LED caption reports the port being test traffic
recipient, or “Loopback” or “Through” modes being on.
Tx LEDs report data transmission:
green – frames are being transmitted at the corresponding port.
Yellow highlighting of Tx LED caption reports the port being test traffic
transmitter, or “Loopback” or “Through” modes being on at that port.
Link LEDs report connection status:
Green – the corresponding port is connected
On-screen captions of the LEDs report transmission speed: 1000 for
1000BASE-T and 1000BASE-Х, 100 for 100BASE-T, 10 for 10BASE-T, NS –
no synchronization. “Н” symbol stands for half duplex mode and “F” symbol
stands for full duplex mode.
4.1.2. Display
Tester screen is represented by a coloured graphical LCD with 320×240
pixels resolution.
4.1.3. Keypad
The Tester is managed and alphanumeric information is entered by means
of the keypad.
Keys
– “On/Off” key (see Paragraph 9.5).
– functional keys whose functions depend on Tester
mode. If the key is available, its dedication will be displayed in the keys
description in the lower part of the display.
– arrow keys.
– “Enter” key. It is used to enter the menu sections or subsections
and to change menu options.
– “Menu” key, press it to return to the previous menu or cancel
current action.
– keys for alphanumeric symbols and characters entry.
4.1.4. External Connectors
Figure 4.1.4 shows location of external connectors on the upper, lower and
lateral sides.
All connectors are marked on the housing of the Tester in accordance with
the denominations listed in Table 4.1.
Table 4.1. Purpose of MAKS-EMK Connectors
Marking
A, B
SFP A, SFP B
Purpose
RJ-45 to connect to DUT or network under test
to connect to DUT or network via SFP modules
reference signal input connector
checking signal output connector
a USB port for remote management
an RJ11 for connection of a headset
an RJ45 for remote management
for power unit connection and battery charging
hidden hardware reset button *
charging indicator LED
grounding connector
* Note: To reset of the Tester, press the hidden reset button with a thin
blunt pin. At that, current settings are not saved, and next time the Tester is
switched on its settings will go back to the data saved when the Tester was
switched off normally last time (see Paragraph 9.5).
Figure 4.1.4 Location of Connectors
Connection of SFP Receiver/Transmitter
SFP A and SFP B connectors are used for connection of SFP optical
modules or SFP copper modules with external RJ45 to the Tester. SFP
modules supplied with the Tester and other modules can be used.
Please make sure that the receiver/transmitter and the connector support
the same physical interfaces before inserting the SFP module. Do not forget to
lock the SFP module latch. When inserting the SFP module make sure that its
label is facing the Tester front panel. When the module is installed it will be
securely fixed in the connector using the module’s locking latch. If the module
has been installed properly, you will hear a click.
Caution! If it is not easy to install the SFP module for the first time, please
do not exert extra force on it to avoid connector damage.
Before an SFP module (see Paragraph 10.21.6) is securely fixed, the
corresponding LED may already indicate its availability. Please make sure that
the module has been installed correctly.
Please use a rubber cap to protect a temporarily unused SFP module from
contamination.
Before removing an SFP module from the connector, disconnect fiber
optical plugs by pressing their latches and carefully take the cable out of the
receiver/transmitter. After that, unlock the SFP module latch and pull it to
remove the module from the connector.
Correct storage of SFP modules: you should use antistatic boxes or
packages and protect fiber optical connectors with rubber caps.
4.2. Component Specifications
4.2.1. Power Unit
MAKS-EMK power unit serves to supply the Tester from AC mains and
integral battery cell. It represents a static power supply unit with built-in short
circuit and overload protection.
Input: AC voltage 100 ÷ 240 V, 50 ÷ 60 Hz.
Output: DC voltage 12 V, current up to 1.5 А, constant.
Power unit soldered connections are arranged according to Figure 4.2.
+12
General
Figure 4.2 Soldered connections of power unit jack plug
5 Marking
5.1. MAKS-EMK Tester has the following marks:
− name of the manufacturer;
− equipment conditional name;
− month and year of manufacture;
− equipment serial number (as per manufacturer’s numbering system).
5.2. Marking of consumer packaging includes:
− trademark of manufacturing plant;
− name and plant denomination of the device;
− packing date;
− transportation and storage temperature information.
5.3. Shipping data must include:
− consigner and consignee names;
− cargo package gross and net weight;
− “Fragile freight!”, “Keep dry” and “This side up!” handling instructions.
6 Packaging
6.1. MAKS-EMK Tester, its accessories kit and in-line documentation are
placed into a bag and then packed into a cardboard box according to the
corresponding construction documentation. Packing the Tester into an
additional box is specified in the delivery contract. Pack the equipment in a
room with relative humidity of 80 % max. and at a temperature of 15°C… 35°C.
7 General Operation
7.1. Before starting MAKS-EMK operation it is highly recommended to
familiarize with the present User Manual, purpose of keys, external connectors
and components of the Tester.
7.2. The Tester should be operated in the conditions not exceeding its
operation conditions. The supply mains must be free from voltage spikes.
There must not be strong electrical and/or magnetic field sources next to the
working place.
7.3. Protect the Tester and its power unit from hits, moisture, dust and
continuous exposure to direct sunlight.
7.4. If you put the Tester into operation after its stay in cold weather
conditions, you will have to place it in standard environment for at least 2
hours, and only then start its operation.
7.5. If service interruptions last for more than two hours, it will be
recommended to disconnect power unit from the mains.
7.6. The Tester can be powered from:
− mains 220-230 V, 50-60 Hz by means of a power unit;
− battery cells (LiIon, 1ea).
To charge the battery, connect MAKS-EMK tester to the mains via its power
unit. At that, the Tester can be either switched on or switched off.
“
” indicator in screen bottom-right corner shows battery characteristic.
The fewer segments are displayed, the lower battery is. At that, as battery
discharges, indicator colour starts changing into green, yellow and red. When
battery is being recharged, the indicator alternately changes its colours. As
soon as power supply is connected, battery indicator will acquire the following
”.
form: “
Battery cell characteristic (refer to paragraph 10.22.4). Full battery charge
time in normal weather conditions does not exceed 2 hours.
Battery service life depends on the amount of “charge-discharge” cycles.
This battery type is meant for approximately 500 “charge-discharge” cycles.
When battery cells are fully charged, and depending on their condition,
Tester operating period in off-line mode will be equal to at least 9 hours.
When battery is discharged, the Tester will emit audio signal every 30
seconds. The Tester turns off automatically when battery is much discharged.
At that, it is possible to turn it on but the Tester will turn off automatically in 5
seconds. To prevent full discharging of Tester battery and configuration reset,
do not keep the Tester discharged for a period of time exceeding 2 days.
8 Safety Precautions
Caution! External power unit carries fatal voltage. Do not operate the power
unit if damaged.
9 Preparation for Work
9.1. Unpack the Tester and examine it visually. Check set completeness
according to Table 2.1.
9.2. Keep the Tester in normal conditions for at least 2 hours.
9.3. Plug in the power unit (if Tester is going to be mains-powered).
If Tester is going to be battery-powered, you will have to charge the battery
cells
9.4. To switch the tester on, press On/Off key and hold it for 2 seconds.
When the tester is powered, a welcome message will appear on the screen.
To switch the Tester off, press On/Off key once and confirm the action
using the menu. The tester saves its current settings each time it is switched
off correctly. Each time the tester is switched on it will download saved settings
and turn on the configured functions.
10 Operation Procedure
10.1 Working with Menus and Entry Fields
Main menu appears as soon as you switch Tester on Figure 10.1 shows
main menu structure.
Figure 10.1 Main menu
“Process A” and “Process B” menus are designed for selection of Port A
and Port B that will be involved in testing.
“Memory” menu is designed for saving test and interface settings as well
as for viewing the info on the saved settings and measurements.
“Statistics” menu displays statistics;
“Device Settings” menu serves to select the required operation settings;
“Interface Settings” menu displays settings of the following three Ethernet
ports: measurement port A, measurement port B and remote management
port.
Working with the Menu
Navigation through menu icons, tabs and lines is effected using arrow keys.
At that, active icon or tab captions are highlighted blue whereas captions of
inactive ones are highlighted black. “Enter” key serves to enter menu options.
When you enter a tab, your current tab caption will change its colour from
black to light grey. To leave your current tab, press “Menu” key. Entry fields
with changeable parameters and check box captions are blue whereas other
information fields are black.
Working with Numeric Entry Fields
Numeric entry fields can be of three types: decimal, hexadecimal and
fractional.
Decimal field allows entering integer numbers only. Transition to the
following digit of the field is performed automatically after the value of the
current digit is entered. To move the cursor within the field, use “Left” and
“Right” keys.
Hexadecimal field allows entering digits and capital Latin letters from A to
F. To move the cursor within the field, use “Left” and “Right” keys.
Fractional field is characterized by a dot delimiter between the integer and
fractional parts. It can be entered instead of any digit of the current field by
means of holding “0” key. To change the position of the delimiter, enter a digit
into its place and then enter a dot where necessary.
10.2 “Measurement” Menu
“Process A” and “Process B” sections of Main Menu provide access to
“Measurement” menu designed to select tests for ports A and B.
“Measurements” menu consists of two pages. To go from one page to
another, use functional keys Page 1 / Page 2.
“Measurements” menu is illustrated in Figures 10.2.1 and 10.2.2.
Figure 10.2.1 “Measurement” menu, page 1
The first page of menu includes the following tests:
− Traffic Test;
− RFC 2544 Test;
−
−
−
−
−
−
−
Y.1564 Test;
Multistream;
Packet Jitter;
PTP;
TCP/IP Tests;
Copper cable Diagnostics,
Optical Test.
Figure 10.2.2 “Measurement” menu, page 2
The first page of menu includes the following tests:
- OAM;
- BER test;
- MDI test;
- Loopback mode;
- Thru mode.
Coloured icons indicate launchable tests. Grey icons indicate unavailable
(blocked) tests. Test blocking may be caused by conjoint measurements of the
selected or another port, or unavailability of the corresponding Tester option.
10.3 Process Topology
“Measurements” menu sections related to tests with traffic generation and
reception allow access to “Topology” menu. Topology can be selected for
tests with traffic generation:
- Traffic test;
- RFC 2544;
- Y.1564;
- Multistream;
- Packet jitter;
- BERT;
- MDI.
“Topology” menu is illustrated in Figure 10.3.
Figure 10.3 “Topology” menu
“Terminal А>>В” – traffic is generated at Port A and received at Port B.
“Terminal А>>А” – traffic is generated and received at Port A, at that traffic
is looped at the remote point using “Loopback” function.
“Terminal В>>А” – traffic is generated at Port B and received at Port A.
“Terminal В>>В” – traffic is generated and received at Port B, at that traffic
is looped at the remote point using “Loopback” function.
“Terminal А>>R” – traffic is generated at Port A and received at the remote
point or it is generated at the remote point and received at Port A, or the
process goes bidirectionally.
“Terminal В>>R” – traffic is generated at Port B and received at the remote
point or it is generated at the remote point and received at Port B, or the
process goes bidirectionally.
The last two modes of the topology are used for testing of asymmetric
transmission channels. This topology is available for “Traffic Test” including
“08-АТ” option only.
When tests are running or “Loopback”/“Thru” modes are activated, the
selected port will be busy and access to certain menu items will be blocked for
the avoidance of collisions. At that, the blocked menu items will be represented
by grey icons. When tests or modes involving both ports are active, certain
menu items of the opposite port will also be blocked.
10.4 Connection Variants
Tests with traffic generation are the following: “Traffic Test”, “RFC 2544”,
“Y.1564”, “Packet Jitter”, “BERT”, “Multistream”, “MDI”.
In order to perform these tests, the Tester is to be connected either to
network section or DUT according to the three connection diagrams (A, B and
C) illustrated in Figures 10.4.1, 10.4.2 and 10.4.3.
Variant A: loopback function may be activated by means of the second
port of the same МАКS-ЕМK Tester (if two interfaces are available at one
point), or MAKS-EM tester, or МАКS-ЕМВ/MAKS-EMBK tools.
Figure 10.4.1 Tester Connection in the Mode of Symmetric Channels
Testing, Variant A
Variant A is suitable for symmetric channels testing. Network sections with
distant loopback point are usually tested in accordance with diagram A. At that,
loopback Layer (from 1 to 3) is selected depending on the network equipment
used within this network section. For example, if a network section involves
only network commutators (switches), you will have to activate Layer 2
Loopback function, but if a section involves routers, you will have to switch on
Layer 3 Loopback function. For more on Loopback function, see paragraph
10.17.
Figure 10.4.2 Tester Connection in the Mode of Unidirectional Testing,
Variant B
Variant В is more frequently used for testing of network equipment. In this
case test traffic is transmitted in unidirectional way from one port to another.
Figure 10.4.3 Tester Connection in the Mode of Asymmetric Channels
Testing, Variant C
Variant C is suitable for asymmetric channels testing, when incoming and
outcoming streams’ parameters differ. Variant C is used for “Traffic Test”
only.
10.5 Traffic Test
Traffic test is the simplest of all MAKS-EMK tests. It is used for testing of
channel transmitting capability.
Traffic is generated and frame loss, latency and packet jitter are analyzed
within the set time according to the selected load and frame size.
Traffic test can be used for testing both symmetric and asymmetric
channels.
10.5.1 Traffic Test for Symmetric Channels
The Tester is connected according to Variants A or B described in
Paragraph 10.4. In this case, one of “Terminal A>>B”, “Terminal A>>A”,
“Terminal B>>A” or “Terminal B>>B” modes is to be selected from “Topology”
menu.
“Traffic Test” menu is illustrated in Figure 10.5.1
Figure 10.5.1 Traffic test
Test menu contains the following functional buttons:
Start/Stop – test start and stop,
Sett. – access to test settings.
The following fields are displayed on test status menu:
Elaps. – time from the beginning of traffic test
Estim. – time until the end of traffic test
Тх Frames– transmitted frames amount
Rx Frames – received frames amount
Тх bytes – received bytes amount
Vrt, Mbps – current test traffic speed. This data is displayed only during
test run.
PDV, ns – average packet jitter value.
Latency – latency value.
Loss frame* – amount of lost bytes equal to the difference between the
amount of transmitted frames and the amount received frames. It is displayed
in “Amount” column. Frame loss ratio is displayed in “Ratio” column.
Err. frames – received erroneous frames total amount (Runt, Jabber,
CRC) it displayed in “Amount” column. Error ratio is displayed in “Ratio”
column.
CRC – amount of received frames with erroneous checksum displayed in
“Amount” column. Erroneous frames ratio is displayed in “Ratio” column.
Runts – amount of received frames less than 64 bytes of size with correct
checksum is displayed in “Amount” column. Ratio of such erroneous frames is
displayed in “Ratio” column.
Jabber – amount of received frames more than 1518 bytes of size with
erroneous checksum is displayed in “Amount” column. Erroneous frames ratio
is displayed in “Ratio” column.
Pause – total amount of pause frames
*Note: even if frame loss is not detected, loss rate may be equal to a nonzero value. It can be explained by channel latency and sender/receiver buffer
latency.
To the left of the status field, an icon indicating current status of the test is
displayed. The icon can be as follows:
−
Green – test passed successfully**;
−
Yellow – test has not started yet;
Red – test failed;
−
−
White – test is disabled;
– test is running at the moment;
−
−
– test was interrupted by the user;
−
– error in test on the far side;
– error in test: no line synchronization/ line synchronization loss;
−
−
– error in test: no test traffic transmission;
−
– error in test: no test traffic reception;
−
– error in test: amount of received test frames exceeds the
amount of transmitted test frames. It reports problems of network
equipment the current measurement interface of the tester is
connected to.
When the test is finished, one of the following messages will appear on the
display:
− Test is OK – test has passed successfully with no frame loss at this load
− Errors in test – errors occurred during the test
- Loss exceeded – test passed, but some frames were lost at this load.
10.5.2 Settings of Traffic Test for Symmetric Channels
“Header” Tab
The tab contains settings fields similar for all tests with traffic generation.
For its description refer to paragraph 10.5.3.
“Adjustment” Tab
Load type – this parameter is not used since it is a constant load test
Units – selection of units in which Load is displayed
Load, % – load value
Threshold FLR – if this threshold is exceeded, the test will be considered
failed.
Packet length – length of generated frames in bytes
Duration – time duration of the test set in “hh:mm:ss” format. If its value
equals zero, the test will run endlessly.
10.5.3 Settings of Tests with Traffic Generation, “Header” Tab
The tab contains setting fields similar for all tests with traffic generation: i.e.
“Traffic Test”, “RFC 2544”, “Y.1564”, “Packet Jitter” and “Multistream”.
Individual settings for each test are stored in Tester memory.
Connection speed, source MAC address, source IP address, VLAN and
MPLS measurement interface parameters are specified on “Interface
Settings” menu. Refer to paragraph 10.20 for description.
Layer 2
ARP enable – function of destination МАС address automatic definition by
means of ARP request performed before running the test. When this option is
marked, “Received MAC” field disappears and its value is disregarded.
МАС Dest. – destination МАС address. If network section under test does
not contain routers, destination МАС address will be the address of frame
receiving/loopbacking device. Alternatively, destination МАС address will be
defined by МАС address of the nearest router.
МАС Source – address of traffic generating interface is set as source МАС
address. This field indicates the value specified on “Interface Settings”
menu.
Layer 3
Marking of this field makes settings of network Layer packet fields
available.
Automatical IP Destination – if this field is marked, destination IP address
will be similar to opposite port IP address at A->B and B->A test topology.
IP Dest. – destination IP address
IP Source – address of traffic generating interface is set as source IP
address. This field indicates the value specified on “Interface Settings”
menu.
ToS/Precedence – activation/deactivation of QoS settings. Marking of this
field blocks DSCP and its value is disregarded. For detailed description of
fields refer to RFC 791. ToS field bit names are presented in Table А.1,
Appendix А.
Precedence – frame precedence specifies Р0-Р2 bits in ToS field. It
assumes values from 0 to 7. Correspondence of precedence values and
names are presented in Table А.2, Appendix А.
ToS – Т0-Т3 bits in ToS field displayed in binary form. This field can
assume the following values: 0000, 0001, 0010, 0100 and 1000.
DSCP – activation/deactivation of QoS settings. Marking of this field blocks
ToS/Precedence and its value is disregarded. DSCP field bit names are
presented in Table А.3, Appendix А. The field may assume values from 0 to 64
and it displays 6 uppermost DS0-DS5 bits from the corresponding frame
header byte in binary form. Lettered abbreviation is also displayed (see
RFC 2474 and RFC 2597 for more details). Correspondence of precedence
values and names are presented in Tables А.4 and А.5, Appendix A.
Layer 4
Marking of this field makes settings of transport Layer packet fields
available.
UDP Dest. – destination port number
UDP Source – source port number
Source MAC address, source IP address and VLAN and MPLS fields are
set by means of “Interface Settings” menu.
10.5.4 Traffic Test for Asymmetric Channels
Note: Traffic Test for Asymmetric Channels is Tester option 08-AT.
The Tester is connected according to Variant C described in paragraph
10.4. In this case, either “Terminal A>>R” or “Terminal В>>R” mode is to be
selected from “Topology” menu.
Traffic Test for Asymmetric Channels always involves two devices. Use of
two interfaces of one tester is not appropriate.
“Traffic Test” menu is illustrated in Figure 10.5.2.
Figure 10.5.2 Traffic Test for Asymmetric Channels
Test menu contains the following two functional keys:
Start/Stop – test start and stop,
Sett. – access to test settings.
Test status menu contains two tabs displaying current and remote point
parameters.
Statistics output – measured parameters and values of the outgoing
stream, from the current port to a remote point. Tab header field is blue.
Statistics input – measured parameters and values of the incoming
stream, from a remote point to the current port. Tab header field is green.
Parameter statistics is analogous to the one described in Paragraph
10.5.1except for:
Rx frames – amount of received frames at the second point.
Unilateral latency is not measured.
Note: Remote point parameters’ values are not displayed during test
performance.
10.5.5 Settings of Traffic Test for Asymmetric Channels
Test settings menu contains four tabs displaying settings of streams from
the current point and from the remote point.
Header output – packet fields’ parameters and values for the outgoing
stream, from the current port to a remote point. Changeable parameter fields
are blue.
Header input – packet fields’ parameters and values for the incoming
stream, from a remote point to the current port. Fields of changeable
parameters are blue.
Additional output – outgoing stream additional parameters.
Additional input – incoming stream additional parameters.
Description is analogous to Paragraph 10.5.2
“Header output” and “Header input” Tabs
The tab contains similar setting fields for all tests with traffic generation.
Description is analogous to Paragraph 10.5.3 except for:
ARP request – МАС address identification function is always enabled. The
test exchanges management information and telemetering over the third layer.
“Common” Tab
Duration – test duration in “hh:mm:ss” format. If the value equals zero, the
test will run endlessly.
Learning Int., ms – waiting time in milliseconds after sending a Learning
frame or an ARP request and before frames transmission starts.
Wait Interval, ms – waiting time in milliseconds during which Tester awaits
sent frames return from the network.
10.6 RFC 2544 Method
10.6.1 RFC 2544 Test Description
RFC 2544 method is a standard of diversified Ethernet testing. It describes
the script of an automated Ethernet channel test procedure with deficient
operating traffic. The script contains key parameters for throughput, latency,
frame loss and back-to-back testing. Each test allows checking certain
parameters described in SLA. Test methodology defines frame sizes, test
duration and amount of test repeats.
МАКS-ЕМK Tester allows running four basic RFC 2544 tests:
− Throughput. Evaluation of maximum bit rate. At this rate, amount of test
frames transmitted through DUT or network section is equal to the
amount of frames sent from test equipment. This test is used for
recording maximum switching speed of transport Ethernet elements.
Minimum determinable throughput value expressed in % is calculated by
L
the following formula: 226 , where L is packet length in bytes.
− Latency. Evaluation of time slot during which a frame is transmitted from
source to destination and back in accordance with the diagram illustrated
in Figure 10.6.1. This value is called round-trip delay. When data is
transmitted from one port to another according to test pattern presented
in Figure 10.6.2, only one-way delay is measured. Default setting
suggests fulfillment of 30 tests regarding whose results average delay is
calculated.
Note: The lowest measurable latency value is equal to 8 ns.
− Frame loss rate. Testing a network section or a network device
capability of supporting real-time applications (retransmission is not
possible). This test allows calculating percentage of frames not
transmitted by network element at constant load because of hardware
resource deficiency. Please note that high percentage of frame loss is a
cause of QoS degradation.
− Back-to-back. The test measures the time slot needed to manage
maximum load is determined. Test pattern is illustrated in Figures 10.4.1
and 10.4.2. It is mostly used to test such network devices as
multiplexers, commutator switches and routers.
MAKS-ЕМK supports simultaneous two-interface RFC 2544 testing.
10.6.2 RFC 2544 Test Settings
Pressing Default button returns all RFC 2544 test settings to default value.
“Header” Tab
This tab contains similar setting fields for all tests with traffic generation.
Refer to paragraph 10.5.3 for description.
“Frames” Tab
RFC 2544 method recommends using the following seven preset frame
sizes: 64, 128, 256, 512, 1024, 1280 and 1518 bytes at Ethernet testing.
These values are set by default. It is possible to set other frame sizes and
apply extended RFC 2544 pattern that allows using frames of random sizes
including Jumbo frames* from 1519 to 9600 bytes of length. You can also set
an additional test frame from 64 to 9600 bytes of length. Frame sizes in bytes
should be specified in lines. Field marking allows the corresponding
configuration of the frame.
*Note: Some routers either do not support Jumbo frames or have to be
preconfigured to support them. Please familiarize with the specific router
documents to estimate the possibility of Jumbo frames support.
“Throughput” Tab
Enable – marking of this field allows running “Throughput” test.
Min Loading, % – loading value expressed in percent. Achievement of this
value stops “Throughput” test. If “zero” value is set, the test will continue until
an irreducible load value stated in paragraph 10.6.1 is achieved.
Max Loading, % – percentage loading value at the beginning of
“Throughput” test for each frame size.
Interval, s – time period of continuous test fulfillment with specified frame
sizes and parameter values.
“Latency” Tab
Enable – marking of the field allows running “Latency” test.
Iteration – amount of trials of each specified frame size in “Latency” test.
Interval – time period of continuous test fulfillment with specified frame
sizes and parameter values.
Manual rates – when the field is marked, “Latency” test will run with the
load specified in below settings. Otherwise the test will run with the load being
the result of “Throughput” test.
“Frame loss” Tab
Enable – marking of the field allows running “Frame Loss Rate” test.
Interval, s – time period of continuous test fulfillment with specified frame
sizes and parameter values
Step loading, % – percentage value of loading by which the loading of
each successive test stage will decrease in case of frame loss.
First loading, % – percentage value of loading at the beginning of “Frame
Loss” test.
Last loading, % – percentage loading value to which “Frame Loss” loading
decreases. If frame loss is not detected at any stage, loading will not decrease
to the level of final loading value.
“Back-to-back” Tab
Amount – amount of trials in “Back-to-back” test for each set frame size.
Enable – marking of this field allows running “Back-to-back” test.
Min interval, s – minimum time interval in seconds during which the Tester
managed maximum load. It is calculated for each frame size.
Max interval, s – maximum time interval in seconds during which the
Tester managed maximum load. It is calculated for each frame size.
“Advanced” Tab
Learning Int., ms – waiting time in microseconds after sending a Learning
frame or an ARP request and before frames transmission starts;
Wait Interval, ms – waiting time in microseconds during which Tester
awaits sent frames return from the network.
10.6.3 RFC 2544 Test Statistics
“RFC 2544” Menu is illustrated in Figure 10.6
Test menu contains three functional buttons:
Start/Stop – test launch and stopping.
Sett. – access to test settings.
Graph – presentation of the selected test results in tabular form or
graphically.
Table fields are automatically filled in with current test results. The table
contains the following common fields:
Status – the field displays current test status. It may take the following
forms:
− OK – test passed;
− Wait – test has not started yet;
− Runnin – test is running at the moment;
− Stop – test was discontinued;
− Off – test of this frame size is disabled;
− Error – “Throughput” test failed because of frame loss at minimum load;
“Back-to-back” test failed because of the losses during the minimum
time slot;
Figure 10.6 RFC 2544 Test
−
−
−
−
NS – no line synchronization during the test;
No Тх – no test traffic transmission;
No Rx – no test traffic reception;
RxTx – amount of received test frames exceeds the amount of
transmitted test frames.
If critical errors occur, the current test will be discontinued and the following
test will be launched.
“Frame” – this field shows test packet size in each trial.
“Throughput” Tab
“%” – the field shows measured throughput rate in percentage of
maximum channel rate (if the test has been successful). During test run, the
field shows current load.
T L1 / T L2 – this field displays throughput value in Mbps, Kbps or bps for
Layers 1 and 2. During the test, the field shows current load value.
To select a Layer, press “Down” arrow key and then use “Left” and “Right”
arrow keys. Layer 2 throughput value is equal to information speed V L2.
Maximum throughput value is calculated by the following formula:
T L2 = V f ×
S
( S + P + SFD+ IFG ) , where
T L2
– Layer 2 throughput;
f
– connection speed (1000 Mbps, 100 Mbps, 10 Mbps);
S – frame size;
P – preamble (7 bits);
SFD – start frame delimiter (1 bit);
IFG – interframe gap (12 bits).
V
Maximum Layer 1 throughput of a lossless channel is equal to connection
speed, i.e. T L1= V f . Maximum Layer 2 throughput is calculated by the abovementioned formula. T L2 values for different frame sizes are presented in Table
A.6, Appendix A.
“Latency” Tab
“Load.” – the field displays tested loading value expressed as a
percentage.
“Latency” – the field shows measured average latency value in ns (if the
test was successful). During the test, current measured latency value is
displayed in this field.
“Frame loss” Tab
“Load.” – this field displays tested load values in %. To view the required
column, press “Down” arrow key and then select the needed column
containing load data using “Left” and “Right” keys. Frame loss value for the
selected load will be displayed in “Loss” column. Measurements are
performed before the trial which will detect no frame loss. That is why only
values of loads that participated in tests are displayed in the table.
“Loss,%” – the field displays frame loss value in % for the selected load.
“Back-to-back” Tab
Quant. – maximum quantity of frames the network device can process
without loss.
Max, s – maximum time interval during which the network device can
process the traffic without loss.
10.7 Y.1564 Method
10.7.1 Y.1564 Test Description
Note: “Y.1564 test” is Tester option 08-Y1564.
Y.1564 is a modern method of Ethernet service activation. Methodology of
the test is divided in two parts: service configuration test helping to find and
correct problems of network configuration and service performance test
confirming eligibility for acceptance and service and its permanence in time.
Y.1564 method describes the script of Ethernet channel automated test
procedure without operating traffic and taking into consideration multi-service
network with simultaneous measurement of different services’ (streams’)
parameters.
MAKS-EMK tester allows running two simultaneous tests in accordance
with Y.1564 method launching up to four streams at each port.
Configuration test - the test assesses guaranteed throughput, exceeded
throughput, the throughput value exceeding of which will cause frame loss,
frame loss quantity, frame loss ratio, latency and packet jitter.
Performance test – the test is destined to assess frame loss and channel
availability ratio.
10.7.2 Test Y.1564 Settings
“UNI” Tab
All parameters are defined in accordance with interface settings of the
current port.
Speed – the set data speed between the tester and DUT.
Duplex – the established duplex mode between the tester and DUT.
Interface Type – type of the physical interface established between the
tester and DUT.
“Header” Tab
The tab contains settings fields similar for all tests with traffic generation
(refer to Paragraph 10.5.3.).
To set frame header for a stream, select the required stream in “Stream #
X” field. To change stream number use “Enter” or “Left” and “Right” keys.
“Streams” Tab
Stream # Х – selection of a stream for its configuration. To change the
number of the stream, use “Enter” or “Left” and “Right” keys.
Active – when the field is marked, the selected stream will be involved in
the test.
Packet length, b – packet length in bytes generated for the selected
stream during the test
“SLA” Tab
Stream # Х – selection of a stream for its configuration. To change the
number of the stream, use “Enter” or “Left” and “Right” keys.
Units – selection of units in which “CIR” and “EIR” field values for the
selected stream will be entered.
CIR – value of maximum guaranteed throughput for the current stream for
the criterion of configuration and productivity tests pass.
EIR – value of maximum permissible CIR exceeding for the criterion of
configuration and productivity tests pass.
M – maximum permissible exceedance of CIR+EIR value.
Units – selection of units in which “CBS” and “EBS” field values for the
selected stream will be entered.
CBS – value of guaranteed load for the current stream. This parameter
shows maximum number of transmitted test traffic bytes CIR conditions being
satisfied
EBS – value of maximum permissible load for the current stream.
FLR – maximum permissible value of frame loss ratio for the current
stream for the criterion of configuration and productivity tests pass.
FTD, ms – maximum permissible latency for the current stream in ms for
the criterion of configuration and productivity tests pass.
AVAIL, % – minimum value of channel availability expressed as a
percentage of total productivity test time for the criterion of productivity test
pass.
FDV, ms – maximum permissible packet jitter value for the current stream
for the criterion of configuration and productivity tests pass.
“Advanced” Tab
Learning Int, ms – waiting time in milliseconds after sending a Learning
frame or an ARP request and before transmission of test frames starts;
Wait Interval, ms – time in milliseconds during which Tester awaits the
sent test frames return from the network.
Configuration test – marking of this field permits running of configuration
test.
Test step, s – trial duration at each step of configuration test.
Step load – marking of this field permits running of configuration test in
four stages with load values of 25%, 50%, 75% and 100% from CIR.
Policy – marking allows running of Policy test.
Performance test – marking allows running of Performance test.
Duration – time duration of performance test set in “hh:mm:ss” format
10.7.3 Test Y.1564 Statistics
“Y.1564” test menu is illustrated in Figure 10.7.
Test menu contains two functional keys:
Start/Stop – test start and stop.
Sett. – access to test settings.
During the test, its results are displayed in tables whose fields are filled in
automatically as the test runs. The tabs contain the following common fields:
Elaps. – time from the beginning of the test
Estim. – time until the end of the test
Stream #Х – selection of a stream to see its test results.
Figure 10.7 Y.1564 Test
Service Configuration Test Statistics
Configuration test statistics includes three tabs: “Rate IR”, “FL Loss”,
“FTD Latency”, “FDV Jitter”. They all have mutual “Test” that contains of
the following lines:
CIR1* – the field displays the first step of CIR test equal to 25% of the CIR
value set in “SLA” tab.
CIR2* – the field displays the first step of CIR test equal to 50% of the CIR
value set in “SLA” tab.
CIR3* – the field displays the first step of CIR test equal to 75% of the CIR
value set in “SLA” tab.
CIR4 – when “Step Load” is marked, this field will display the fourth step of
CIR test equal to unmarked CIR value set in “SLA” tab.
CIR+EIR – the field displays trial stage with CIR+EIR load.
Policy – the field displays trial stage of Policy test with the load exceeding
CIR+EIR.
To the left of “Test” column, status icon indicating current status of the test
is displayed. Icon values are described in Paragraph 10.5.1.
If errors in CIR or CIR+EIR trials occur, “Y.1564” test will stop.
* Note: Unless marked, “Step Load” field will be deactivated.
** Note: The user can consider the test successful if average value of the
measured parameter is less than the value specified in test settings.
In the tables of “Rate IR”, “FL Loss”, “FTD Latency” and “FDV Jitter”
tabs, values of all the measured parameters are displayed for “Test” column of
the selected stream.
“Rate IR” Tab
Min. – the column shows minimum measured throughput values.
Avr. – the column shows average measured throughput values.
Max. – the column shows maximum measured throughput values.
“Frame Loss FL ” Tab
Count – the column displays quantity of lost frames.
FLR – the column displays frame loss ratio (FLR).
“Frame Delay FTD ” Tab
Min. – the column displays minimum measured latency values.
Avr. – the column displays average measured latency values.
Max. – the column displays maximum measured latency values.
“Jitter FDV” Tab
Min. – the column displays minimum measured values of packet jitter.
Avr. – the column displays average measured values of packet jitter.
Max. – the column displays maximum measured values of packet jitter.
Performance Test Statistics
Performance Test Statistics tab includes two tabs: “Performance page
#1” and “Performance page #2”. Performance test shall be considered
successful if values of the measured parameters are within the allowance
specified in its settings.
Productivity test status is displayed above “Stream #X” field. It shows
current status of the test and can be as follows:
− OK – test passed successfully;
− Wait – test has not started yet;
− Runnin – test is running at the moment;
− Stop – test was stopped;
− Off – test is disabled;
− Error – test was unsuccessful;
− NS – no line synchronization/ line synchronization loss during test;
− No Тх – no test traffic transmission;
− No Rx – no test traffic reception;
− RxTx – amount of received test frames exceeds the amount of
transmitted test frames. It reports problems of network equipment the
current measurement interface of the tester is connected to.
To the left of the status, status icon indicating current status of the test is
displayed. Icon values are described in Paragraph 10.5.1.
All the measured parameter values for the selected stream are presented
in tabular form in “Performance page #1” and “Performance page #2” tabs.
“Performance page #1” Tab
Parameter – Performance Test column consisting of the following
parameters:
− FL – the field displays measured quantity of lost frames;
− FLR – the field displays measured value of frame loss rate;
− AVAIL – the field displays line availability time in seconds;
− AVAIL,% – the field displays value of line availability rate expressed as a
percentage of total test time;
− Value – the column displays values of measured parameters.
“Performance page #2” Tab
Parameter – Productivity Test column consisting of the following
parameters:
− IR, Mbps – the field displays measured throughput value;
− FTD – the field displays measured latency value;
− FDV – the field displays measured packet jitter value;
− Min. – the column displays minimum values of measured parameters;
− Avr. – the column displays average values of measured parameters;
− Max. – the column displays maximum values of measured parameters.
Parameter column fields contain round indicators showing current test
status. The indicators can be as follows:
−
−
−
−
Green – measurement successful;
Yellow – waiting for beginning of measurement;
Red – measurement unsuccessful***;
White – productivity test is disabled****.
*** Note: If measured value of frame loss ratio exceeds the maximum
permissible value specified in test settings, measurement of “FL” and “FLR”
parameters should be considered unsuccessful. If measured value of line
availability ratio is less than minimum permissible value specified in test
settings, measurement of “AVAIL” and “AVAIL,%” parameters should be
considered unsuccessful. If measured average value of latency exceeds the
maximum permissible value specified in test settings, measurement of “FTD”
parameter should be considered unsuccessful. If measured average packet
jitter value exceeds the maximum permissible value specified in test settings,
measurement of “FDV” parameter should be considered unsuccessful.
**** Note: “Performance Test” field is not marked. If this case, all Productivity
Test parameters specified on tabs “Performance page #1” and
“Performance page #2”will be turned off.
10.8 Multistream
Note: “Multistream” test is Tester option 08-MS.
“Multistream” test is used for simultaneous generation of traffic containing
frames with different characteristics.
10.8.1 “Multistream” Test Settings
“Header” Tab
The tab contains settings fields similar for all tests with traffic generation
(refer to Paragraph 10.5.3.).
To set frame header for a stream, select the required stream in “Stream #
X” field. To change stream number use “Enter” or “Left” and “Right” keys.
“Advanced” Tab
Duration – test duration in “hh:mm:ss” format. If the value equals zero, the
test will run endlessly.
Stream #Х – selection of a stream for its configuration.
Active – if the field is marked, the current selected stream will be used in
the test.
Load type – this parameter is not used. The test generates constant load.
Units – selection of units in which “Load” field value for the selected
stream will be entered.
Load, ms – load value for the selected stream.
Packet length, b – packet length in bytes generated for the selected
stream during the test.
10.8.2 “Multistream” Test Statistics
“Multistream” test statistics menu is shown in Figure 10.8.
Test menu contains the following two functional keys:
Start/ Stop – test activation and deactivation.
Sett. – access to test settings.
Figure 10.8 “Multistream” Test
The following fields are displayed in “Measurements” field:
Elaps. – time elapsed since “Multistream” test launch.
Estim. – time to the end of “Multistream” test.
Load – value of generated stream load.
Тх frames – number of transmitted frames in the selected stream.
Rx frames – number of received frames in the selected stream.
Тх byte – number of transmitted bytes in the selected stream.
Loss Frame* – number of lost bytes in the selected stream equal to the
difference between transmitted bytes number and received bytes number. It is
displayed in “Number” column. Frame loss ratio is displayed in “Ratio” column.
*Note: during the test, “Loss” field may display a nonzero value even if no
frames have been lost. This can be explained by channel latency and
sender/receiver buffer latency.
Latency – the measured average latency value of the selected stream (if
test was successful). During test run the field displays current measured
latency value.
Status of the specific stream is displayed under “Stream #X” field. It shows
current status of the stream and can be as follows:
− OK – test passed successfully;
− Runnin – test is running at the moment;
− Stop – test was stopped;
− Off – test is disabled;
− Error – test was unsuccessful;
− NS – no line synchronization/ line synchronization loss during test;
− No Тх – no test traffic transmission;
− No Rx – no test traffic reception;
− RxTx – amount of received test frames exceeds the amount of
transmitted test frames. It reports problems of network equipment the
current measurement interface of the Tester is connected to.
To the left of the status, an icon indicating current status of the test is
displayed. Icon values are described in Paragraph 10.5.1.
10.9 Packet Jitter
RFC 3393 defines packet jitter as a delay difference between transmission
of two packets. MAKS-EMK Tester allows measuring packet jitter distribution
within the range from zero to the upper user-set limit.
10.9.1 Packet Jitter Test Settings
“Header” Tab
The tab contains setting fields similar for all tests with traffic generation. For
its description see paragraph 10.5.3.
“Advanced” Tab
Load – shows the tested load value in %
Pack. length, b – length of the generated frames expressed in bytes.
Duration – time duration of the test set in “hh:mm:ss” format.
Threshold, ms – jitter value expressed in microseconds used as the upper
limit for jitter distribution.
10.9.2 Packet Jitter Test Statistics
“Report” Menu of “Packet Jitter” test is illustrated in Figure 10.9.
“Report” Tab
The tab displays general test results:
Elaps. – time to the end of test.
Estim. – time since test launch
Rx. pack.:
all – amount of received frames.
in order – amount of frames sent and received in the same order,
expressed numerically and as a percentage of general frames amount.
not in orde – amount of frames received in an inversed order as against
the order they were sent expressed numerically and as a percentage of
general frames amount.
Figure 10.9 Packet Jitter Testing
“Distribution” Tab
Jitter, ms – this column shows ranges of the ten intervals jitter values of the
received packets fall within. These intervals are formed by division of the
“Threshold” value into ten equal parts.
“%” – this column shows number of frames with jitter whose value has
fallen within this range, expressed in a percentage of sent frames general
number *.
Note: Packets that arrived out of turn do not come into account. So if it
happens, total distribution value may be less than 100%.
Graph/Table – test results display as a graph or a table.
10.10 РТР Time Synchronization Testing
Note: “PTP” testing is Tester option 08-PTP.
IEEE1588-2008 PTP standard sets Ethernet model and protocol of time
synchronization. The Tester can be configured as a PTP slave device to
connect with available PTP master servers and implement time
synchronization as well as measure such protocol parameters as packet
quantity, one-way and average latency, packet jitter and others.
“РТР” test can be launched from Port A only.
10.10.1 PTP Test Settings
“РТР Settings” Menu
External Clock Setting – this mode is not used.
Unicast – mark this field to select unicast (single-address) mode of PTP
synchronization with servers.
Multicast – mark this field to select multicast (multi-address) mode of PTP
synchronization with servers.
Duration – time duration of the test set in “hh:mm:ss” format. If its value
equals zero, the test will run endlessly.
Domain auto detection – marking of the field sets the mode allowing autoidentification of the domain.
Domain – selection of the domain for work in manual mode
IP PTP Master – field for entering IP address of master device for work in
unicast (single-address) mode. When working in multicast (multi-address)
mode, the field is blocked.
When the required parameters have been set, enter PTP Server List
menu by clicking Select button.
PTP Server List menu by clicking Select button
The menu consists of 10 lines displaying data on PTP servers found on the
network. To select a server, place the cursor in the required line containing
server information and press “Done”.
During multi-address operation, the server selected according to BMCA
algorithm will be displayed as "BMCA” in “Number” field.
10.10.2 PTP Test Statistics
“PTP” test menu is illustrated in Figure 10.10.
“PTP” menu contains three tabs: “Information”, “Statistics” and
“Measurements”.
Figure 10.10 PTP Time Synchronization
“Inform” Tab
The tab displays parameters of the selected PTP server:
Message Interv – interval between Announce messages.
IP address – IP address of PTP server.
ID – unique 64 bit PTP server identifier displayed in two lines.
Port Number – refer to IEEE1588 standard describing PTP.
Domain – the domain into which PTP master device is included.
PTP version – protocol version. It can assume values 1 or 2.
Clock Class – this parameter defines qualitative technological accordance
of the PTP master device.
Clock Accuracy – this parameter sets minimum time interval
characterizing accuracy of time measurement. It is used for defining the best
one of the found PTP master devices for BMCA algorithm.
Time Source – information parameter displaying number of the category
the time source used by PTP Master belongs to in accordance with IEEE 1588
(see Annex A, Table А.8).
Priority 1 – referential attribute specified in PTP server settings and used
in BMCA (the less the value, the higher PTP server priority). Parameter value
must belong to the range from 0 to 255.
Priority 2 – referential attribute specified in PTP server settings and used
in BMCA (the less the value, the higher PTP server priority). It is used in case
selection of the best Master according to basic parameters failed. Parameter
value must belong to the range from 0 to 255.
“Statist” Tab
Values column of the table displays sum counters of PTP packets at
reception and transmission and single message counters.
Rx frames – all PTP packets received from the server.
Announce –“Announce” packets received from PTP server.
Sync – “Synchronization” packets received from PTP server.
Follow Up – packets with first time stamp received from PTP server.
Delay Resp – packets with third time stamp received from PTP server.
Tx Frames – all PTP packets sent to the server.
Delay Req – PTP packets with second time stamp sent to the server.
“Measuring” Tab
The tab displays values of the parameters measured according to PTP:
Elaps. – time from the beginning of PTP test
Estim. – time until the end of PTP test
Tms – time delay between PTP master and slave devices showing the
difference between the time of Sync message reception by PTP slave device
and the time of the message sending by master device.
Tsm – time delay between PTP master and slave devices showing the
difference between the time of Delay Request message reception by PTP
master device and the time of the message sending by slave device.
T average – average delay between PTP master and slave devices.
Offset – divergence between PTP master and slave devices’ time scales
after first synchronization.
Sync PDV – packet jitter calculated according to Sync messages.
10.11 TCP/IP Utilities
10.11.1 Ping test
Ping test is used to check achievability of a certain network node. Frame
receiving device, if able to, responds to the ping request sent according to
ICMP so that the user could count round-trip delay. Frame loss percentage is
also determined. “Ping test” menu is illustrated in Figure 10.11.1.
Figure 10.11.1 Ping test
Test result is presented in tabular form. The table shows data on the six
latest ping requests as well as statistics on the latest test time slot. The first
table column indicates ping request number. The second one shows ping
request status that can take the following forms:
− Request – ping request was made, but the response message has
not been received yet;
− OK – ping request was responded correctly;
− TimeOut – wait time is over;
− Intrpt – wait time for the latest ping request was interrupted by the
user.
The third column displays sent frame payload value in bytes. The fourth
column shows round-trip propagation delay.
Ping settings
IP address - destination address, address of the device ICMP-packets are
sent to in order to check its achievability;
Packet size - packet size in bytes; for networks not supporting jumbo
frames maximum ICMP-packet payload size is equal to 1472 bytes;
Wait time, ms – ping response wait time (in ms).
Ping Statistic
In accordance with ping test results, the following measured parameters
are displayed:
Sent - sent frames amount;
Received - received frames amount;
Lost - lost frames amount;
Latency
Average - average latency in ms;
Min- minimum latency in ms;
Max - maximum latency in ms.
10.11.2 Traceroute
“Traceroute” test determines frame route in TCP/IP networks. Information
on all intermediate routers a frame passes through on its way to the end node
is shown in the table formed during test run. “Traceroute” menu is illustrated
in Figure 10.11.2.
Test result is presented in tabular form. The table shows intermediate node
data. The first table column indicates intermediate node number. The second
column indicates intermediate node IP address. If wait time is over, the line will
display “timeout”* message. The third column indicates node response
latency. The table is navigated page by page using “Up” and “Down” arrow
keys.
* Note: Many network nodes block ability to respond to ICMP frames. In such
cases, “timeout” message is displayed.
Figure 10.11.2 Traceroute test
Trace Settings
IP address – destination IP address, end node IP address.
Packet size – packet size in bytes.
Wait time, ms – intermediate network node response time.
10.11.3 DNS
DNS (Domain Name System) stands for a distributed system providing
information on domains. This function allows getting host IP address by its
domain name.
“DNS” menu is illustrated in Figure 10.11.3.
DNS Test Settings
Domain name – domain name according to which DNS request will be
made
Status – current test status
Domain IP – received domain IP address
Figure 10.11.3 DNS
“Status” field during DNS test may be as follows:
− Passed – test was OK and DNS request was responded
− In progress – DNS request was made, test is awaiting response
− Timeout – error at test launching (wrong domain name, etc.)
− “ ” – test has not been launched.
10.11.4 IP Scanner
IP Scanner feature is designed for detection of network IP addresses
responding ARP queries.
“IP Scanner” menu is illustrated in Figure 10.11.4.
Test results are presented in a table showing information on network
nodes. The first column indicates node number, the second column – its IP
address.
Figure 10.11.4 IP Scanner
IP Scanner Test Settings
First Address – network scanning starts with this IP address
Last Address – network scanning finishes with this IP address
Packet size – length of ARP-request frame in bytes
wait time, ms – waiting time for a reply to the ARP-request from network
node expressed in milliseconds
Iteration – quantity of ARP-requests sent to one network node
10.12 Copper Cable Diagnostics
Cable diagnostics is performed in two stages: quality test and
determination of twisted pair parameters. Cable quality test is based on
breakage diagnostics reflectometric technique that includes distance to fault
measurement and cable/plugs fault type definition. Cable quality test is run
without in-line synchronization and that is why Link LED extinguishes during
this test. Each TP of RJ45 connector (1-2, 3-6, 4-5, 7-8) is tested separately.
“Copper Cable Diagnostics” menu is illustrated in Figure 10.12.
Figure 10.12 Copper cable diagnostics
Cable quality test results displayed in “Status” field may be as follows:
− good – the cable is OK and is connected to the line;
− fault – test not passed*;
− open – the pair is open;
− short – SC of the pair;
− fair – fair/ satisfactory**.
Leng.,m – distance to SC or breakage, or to impulse reflection point (when
“Status” field displays “fair”). If SC or line breakdown happens, distance to
failure will be determined by means of reflectometric technique with the
accuracy of +/-1 m. In other cases, cable length is measured with the accuracy
of up to 10 m.
Channel*** – MDI or MDI-X channel (see Table А.7, Appendix А).
Polar. – TP polarity. It can take on the following values: positive “+” or
negative “-”.
Lat., ns – selected TP skew latency due to length difference of separate
pairs. It shows differential latency of the specified TP with reference to the
shortest TP. Measuring inaccuracy is 8 ns.
* Note: if during remote point test burst mode of the line was enabled (100
Mbps with no self-matching) and it was not automatically desynchronized.
** Note: the TP is not short-circuited or broken but the reflected signal
amplitude is low because of plugs/sockets contact fault (as an example).
*** Note: straight-through cable is self-matched according to MDI-MDIX
pattern, crossover cable - according to MDI-MDI or MDIX-MDIX pattern.
TP parameters are determined when line is synchronized.
10.13 Optical Test
This feature provides display of information on SFP modules basic
characteristics and real-time parameter monitoring.
“Optical Test” menu is illustrated in Figure 10.13.
Figure10.13 Optical Test
“Information” Tab
Information on SFP modules inserted into ports A or B is displayed on the
screen. To switch between the ports, set the cursor in “SFP module A(B)”
line and select port A or B using “Left” and “Right” keys.
The following information is displayed on the menu:
Vendor – SFP module vendor. When no modules are installed, the field
will indicate “No SFP module”.
Serial number – SFP module serial number according to vendor’s
nomenclature
Revision – version of the module according to vendor’s nomenclature
Date – date of manufacture
Part number – number of module batch according to vendor’s
nomenclature
Wave length – operating wavelength of SFP module in nm.
“Monitoring (DDM)”* Tab”
The feature provides monitoring of input and output optical power
parameters and temperature inside the SFP module.
Test results are presented in a table whose fields are filled automatically
during test run. To switch between the ports, set the cursor in “SFP module
A(B)” line and select port A or B using “Left” and “Right” keys.
Temperature – current value of temperature inside the SFP in ºС
RX power – current measured value of optical signal input power in mW
and dBm
TX power – current measured value of optical signal output power in mW
and dBm.
*Note: Not all SPF modules support digital parameter control feature.
10.14 Remote ОАМ Management
ОАМ protocol functions allow MAKS-EMK Tester displaying information on
remote point supported modes and also activate loopback mode at a remote
point.
“ОАМ” menu is illustrated in Figure 10.13. It includes the following
settings:
Figure 10.14 Remote ОАМ management
ОАМ mode – ОАМ mode selection for this port may be as follows:
- Active – port can respond OAM commands of remote devices, it regularly
sends OAM discovery commands and it can activate Layer1 loopback mode at
a remote device.
- Passive – port can only respond to remote devices’ OAM commands
- Off – function is switched off
“Remote Control” tab - displays remote point operation modes and
settings. It contains the following fields:
МАС-address – МАС address of the discovered remote device
Vendor – remote device unique identifier
Remote LB – activation of loopback mode by a remote device
ОАМ mode remote – remote device ОАМ mode. See description above.
unidirectional – remote device unidirectional connection
Link Events – notifications of remote device connection errors.
If the remote device supports Loopback activation function, Loopback can
be activated /deactivated using “Start” and “Stop” buttons.
Note: it is necessary to deactivate OAM function at the port generating test
traffic or enable its passive mode before running tests with traffic generation.
10.15 BER Test
10.15.1 BER Test Description
BER test represents Layer 1 test allowing the user to check a channel for
bit errors. Bit Error Rate (BER) is equal to a ratio of received erroneous bits to
the total bits received.
BER test is not suitable for testing of network sections containing Layer 2
and Layer 3 network equipment because it may cause packet loss.
When a network section looped up according to Variant A (see Figure
10.4.1) is tested, it is necessary to activate Layer 1 loopback at the remote
point.
“BERT” menu is illustrated in Figure 10.15
Figure 10.15 BER test
The following fields are displayed on test status menu:
Elaps. – time from the beginning of BER test
Estim. – time until the end of BER test
Rx bit – amount of received bits
Rx Ebit – amount of received erroneous bits
BER – ratio of received erroneous bits to total bits received
LSS – amount of seconds without pattern synchronization
LOS – amount of seconds without line synchronization
LSS,%% – ratio of time with no test pattern synchronization to elapsed time
LOS,%% – ratio of time with no line synchronization to elapsed time
10.15.2 BERT Settings
The following fields are displayed on Settings menu:
Pattern type – pattern type selection: user pattern specified in User
11
15
20
23
29
31
Pattern field, PRBS 2 − 1 , 2 − 1 , 2 − 1 , 2 − 1 , 2 − 1 , 2 − 1 , CRTP.
User Pattern – 32 bits of user pattern
Frame size – frame size in bytes
Units – units in which load value is set: % or bps
Load, % – load value in % or bps.
Duration – time duration of the test set in “hh:mm:ss” format. If its value
equals zero, the test will run endlessly.
Offset, bytes – offset value in bytes after Preamble field. After Preamble
field text sequence can be inserted.
10.16 Testing of MDI IPTV Video Data Transmission
Note: “MDI” test is Tester option “08-IPTV”.
MDI test can be used as a primary diagnostics tool and quality indicator of
video data transmission. The test corresponds to RFC 4445 recommendation
and uses two test features: Media Loss Rate (MLR) and Delay Factor (DF).
“MDI Test” menu is illustrated in Figure 10.16.
Figure 10.16 MDI Test
10.16.1 MDI Test Settings
“UNI” Tab
All parameters are defined in accordance with interface settings of the
current port.
Speed – the set data speed between the tester and DUT.
Duplex – the established duplex mode between the tester and DUT.
Interface Type – type of the physical interface established between the
tester and DUT.
“Header” Tab
The tab contains settings fields similar for all tests with traffic generation
(refer to Paragraph 10.5.3.).
“Advanced” Tab
Duration – time duration of the test set in “hh:mm:ss” format. If its value
equals zero, the test will run endlessly.
Units – selection of units in which Load is displayed.
Load, % – load value
Threshold FLR – if this threshold is exceeded, the test will be considered
failed.
Packet length, b – packet length in bytes generated during the test
Learning Int., ms – waiting time in microseconds after sending a Learning
frame or an ARP request and before frames transmission starts.
10.16.2 MDI Test Statistics
The following fields are displayed in test statistics menu:
Elaps. – time elapsed since “MDI” test launch.
Estim. – time to the end of “MDI” test.
DF – delay factor. The coefficient is constantly being verified during the
test.
MLR – media loss rate. Takes account of lost frames and frames received
in no particular order. The coefficient is constantly being verified during the
test.
Rx Frames – received frames amount.
Vrx – average value of test traffic rate at reception calculated for Layer 4
during the last second.
10.17 Loopback Testing
Tester is connected to a network or a network device according to the
diagram presented in Figure 10.17. MAKS-EMK allows activation of two
independent loopbacks at both USB ports or loopback activation at one port
and any other available function at the second one.
10.17.1 Loopback Settings, “Common” Tab
“Loopback” function allows testing a network without changing its
settings. Such a test can be run at different OSI Layers:
− at physical layer: all incoming frames are looped back inversely. At that,
their structure does not undergo any changes.
− at data link layer: incoming frames are looped back inversely. It is
possible to activate algorithm of source and destination MAC address
swapping and algorithm of MAC address shifting at loopback. Frames
containing identical source and destination MAC field data, OAM frames,
ARP requests and multicast frames are hard filtered at reception and are
not looped back inversely.
− at networking layer: incoming frames are looped back inversely. It is
possible to activate algorithm of source and destination IP address
swapping at loopback. When network Layer loopback is activated,
settings of the above mentioned swapping and shifting algorithms at data
link Layer will also be effective.
Status – selection and activation of the Layer to be looped back. You can
change the mode by means of Enter key and Left and Right arrow keys. The
field may look as follows:
Off – deactivation of “Loopback” function.
Layer 1 – physical loopback activation.
Layer 2 – data link loopback activation.
Layer 3 – networking loopback activation.
Layer 4 – transport loopback activation.
Press “Set” button to change mode.
When loopback at any layer is activated, layer settings will be blocked and
available in view-only mode.
Figure 10.17 Loopback Mode Connection Diagram
10.17.2 Second Layer Loopback Settings
If “Replace MAC” is not marked, Layer 2 loopback activation will lead to
automatic swapping of source and destination MAC address frame fields.
Replace MAC – marking of “Source” and “Destination” fields results in
swapping of source and destination МАС addresses of the received frames for
source and destination МАС addresses specified in the corresponding fields.
Source – specifies new source MAC address.
Destination – specifies new destination MAC address.
VLAN – marking activates VLAN-VID swapping. VID field of the received
packet is swapped for the value from the corresponding field.
Priority – swapping of transmitted traffic priority (IEEE 802.1p standard).
PCP field of the received packet is swapped for the value from the
corresponding field.
10.17.3 Third Layer Loopback Setting
If “Replace IP” is not marked, Layer 3 loopback activation will result in
automatic swapping of source and destination fields of IP address frame.
Replace IP – marking of “Source” and “Destination” fields results in
swapping of source and destination IP addresses of the received frames for
source and destination IP addresses specified in the corresponding fields.
Source – specifies new source IP address.
Destination – specifies new destination IP address.
ToS/Precedence – marking activates swapping of ToS field with QoS
parameters. Marking of this field blocks DSCP installation and its value is
disregarded. Refer to RFC 791 for detailed field description. ToS field bit
names are listed in Appendix А, Table А.1.
ToS – this field specifies new value of ToS byte Т0-Т3 bits. It is displayed
in binary form and may assume the following values: 0000, 0001, 0010, 0100,
1000.
Precedence – specifies new value of ToS byte Р0-Р2 bits. It can assume
values from 0 to 7. Correspondence of precedence names and their values are
shown in Appendix А, Table А.2.
Replace DSCP – marking of this field activates swapping of DSCP field
with QoS parameters and blocks ToS/Precedence installation and its value is
disregarded. DSCP field bit names are listed in Appendix А, Table А.3. The
field may assume values from 0 to 64, it displays 6 uppermost DS0-DS5 bits of
the corresponding frame header byte in binary form. Alphabetic abbreviation
(refer to RFC 2474 and RFC 2597 for more detailed information) is also
displayed. Correspondence of DSCP names with their values are shown in
Appendix А, Tables А.4 and A.5.
10.18 Thru Mode
“Thru” mode allows optical/electrical Ethernet traffic monitoring and
analysis. You should connect MAKS-EMK to the gap between two network
sections or two network devices as illustrated in Figure 10.18. At that, the
traffic received from port A will be forwarded to port B and the traffic received
from port B will be forwarded to port A. “Thru” mode can also be used to
convert one Ethernet standard into another. Thus, you can convert optical
1000BASE-X Ethernet into electrical 1000BASE-T Ethernet and others.
Statistics on received and transmitted frames is displayed on “Statistics”
menu. If connection speed values of two ports differ, frame loss during
transmission from the port with higher connection speed to the one with lesser
speed will be acceptable.
Reception and transmission speeds at both ports in “Thru” mode are
displayed in “Statistics” menu.
To activate “Thru” function, mark the corresponding menu option (see
Figure 10.2).
Figure 10.18 “Thru” mode connection diagram
10.19 Statistics
Tester collects statistics on the received and transmitted frames. Statistics
information is sorted as to Layers, frame types, frame sizes and erroneous
frames. “Statistics” menu appearance is illustrated in Figure 10.19.
Figure 10.19 Statistics
10.19.1 “Statistics” Menu Options
“Common” Tab
Fields display received and transmitted data for ports A and B expressed in
bytes and frames.
Rx Frames – amount of received frames
Tx Frames – amount of transmitted frames
Rx byte – amount of received bytes
Tx byte – amount of transmitted bytes
Auto clear – when marked, all statistics information will be reset each time
a new test with traffic generation is launched (RFC 2544, Y.1564, Traffic test,
Packet jitter, Multistream, BERT).
To reset all accumulated statistics values, press “Reset” button.
To save a statistics report, press “Save” button, enter file name and press
“Save” again.
“Speed” Tab
V L1 – Layer 1 reception and transmission speed for both ports in bps;
V L2 – Layer 2 reception and transmission speed for both ports in bps. Its
values can be interpreted as instantaneous values of data reception and data
transmission speeds without regard to preamble, interframe gap and start
frame delimiter.
Maximum Layer 2 speed at interfaces is calculated by the following
formula:
V i= V f ×
S
( S + P+ SFD+ IFG ) , where
Vi
– information rate;
f
– connection speed (1000 Mbps, 100 Mbps, 10 Mbps);
S – frame size;
P – preamble (7 bits);
SFD – start frame delimiter (1 bit);
IFG – interframe gap (12 bits).
V
V L3 – Layer 3 reception and transmission speed for both ports in bps.
“Frame Types” Tab
Broadcast – broadcast frames
Multicast – multicast frames
Unicast – unicast frames
Pause – pause frames
Rx A – amount of frames received at port A
Tx A – amount of frames transmitted at port A
Rx B – amount of frames received at port B
Tx B – amount of frames transmitted at port B
“Frame Sizes” Tab
size – frame size (in bytes)
Rx – received frames amount
Tx – transmitted frames amount
In order to see statistics on another port, enter the tab using Enter key and
select the required port using “Left” and “Right” arrow keys.
“Frame Errors” Tab
CRC – amount of received frames with checksum error
Runts – amount of received frames of less than 64 bytes in length with
correct checksum
Jabber – amount of received frames of more than 1518 bytes in length with
checksum error.
10.20 Memory
MAKS-EMK Tester is equipped with embedded non-volatile 488-records
memory used for saving settings and test results. “Memory” menu contains
two tabs: “Settings” and “Results”. Settings menu is illustrated in Figure
10.20.
“Settings” Tab
To save current test and interface settings, place cursor in “Curent” line
and press “Save”. Then, enter record name and press “Save”.
To upload or delete previously saved records, position the cursor in the line
containing the required record and press “Load”, “Delete” or “Del. all”.*.
“Results” Tab
Result saving window appears each time the user presses “Menu” button
after a test finishes. To save results of the performed test, enter file name and
press “Save”. To cancel saving, the user is to press “Cancel” button. Saved
entries are displayed on “Results” tab of “Memory” menu.
To upload or delete previously saved entries, position the cursor in the line
containing the required record and press “Load”, “Delete” or “Del. all”.*
*Note: When tests are running it is impossible to upload settings or results
from the memory. You have to discontinue all tests first.
Figure 10.20 Memory
10.21 Interface Settings
“Interface Settings” menu displays settings of measurement ports A and
B and remote management port with an RJ-45 connector denoted as follows:
.
“Interface Settings” menu is illustrated in Figure 10.21.1.
Figure 10.21.1 Interface Settings
“Interface Settings” menu opens access to the menu containing settings of
each port.
Settings menu is illustrated in Figure 10.20.2.
Figure 10.21.2 “Interface Settings” menu, “Common” tab
“Interface Settings” menu of each port contains four tabs: “Common
Port А(В)”, “VLAN Port А(В)”, “MPLS Port А(В)” and “Packet Filter Port
А(В)”.
“Common Port А(В)” tab
Speed – data transmission speed selection. When “10”, “100” and “1000”
options are marked, connection will be configured automatically at the highest
possible speed. If only one option is marked, connection will be forcedly
configured for the selected speed *. Unmarking of all fields activates speed
field markings of the current port.
Duplex – half duplex (“HDX”) or full duplex (“FDX”) mode selection.
Mark one or both fields.
MAC Address – MAC address of the configured port **: A, B or LAN. The
tester has a default base of MAC addresses for all ports from the range
reserved by the manufacturer but any address can be edited manually.
DHCP*** – as soon as this function is activated, port IP address, subnet
mask and other parameters will be received automatically from DHCP server.
IP Address – subnet IP address
Subnet Mask – subnet mask
Gateway – subnet gateway
Settings are applied after pressing “Set” button. The button appears when
current commons settings are changed.
* Note: When Tester is connected optically via SFP modules, transmission
speed is always selected automatically and is equal to 1,000 Mbps regardless
of any marked options.
** Note: New MAC address of the port will be valid only after Tester
reloading.
**** Note: If Loopback function is activated at the actual interface, DHCP
will not run. In order to activate it, you will first have to deactivate Loopback
and receive DHCP settings.
“VLAN Port A(B)” Tab
VLAN**** – VLAN parameters activation/deactivation (according to IEEE
802.1q and IEEE 802.1p standards). Assumes values equal to the number of
VLAN tags (from 0 to 3) to be inserted into frame. If the value is equal to zero,
traffic will be generated without VLAN. To change quantity of VLAN tags, press
“Right” and “Left” keys.
TPID – tag protocol identifier
PCP – transmitted traffic Precedence (for IEEE 802.1p standard)
VID – 4 bytes long VLAN identifier; values can be set within the range of
0…4095.
**** Note: One VLAN tag takes up 4 bytes. When VLAN is on, minimal
lengths will make up 68 bytes for one VLAN tag, 72 bytes – for two VLAN tags
and 76 bytes – for three VLAN tags because of frame tag fields lengthening. If
a lesser frame sizes is set, an error report will be displayed. RFC 2544 test
with default frame size values (i.e. 64 bytes and more) will not run.
“MPLS Port A(B)” Tab
Note: MPLS Settings are Tester options “08-MPLS”.
MPLS* – MPLS parameters activation/deactivation. Assumes values equal
to the number of MPLS tags from 0 to 3. If the value is equal to zero, traffic will
be generated without MPLS tags. To change the amount of MPLS tags, press
“Right” or “Left” keys.
Value – tag value
QoS – class of packet service
TTL – packet lifetime
*Note: One MPLS tag takes up 4 bytes.
Simultaneous activation of VLAN and MPLS tags leads to cumulative frame
length increase.
When MPLS tags are active, minimal lengths will make up 68 bytes for one
MPLS tag, 72 bytes – for two MPLS tags and 76 bytes – for three MPLS tags
because of frame tag fields lengthening. If lesser frame sizes are set, an error
report will be displayed. RFC 2544 test with default frame size values (i.e. 64
bytes and more) will not run.
“Packet Filter Port А(В)” Tab
Packet filtering parameters are set on this tab. It is acceptable to select
several filtering variants. Packets satisfying the conditions of filtering will come
into account in test results.
MAC Dest. – marking enables packet filtering as per the set destination
MAC address. At that, only packets satisfying the condition will be accounted
in test results.
MAC Source = MAC Dest. – marking enables filtering of packets with
similar source and destination MAC addresses. At that, packets satisfying the
condition will be deleted from test results.
IP Dest. – marking enables packet filtering as per the set destination IP
address. At that, only packets satisfying the condition will be accounted in test
results.
IP Source = IP Dest. – marking enables filtering of packets with similar
source and destination IP addresses. At that, packets satisfying the condition
will be deleted from test results.
VLAN ID 1 – marking enables filtering of packets as per the set identifier of
the first VLAN tag. At that, only packets satisfying the condition will be
accounted in test results.
VLAN ID 2 – marking enables filtering of packets as per the set identifier of
the second VLAN tag. At that, only packets satisfying the condition will be
accounted in test results.
Settings are applied after pressing of “Set” button appearing after current
filtering settings have been edited.
10.22 Remote Management
Remote MAKS-ЕМK management allows configuring Tester parameters,
setting and launching tests as well as viewing and saving test results. USB
port denoted
and LAN port denoted
serve for remote management of
the Tester.
10.22.1 Remote Management via USB
USB port (see Figure 4.1.4) is used for remote MAKS-EMK management.
To organize an interface between Tester and PC you should install driver
package for virtual CP210x_VCP_Win2K_XP_S2K3.exe. COM port
emulation. When the driver is installed, connect the Tester to PC via USB
cable. New COM port will appear on Device Manager.
10.22.2 Remote Control via Ethernet
Note: Remote Control via Ethernet is Tester option 08-RC.
To manage the Tester, connect it to
connector by means of a patchcord (see Figure 4.1.4). Configure the third Ethernet interface serving for
remote management using “Interface Settings” menu, then “Interface
Settings RC”.
10.22.3 Remote Control Software Operation
Start EMKRemote.exe program. Dialogue box of the program is illustrated
in Figure 10.21. The program is common for MAKS-EMK and MAKS-EMBK
but it can manage only one Tester/Tool at a time.
Figure 10.22 Remote Control Software
To manage the Tester via USB, select number of the virtual COM port
connected to Tester interface in “Port” drop-out list and press “Connect”
button.
To manage the Tester remotely via Ethernet, enter IP address of the third
Ethernet interface into “IP” input field of “Ethernet Connection” section and
press “Connect” button. Management of the Tester via Ethernet is analogous
to its management via USB.
If connection is successful, the connected device info indicating its type will
appear in the status bar. Also CPU and FPGA firmware versions values and
Tester serial number will be displayed. Measurement functions tab will become
active. Press “Disconnect” button if disconnection is required (for example, to
upgrade the Tester software or connect another device).
Remote Management functionality is analogous to functionality of the
Tester.
Measuring ports status is displayed in “Port A” and “Port B” upper status
group. Status group messages update automatically one time per second. The
group comprises four LEDs: Test, Rx, Tx and Link (from left to right). LEDs
show different status information depending on Tester operation modes.
Meaning and highlighting of indicator captions correspond to LEDs meaning
and their captions (refer to Paragraph 4.1.1).
Test LEDs show port engagement in test fulfillment. Test LED captions
may be as follows:
BERT – port is busy with “BER” test traffic reception or transmission;
CAB – port is busy with cable test signals transmission and reception;
DNS – port is busy with “DNS” test packets transmission and reception;
JIT – port is busy with Packet Jitter test traffic transmission or reception;
LB1 – Layer 1 “Loopback” mode is on;
LB2 – Layer 2 “Loopback” mode is on;
LB3 – Layer 3 “Loopback” mode is on;
LB4 – Layer 4 “Loopback” mode is on;
MDI – port is busy with “MDI” test traffic transmission;
MS – port is busy with “Multistream” test traffic transmission and
reception;
OAM – ОАМ mode is activated;
PING – port is busy with “Ping” test traffic transmission and reception;
РТР – port is busy with “РТР” test data reception or transmission
RFC – port is busy with “RFC 2544” test traffic transmission or reception;
SCAN – port is busy with “IP Scanner” test traffic transmission or
reception;
THRU – “Thru” menu has been selected or “Thru” mode is on;
TRT – port is busy with “Traceroute” test packets transmission and
reception;
TRAF – port is busy with traffic test data transmission or reception;
Rx LED indicates data reception status. Green Rx LED reports that the port
is busy with traffic reception.
Tx LED indicates data transmission process. Yellow highlighting of Tx LED
reports that the port is busy with traffic transmission.
Link LED indicates connection status. Link LED captions indicate data
transmission speed: 1000 for 1000BASE-T and 1000BASE-Х, 100 for
100BASE-T, 10 for 10BASE-T, NS – no synchronization. “Н” symbol stands
for half duplex mode and “F” symbol stands for full duplex mode.
Data transmission and data reception speeds on interfaces are indicated
below LEDs in bps. Parameter values can be defined as instantaneous values
of reception and transmission information rates without notice of preamble,
interframe gap and start frame delimiter.
“Process A” and “Process B” buttons select a port whose menu is being
displayed on screen.
The list of tests and MAKS-EMK functions can be found on functional tabs
on the left side panel. Functional tabs are as follows:
− Cable Test
− RFC 2544 Test
− Multistream Test
− Thru
− Packet Jitter
− TCP/IP Test
− BER Test
− Traffic Test
− OAM
− Loopback Test
− PTP
− Optical Test
− MDI Test
− Settings
− Statistics
− File Transfer
Settings of all tests and functions are analogous to the tests and functions
presented by the on-screen menu (see the corresponding paragraphs 10.4 10.21).
To activate changed settings, press “Apply” button. If you need to return
to the settings saved in Tester memory, press “Reset” button. Test results
and statistics information are updated automatically once per second. Tests
are launched by “Start”, “Start А->А», “Start А->В”, “Start В->А” and
“Start В->В” buttons (dependent on possible and required test topologies).
10.22.4 Transfer of Report Files and Settings
Use “File Transfer” tab for generation of test reports on a PC and using
Remote Control Software. To display all the files pre-saved in Tester memory,
press “Update”.
Reports and test settings are divided into separate files.
Select the required report file and download it using “Save pdf-report”
button. At that, the pdf-formatted report will be saved into PC memory. The
new file will be shown in the list of saved files in remote control software.
To save the file with the required settings into remote control software,
press “Save” button, enter file name in the pop-up window and press “ОК”.
The new file will be shown in the list of saved files in remote control software.
Files containing settings or reports that were saved before can be downloaded
or deleted by means of “Download” and “Delete” buttons. The used should
select the file to be downloaded or deleted first.
Screenshot*
To make a screenshot you should press “Screenshot” button in “File
Transfer” tab. Save the file in *png format using the dialogue box that will pop
out.
Note*: When the tester is managed remotely, “Screenshot” option is
deactivated.
10.23 Tester Settings and Options
10.23.1 General Settings
“Common” tab of “Device Settings” menu is illustrated in Figure 10.23.
“Common” tab contains the following fields:
Language – interface language selection: Deutsch, English.
Sound – marking of this field activates test sounds. Audio signal sounds
when information messages are displayed, if a test is unsuccessful or if battery
is low.
Serial Number – serial number of the Tester.
Version – displays release number of the embedded software.
Reset to default settings – return of all menus to factory settings. Hover
the cursor over the field to discover “Reset” button. Press the button.
Рис. 10.23 Tester Settings
10.23.2 Options
Extra functions of MAKS-EMK Tester will be available after purchase of the
corresponding options. To activate one or several options, the user should get
activation key which is unique for each existing MAKS-EMK Tester.
Find “Key” field on the screen.
Key – enter the key into the required Tester field. If the key is shorter in
characters than the field, set low bits of the digit. After entering the key, press
“Activ.” button. “Key” field will display zero value after activation of the key.
Note: if activated options happened to reset as a result of misoperation or
due to any other reasons, please contact the manufacturer’s support
engineers.
If the activation was successful, Remote Management Software buttons
and menu items responsible for the corresponding functions will become
unblocked. Also, names of the activated options will be displayed under “Key”
field. List of existent Tester options is presented in Table 10.23.
Table 10.23
Option Name
08-RC
08-MPLS
08-MS
08-PTP
08-Y1564
08-IPTV
08-AT
Description
Remote Management via Ethernet
Settings of MPLS packet fields
Multistream Test
Time Synchronization PTP IEEE1588
Y.1564 Measurement (SAM)
MDI Metrics Measurement
Asymmetric Channels Testing
10.23.3 Date and Time
The menu displays current date and time settings.
Date – current date setting and display.
Time – current time setting and display.
Press “F4” key to enter “Date and Time” tab of “Device Settings” menu
from any menu of the Tester.
10.23.4 Battery
Voltage – the field displays value of battery voltage in V.
10.23.5 Display
The menu shows current settings of display brightness and contrast.
Brightness – image brightness settings;
Contrast – image contrast settings.
10.23.6 Checking
The menu displays checking modes of the Tester. Only one field of the
below mentioned can be marked at a time.
Switch Off – marking disables switching of checking signals.
Clock frequency – marking enables switching of bit-timing frequency
checking signals.
Velocities – marking enables switching of information speed and amount
checking signals.
GPS checking – marking enables switching of the signal checking GPS
synchronization error.
PPS discrepancy checking – marking enables switching of the signal
checking synchronization discrepancy measurement error.
11 Checking Procedure
The present test procedure determines methods and instruments of
primary checking and periodic re-checking of MAKS-EMK packet network
Testers manufactured by JSC SPE “KOMETEH” registered in St. Petersburg,
Russia. In-service Testers and Testers after being stored or/and repaired are
subject to checking.
Re-checking period makes up 2 years.
11.1 Checking Stages
Tester maintenance reduces itself to periodic visual inspection of the power
unit and the cords aimed at keeping them clean and in good order.
11.1.1 During checking, stages listed in Table 11.1 should be performed.
No.
Operation Name
Test
procedure
paragraph
Table 11.1
Conducting an operation at
primary
checking
periodic rechecking
1
External examination
11.7.1
Yes
Yes
2
Assaying
11.7.2
Yes
Yes
3
Bit-timing frequency error
calculation
11.7.3
Yes
Yes
4
Calculation of frequency
error at payload
transmission
Calculation of information
content measurement error
Determination of GPS
synchronization error
Determination of error in
synchronization discrepancy
measurement
11.7.4
Yes
No
11.7.5
Yes
Yes
11.7.6
Yes
Yes
11.7.7
Yes
Yes
5
6
7
11.2 Checking Instruments
11.2.1 When checking the Tester, you should use checking instruments
listed in Table 11.2.
Table 11.2
Test
Name of checking instrument, its type and metrological
procedure
characteristics
paragraph
11.7.3,
Electronic frequency analyzer:
11.7.4, 11.7.5 0.1 Hz – 1500 MHz, (0,03–10) V, ±5·10-7f±1 units; ≥1 MOhm
11.7.6
Stanford Research Systems rubidium frequency standard,
FS725 ±10 ns
11.7.7
Pendulum CNT90 counting-type electronic frequency analyzer
with ±2.5·10-6 s impulse duration measurement function
11.2.2 It is acceptable to use other checking instruments with metrological
characteristics analogous to those of the listed equipment.
11.2.3 Checking instruments must be in good order, they must be verified
and have verification certificates.
11.3 Skill Requirements
Checking must be performed by certified personnel familiar with the
present test procedure as well as user manuals of MAKS-EMK Tester and
checking instruments.
11.4 Safety Requirements
You must implement safety measures specified in Tester and checking
instruments’ user manuals during checking process.
11.5 Checking Conditions
11.5.1 When checking the Tester, you should observe the following
conditions:
− environment temperature (20±5)°С;
− relative air humidity (65±15)%;
− atmospheric pressure (100±8) kPa;
− supply voltage (220±11) V;
− industrial network frequency (50±0.5) Hz.
11.6 Preparation for Checking
11.6.1 Prior to checking the Tester, you should check operating instructions
for availability and make sure that validity period of checking instrument
certificate has not expired.
11.6.2 Switch checking instruments on and warm them up for as long as it
is specified in their user manuals.
11.7 Checking
11.7.1 External Examination
Method of visual inspection is used to check conformance of the products
to their technical documentation (as to completeness, proper marking and
package). Also, Tester is checked for visible damage as well as connecting
cables, clamps and connectors are checked for integrity.
11.7.2 Assaying
You should assay the Tester after you have studied its user manual. Ability
of the Tester to switch on, its service capability as well battery status and
Tester ability to operate from AC mains using adapter/power supply unit are to
be checked.
Battery operation of the Tester should also be checked. If necessary,
charge the battery using AC adapter coming with the Tester. Check Interface
Settings selection, general settings, test procedure setting, cables and service
capability in basic modes in the specified sequence.
11.7.2.1 Connect port A of the assayed MAKS-EMK Tester to its port B.
Enter “Interface Settings” menu and configure measuring interfaces with the
following manually preset parameters: port A IP address - 192.168.0.200, port
B IP address - 192.168.0.201, port A МАС address – 00:50:C2:F9:C0:06, port
B МАС address – 00:50:C2:F9:C0:07, VLAN – 0, interface bit rate for both
measurement ports – 1000 Mbps. Select “Process B” menu – “Loopback” and
set Layer 1. Then select “Process A” menu – “Terminal A>>A” – “RFC 2544”
and configure RFC 2544 throughput test with default settings. Specify port B IP
address as the destination IP address and mark “Automatic Destination MAC”.
Disable other RFC 2544 tests. RFC 2544 test is enabled by pressing “Start”
button. Test pass is observed at different packet lengths at physical Layer.
11.7.2.2 Connect port A of the assayed MAKS-EMK Tester to its port B.
Select “Process B” menu – “Loopback” and set Layer 2. Then select “Process
A” menu – “Terminal A>>A” – “RFC 2544” and enable throughput test from
RFC 2544 test package according to paragraph 11.7.2.1. Observe test pass at
different packet sizes at data link Layer. Similarly, observe test pass at
networking Layer after setting Layer 3 Loopback.
11.7.2.3 Connect port A of the assayed MAKS-EMK Tester to its port B.
Select “Process B” menu – “Loopback” and set Layer 3. Then select “Process
A” menu – “Terminal A>>A” – “Traffic Test” with the following settings: load
100%, packet length - 64 bytes, нагрузка 100%, test duration – 10 seconds.
Start the test and observe it pass successfully. Transmission of the selected
frames can be observed in “Statistics” menu. Test with 1518 bytes packet size
is run in a similar manner.
11.7.2.4 It is necessary to control required parameters and statistics on
Tester menu and their service capability in the corresponding modes.
11.7.3 Clock frequency error calculation
Bit-timing frequency error is calculated by means of a frequency analyzer.
Mark “Clock frequency” field of “Checking” tab (see Paragraph 10.21.7),
“Device Settings” menu.
Frequency analyzer is connected to the
slot of MAKS-EMK tester
being checked by means of К08.1 cable. The measured value must be 125.00
MHz with a relative accuracy of 2 ∗ 10 −5 .
11.7.4 Calculation of Frequency Error at Payload Transmission
100% channel load error is calculated by means of a frequency analyzer.
Frequency analyzer is connected to the
slot of the tester being checked
by means of К08.1 cable. Mark “Velocities” field of Checking” tab (see
Paragraph 10.22.6), “Device Settings” menu.
Frequency of information bytes transmission during package generation
with irreducible time slot for several packet lengths is measured. Absolute
measurement error is ±15 kHz.
Absolute error is measured as follows:
∆ = FBTF – FT, where
FBTF – bit-timing frequency measured by frequency analyzer;
FT – theoretical value calculated for each data link speed.
Maximum channel load is calculated according to the following formula:
FT = 125×M×(L+8)/(L+20) MBps,
where
L – packet length, bytes
M = 1 for 1000BASE-T
M = 0.1 for 100BASE-T
M = 0.01 for 10BASE-T
Depending on transmission speed and packet length, bit-timing frequency
(FBTF) values in MHz are listed in Table 11.3. Limits of tolerable bit-timing
relative error (with account of temperature instability and aging treatment)
make up ±15 kHz.
Packet
10BASE-T
Length, bytes
64
1.071
512
1.222
1518
1.240
100BASE-T
10.714
12.218
12.402
Table 11.3
1000BASE-T
107.143
122.180
124.025
Deactivate all tests on port B of MAKS-EMK Tester by means of “Process
B” menu. Make sure there are no captions under port B “Test” LED. Set
connection speed of 10 Mbps for both measurement ports on “Interface
Settings” menu. Activate “Traffic Test” with the following settings: load -100%,
frame length – from Table 11.3, test duration – 10 seconds on “Process A”
menu, “Terminal A>>B” topology. This test measures frequency value.
Measurements for connection speeds of 100 and 1000 Mbps are performed in
the similar manner for each frame length.
11.7.5 Calculation of Data Amount Error
Mark “Velocities” field of Checking” tab (see Paragraph 10.22.6) of the
tester being checked, “Device Settings” menu.
Connect port A and port B of the tested MAKS-EMK by means of a patch
cord. Deactivate all tests on port B via “Process B” menu and make sure there
are no captions under “Test” LED of port B. Mark “Auto clear.” on “Statistics”
menu on “Common” tab. Specify connection speed of 10 Mbps for both
measurement ports on “Interface Settings” menu. Activate “Traffic Test” with
the following settings: load – 100 %, packet length – 64 bytes, test duration – 1
second and manually set MAC addresses on “Process A” menu, “Terminal
A>>B” process topology. Activate “Traffic Test” with the following settings on
“Process A” menu, “Terminal A>>B”. Make sure the test has been successful
(“Statistics” menu). Record NM , i.e. number of measured bytes received on
Port B (“Common” Tab – Port B – Rx bytes). Concurrent with test launch,
perform measurements by means of frequency analyzer connected to DUT.
Connect a frequency analyzer to the
slot of MAKS-EMK tester being
checked by means of К08.1 cable. Measure received bytes number (Nf) with
regard to packet preamble that will be determined by the number of measured
impulses.
Measurements for 1518-byte packet length are performed in analogous
way.
Calculate absolute error by the following formula:
∆ = Nf*L/(L+8) – Nм,
where
Nf – information content in bytes measured with frequency analyzer with
consideration of packet preamble.
Nм – information content in bytes measured without consideration of packet
preamble .
L – frame length in bytes.
Absolute measurement error is equal to ±1 byte.
11.7.6 Determination of GPS Synchronization Error
Only MAKS-EMK tester of “E” modification with a GPS antenna jack is
subject to checking.
Mark “GPS Checking” field on “Checking” tab of “Device Settings”
menu (please refer to par. 10.22.6).
GPS synchronization error is calculated by means of a phase differential
analyzer.
The phase differential analyzer is connected to the Tester according to the
diagram shown in Figure 11.7.1. Connect the GPS/GLONASS antenna to the
GPS jack of MAKS-EMK Tester. 1 Hz reference signal is supplied to slot 1 of
the phase differential analyzer. Connect
slot of the MAKS-EMK Tester
being checked to slot 2 of the phase differential analyzer by means of К08.1
cable.
Make the needed measurements using the phase differential analyzer
simultaneously with performing the test.
Phase differential analyzer measures ∆Tph and MAKS-EMK Tester
measures ∆Tм.
Calculate absolute error by the following formula:
∆ = ∆Tph - ∆Tм , where
∆Tph – synchronization phase differential measured by means of the phase
differential analyzer;
∆Tм – synchronization phase differential measured by means of MAKSEMK Tester.
Figure 11.7.1 Diagram of GPS Synchronization Error Measurement
Synchronization phase differential is a value of the time slot between the
edge of reference synchronization signal and the edge of GPS synchronization
signal.
Absolute measurement error is equal to 1 ms.
11.7.7 Determination
Measurement
of
Error
in
Synchronization
Discrepancy
Only MAKS-EMK tester of “E” modification is subject to checking.
Mark “PPS discrepancy checking” field on “Checking” tab of “Device
Settings” menu (please refer to par. 10.22.6).
Error in synchronization discrepancy measurement is determined using an
impulse duration analyzer.
The 1 Hz reference source is connected to
slot of MAKS-EMK Tester by
means of K08.1 cable according to the diagram shown in Figure 11.7.2. and
then connect
slot of the Tester to the impulse duration analyzer. A rubidium
time and frequency standard serves as a reference source.
Figure 11.7.2 Diagram of Error Determination in Synchronization Discrepancy
Measurement
Make the needed measurements using the impulse duration analyzer
simultaneously with launching the test.
Impulse duration analyzer measures ∆ph and MAKS-EMK Tester measures
∆м.
Calculate absolute error by the following formula:
∆ = ∆ph - ∆м ,
where
∆ph – impulse duration measured by means of the impulse duration
analyzer;
∆м – impulse duration measured by means of MAKS-EMK Tester.
Absolute measurement error is equal to 10 ns.
11.8 Checking Result Presentation
11.8.1 Checking results are registered in a log and, if Tester corresponds to
the requirements stated in technical documentation, a set form certificate is
issued.
11.8.2 If checking fails, the Tester will be supplied with a document stating it
is unusable and giving reasons for its rejection.
12 Maintenance
12.1 Maintenance of the Tester comes down to periodic visual inspection of
its power unit and cables and is aimed at keeping them clean and operable.
13 Transportation and Storage
13.1. Tester packed in its standard container can be transported by road, in
house railroad cars, in leak-proof aircraft and ship holds at air temperature of
- 25 °С…+ 55 °С and relative air humidity of 95 %. Please observe shipping
and load fastening rules during transportation on the corresponding mode of
transport.
13.2. It is possible to transport the Tester by road:
- class I roads: to distances up to 1,000 km at a speed of 60 kmh max.
- class II to III roads and earth roads: to distances up to 250 km at a speed of
40 kmh.
13.3. Please observe handling instructions and warning label information
when handling, loading and unloading.
13.4. Tester packed in its standard container should be stored in heated
warehouse rooms at air temperature of 0 °С…+ 40 °С and at relative air
humidity of 80 % at temperature of + 35 °С. Storage time should not exceed 6
months.
13.5. Warehouse rooms where Tester is stored must be free from acid and
alkali fumes as well as other aggressive agents that may cause metal
corrosion.
13.6. Please observe general regulations of fire safety when transporting
and storing the Tester.
14 Product Details
Name: Packet Network Tester and Analyzer MAKS-EMK
Designation:
МБСЕ. 468212.008
Release date:
State Register Identification Number
Certification Data
Manufacturer:
CJSC SPE “KOMETEH”
P.O.Box 140, Saint Petersburg, 190103, Russia
Ph.:
+7 (812) 333-06-61
Ph./Fax: +7 (812) 333-08-09
e-mail: [email protected]
www.kometeh.ru
Manufacturer’s Warranty
Manufacturer warrants compliance of MAKS-ЕМ MBCE. 468212.008 TS
Tester to specification requirements on the understanding that transportation,
storage and operating rules are observed by customer. Warranty period is
equal to 24 months from the date the customer took delivery of the Tester.
The stated period may be changed by mutual agreement of the parties in
the delivery contract.
Acceptance Certificate
MAKS-ЕМK Tester MBCE. 468212.008 TS with serial number __________
was manufactured and accepted in accordance with state standards exclusive
requirements and operative technical documentation and it is recognized
ready-for-service.
Chief Quality Inspector
personal signature
print full name
dd
mm
yyyy
Chief Engineer
personal signature
print full name
Stamp here
dd
mm
yyyy
Packing Certificate
MAKS-ЕМK Tester, serial number ___________ was packed according to
the requirements stipulated by the operative technical documentation.
function of undersigned
personal signature
print full name
dd
mm
yyyy
Information on Primary Checking and Periodic Re-Checking
Table
Checking
Date
Type Of Checking
Checking Results
Function of
undersigned
Signature
Reclamation
Checking
Date
Type Of Checking
Checking Results
Function of
undersigned
Signature
Companies or institutions operating the Tester claim reclamation for the
equipment according to the established rules.
Reclamation data should be tabulated (see the table below):
Table
Defect Operation time
detection before defect
date
detection
Defect cause
To whom and
when
reclamation
was delivered
Date of receipt or
commissioning of the
Tester after reclamation
Appendix А.
P2
P1
P0
T3
T2
Table А.1. ToS Byte Bit Name
T1
T0
CU0
Table А.2. Precedence Field Value
Precedence
DS5
DS4
DS3
Name
0
Routine
1
Precedence
2
Immediate
3
Flash
4
Flash Override
5
CRITIC/ECP
6
Internet Work Control
7
Network Control
DS2
Table А.3. DSCP-byte Bit Names
DS1
DS0
ECN
ECN
Name
Table А.4. Values of DSCP Field
DSCP Decimal Value
DSCP Binary Value
AF11
001010
10
AF12
001100
12
AF13
001110
14
AF21
010010
18
AF22
010100
20
AF23
010110
22
AF31
011010
26
AF32
011100
28
AF33
011110
30
AF41
100010
34
AF42
100100
36
AF43
100110
38
CS1
001000
8
CS2
010000
16
CS3
011000
24
CS4
100000
32
CS5
101000
40
CS6
110000
48
CS7
111000
56
Default
000000
0
EF
101110
46
Table А.5. Frame Loss Possibility
According to AF Classification for
DSCP Field
Frame Loss
Probability
low
medium
high
Category 1
Category 2
Category 3
Category 4
AF11
AF12
AF13
AF21
AF22
AF23
AF31
AF32
AF33
AF41
AF42
AF43
Table А.6. Throughput re-calculation as to Layer 2,
T L2 of a pure channel for different frame length
Connection Speed
V
f
, Mbps
Frame Length
10
100
1000
64
7,6190
76,190
761,90
128
8,6486
86,486
864,86
256
9,2754
92,754
927,54
512
9,6241
96,241
962,41
1024
9,8084
98,084
980,84
1280
9,8462
98,462
984,62
1518
9,8700
98,700
987,00
Table А.7. Conformance of MDI and MDI-X signals to contacts
Contact
MDI
MDI-X
1
BI_DA+
BI_DB+
2
BI_DA-
BI_DB-
3
BI_DB+
BI_DA+
4
BI_DC+
BI_DD+
5
BI_DC-
BI_DD-
6
BI_DB-
BI_DA-
7
BI_DD+
BI_DC+
8
BI_DD-
BI_DC-
Table А.8. Time Source Enumeration
Value*
10
20
30
40
50
60
90
A0
F0-FE
FF
Time Source
Description
Any device, or device directly connected
to such a device, that is based on atomic
resonance for frequency and that has
ATOMIC_CLOCK
been checking against international
standards for frequency and, if the PTP
timescale is used, time
Any device synchronized to a satellite
GPS
system that distribute time and frequency
tied to international standards
Any device synchronized via any of the
TERRESTRIAL_RAD radio distribution systems that distribute
IO
time and frequency tied to international
standards
Any device synchronized to a PTP-based
PTP
source of time external to the domain
Any device synchronized via NTP or
Simple Network Time Protocol (SNTP) to
NTP
servers that distribute time and frequency
tied to international standards
Used for any device whose time has been
set by means of a human interface based
HAND_SET
on observation of an international
standards source of time to within the
claimed clock accuracy
Other source of time and/or frequency not
OTHER
covered by other values
Any device whose frequency is not based
on atomic resonance nor checked against
international standards for frequency, and
INTERNAL_OSCILL
whose time is based on a
ATOR
free-running
oscillator
with
epoch
determined in an arbitrary or unknown
manner
For use by alternate
PTP profiles
Reserved
* All other values in Table 8 are reserved.