1
Aggregates Levey Sustainability Fund – MEPF 04/03
MARA-GIS, Technical Report
Contents continued
4.
Conclusions .................................................................................................................... 42
4.1
Overview............................................................................................................ 42
4.2
Benefits .............................................................................................................. 43
4.3
Recommendations for future research ............................................................... 43
4.4
Recommendations for wider application of MARA .......................................... 44
4.5
Final Conclusions .............................................................................................. 45
5.
References ...................................................................................................................... 45
Tables
Table 2.1
Table 2.2
Table 2.3
Table 3.1
Table 3.2
Table 3.3
Sources – Pathways – Receptors - Consequences ..................................................... 5
Example 3 x 3 hazard matrix with 5 hazard states................................................... 10
(a) hazard probabilities, (b) sensitivity and (c) response ......................................... 13
The stages of MARA-GIS ....................................................................................... 18
Example hazard state matrix.................................................................................... 28
Fields in the risk results layer created using the “Generate Map” button ................ 38
Figures
Figure 2.2 MARA Framework Overview ................................................................................... 7
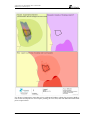
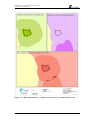
Figure 2.3 (a) Hazard Zones, e.g. numerical model results at 2500 m2 resolution, (b)
Receptor Zones, e.g. zones of differing densities of Brittlestar (c) Impact zones,
delineated in red......................................................................................................... 9
Figure 2.4 Steps in the quantification of risk in MARA ........................................................... 13
Figure 3.1 Overview of Software Design.................................................................................. 19
Figure 3.2 Adding the “Start MARA-GIS” button to the ArcGIS toolbar ................................ 22
Figure 3.3 MARA GIS Task Management Form...................................................................... 23
Figure 3.4 Open Database and Set Scope Form ........................................................................ 24
Figure 3.5 Licence Locations Form. ......................................................................................... 25
Figure 3.6 Dredge Zones Locations Form................................................................................. 25
Figure 3.7 Dredge Zone Data Form .......................................................................................... 26
Figure 3.8 Hazard State Information Form ............................................................................... 27
Figure 3.9 Metadata form.......................................................................................................... 28
Figure 3.10 Hazard Data Entry Status list box and buttons to enter hazard state probabilities... 29
Figure 3.11 Hazard State Probabilities Form – manual option ................................................... 29
Figure 3.12 Hazard State Probabilities Form – shape attributes option ...................................... 30
Figure 3.13 Task 3a Receptor Presence Form............................................................................. 31
Figure 3.14 Receptor Presence Quantification Form .................................................................. 32
Figure 3.15 Receptor Sensitivity Form ....................................................................................... 33
Figure 3.16 Receptor Response Form ......................................................................................... 34
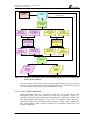
Figure 3.17 Summary of the processing tasks performed during Task 3c, the calculation of
the receptor response................................................................................................ 35
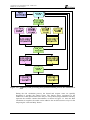
Figure 3.17 Summary of the processing tasks performed during Task 4, the calculation of
risk. .......................................................................................................................... 36
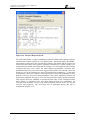
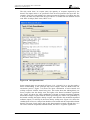
Figure 3.18 Risk Quantification .................................................................................................. 37
Figure 3.19 Risk Quantification – example results map: Loss of scallops due to noise ............. 39
Figure 3.20 Risk Quantification – example results map: Loss of scallops due to suspended
sediment ................................................................................................................... 40
Figure 3.21 Risk Quantification – example results map: Loss of scallops due to combined
suspended sediment and noise hazards .................................................................... 41
EX 5766
viii
R. 2.0