1
PC Based Logic Analyzer
Final Report
Team Members: Jeff Earleson & Jason Nielsen
Advisors: Dr. James Irwin & Mr. José Sánchez
May 13, 2005
EE 452
Bradley University
Electrical and Computer Engineering
Abstract
The PC Based Logic Analyzer is a device that determines the logical state (High, Low, or
Unknown) of a signal, then displays, with respect to time, the state in a Graphical User Interface
(GUI) on a Personal Computer (PC). A Field Programmable Gate Array (FPGA) and external
circuitry determine the logical state, then the PC communicates with the FPGA using Universal
Serial Bus 2.0, transferring the resulting logical states to the PC. The PC GUI written in the
language of C#, interprets the stream of data, and based upon a triggering event, displays
pertinent data on the screen.
i
Outline
Introduction
p. 1-2
Project Description
p. 2-4
Hardware Design
p. 4-10
Software Design
p. 11-22
Conclusions
p. 22
Appendix
Appendix I: FPGA Config Code
Appendix II: Pcbladata Code
Appendix III: CirQlar Code
Appendix IV: Pcbla Code
Appendix V: VHDL Code
Appendix VI: Pin Listing (.ucf)
Appendix VII: Original Functional Description
Appendix VIII: Original System Block Diagrams
Appendix IX: Original Project Proposal
A.I
A.II
A.III
A.IV
A.V
A.VI
A.VII
A.VIII
A.IX
p. 1
p. 1 - 4
p. 1 - 6
p. 1 - 15
p. 1 - 4
p. 1 - 4
p. 1 - 3
p. 1 - 10
p. 1 - 18
ii
Introduction
To have a better understanding of what a PC based logic analyzer is, it helps to
understand what a logic analyzer is, and its purpose in the electrical engineering world. With
these goals in mind, a definition of logic analyzers is in order. A logic analyzer is a device that,
through sampling, allows a user to view the logical values (High, Low, Intermediate, High-Z
(silence)) and transitions on a digital device. A logic analyzer is very similar in nature to an
oscilloscope. Both devices are tools for debugging, testing, and verifying electronics. They
differ on a few key points; notably, a logic analyzer only allows a user to view logical states
(whereas oscilloscopes show voltage levels) and logic analyzers sample many more lines than
typical oscilloscopes.
As was earlier stated, logic analyzers function as a debugging instrument. Common
situations for which a logic analyzer would be ideal, are those where multiple line testing is
needed, but logical values not voltage levels will suffice. Examples of this would be debugging
any sort of microcontroller, combinational logic circuit, or entire device such as a PCI
((Peripheral Component Interconnect) card. To allow a user to debug a digital device, the logical
analyzer displays all lines being sampled using a GUI (Graphical User Interface). It is through
this GUI that a user navigates through the sampled logical data, discovers possible discrepancies
on data lines, or timing issues between lines.
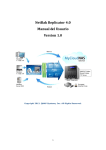
Another important topic necessary to better understand logic analyzers is triggering.
Triggering is a method of organizing information in such a way such that a single events or
cyclical events are displayed coherently. Since logic analyzers operate similarly to
oscilloscopes, the difference between an untriggered and triggered display is shown in the figure
below (Figure 1).
1
Figure 1: Unrigged vs. Triggered Displays
As the figure shows, in an untriggered case the data streams across the display in a way
that can be nearly impossible to decipher. The triggered display, by triggering on a voltage
threshold, shows signals in a much more coherent manner. Logic analyzers work in a similar
manner, however they trigger on logical events rather than voltage thresholds. A logical event
consists of several different situations such as a single line changing values (a clock signal would
be a common example of this) or a combination of many lines changing to specified values. The
result is data is organized by the clock signal or by a specific situation occurring.
Commercial logic analyzers are quite expensive; common logic analyzers cost several
thousand dollars, with top of line logic analyzers costing upwards of $50,000. The high cost of
commercial logic analyzers has caused a need for low-cost logic analyzers in an academic
setting. This is where this project, the PC Based Logic Analyzer Project fits in.
Project Description
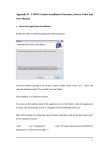
The PC Based Logic Analyzer is designed for use in Bradley University Electrical and
Computer Engineering Laboratories. It utilizes an external pod for sampling, and software
written for a PC. Designed to cost less than $500, this logic analyzer’s functionality is geared for
an academic setting where not all features of commercial logical analyzers are necessary. This
project achieves this goal by designating a significant portion of the project to be implemented
2
on a PC, thus reducing the cost of the project to the construction costs of the external pod.
Figure 2 is a block diagram of our system, and shows the relationship between pod and PC, and
the overall flow of the system. Table 1 designates the inputs outputs and significant internal
signals.
Figure 2: Overall System Block Diagram
Inputs:
Analog Signals
Signals on the POD’s probes. These can be TTL or CMOS based.
PC Commands
Commands entered using keyboard and mouse.
Transferred Signals
Conditioned Signals
Signals sent via USB containing state information for all sampled
lines.
Outputs:
Monitor Display
Displays captured data, trigger signal, cursors and basic Windows
functions (print, save etc.)
3
Table 1: Inputs, Outputs, and Transferred Signals
Figure 3: Pod portion of the design
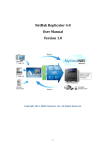
Pod / Hardware Design
The Pod/Hardware portion (Figure 3) of the design is the portion in which the signals
from the DUT are sampled at high speed, converted to logical states, and transferred at high
speed to the PC. It accomplishes these tasks in two subsystems: external circuitry, and an Opal
Kelly XEM 3001. This can be seen in the figure below (Figure 4).
Figure 4: Detailed Block Diagram of Pod/Hardware portion of design.
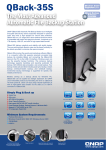
The External Circuitry portion can be divided further into two portions: a probe
connection, and comparison circuitry.
Probe Connection
The probe connection is where the Device Under Test (DUT) connects to the PC based
logic analyzer. It carries 16 lines on a ribbon cable into the comparison circuitry with an external
ground connection between the DUT and the PC based logic analyzer. Future designs of the PC
based logic analyzer should include a ground connection on the probe. This ground connection
should also be used to eliminate cross-talk between lines. Figure 5 shows the cross-talk problem.
Channel 1 is the high bit, after the comparator (it is checking to see if the line is above TTL high
4
threshold) with the input to the comparators being a 0 to 5 volt square wave at near 2 MHz. The
cross-talk was large enough for it to cause the line next to it to also exceed the high state
threshold thus displaying what can be seen on channel 2, an identical signal. It should be noted
that the line experiencing the cross talk was not connected (or floating); if connected to a signal
or ground cross-talk will have much less effect. By running ground lines between the pins crosstalk can be reduced if not eliminated in future designs. However, the probe connection did
accomplish the major goal of successfully transferring signals into the comparison circuitry.
Figure 5: Cross-talk on parallel probe lines
Comparison Circuitry
The comparison circuitry portion of the pod determines which of three states the sixteen
sampled lines are in. The three states the comparison circuitry checks for are Low,
5
Indeterminate, and High; it should be noted that the threshold for the states is based on the
current selection of CMOS or TTL. To accomplish this, a resistor tree is set up to create the
threshold voltages for both CMOS and TTL. These voltages are tied into banks of comparators
(two per line).
The flow of the system can be seen in the Figure 6. The signal from a DUT’s data line
comes in through the probe connection at the lower left of the figure. The signal enters both
comparators, which determine if it is
Figure 6: Comparison Circuitry
exceeding the low and high logic thresholds. This results in two signals being sent to the Opal
Kelly XEM 3001 FPGA. These signals can be seen in Figure 7.
6
Figure 7: Triangle Wave demonstrating threshold levels
In Figure 7 channel 1 is a triangle wave and is the source on a single sampled line. The reference
line R1 is the high bit line; it is a 1 when below the 2.0V threshold and a 0 when above. Channel
2 is the low bit line; it is a 1 when below the 0.8V threshold and a 0 when above. The
comparators used are AD8564, manufactured by Analog Devices. They are ideal for the design
because they have an inherent high impendence, run off of a single 5V power supply, and are
capable of operating at very high frequencies. The rise and fall time in the output from the
AD8564 is 3.8ns rise and 1.5ns fall. This allows for clear signal sampling well above the overall
PC based logic analyzer’s maximum sampling rate (12 MHz). With two output lines per each
sampled data line, 32 lines or bits are sent to the Opal Kelly XEM 3001 FPGA.
7
FPGA
This brings us to the second portion of the Pod/Hardware design: the Opal Kelly XEM
3001 FPGA. The Opal Kelly XEM 3001 FPGA is responsible for sampling and organizing the
32 bits of data it is receiving from the comparison circuitry and then transferring the data to the
PC via USB (Universal Serial Bus). The XEM 3001 incorporates a Xilinx Spartan-3 FPGA and
a USB 2.0 transfer chip onto a single board. Not only does it provide the connections between
the FPGA and the USB 2.0 chip, but it provides functions on both the FPGA and PC side to
interface the PC and FPGA seamlessly through USB. The way the XEM 3001 interfaces is
through endpoints. In a typical FPGA, inputs and outputs are assigned to pins which correspond
to a physical pin on the FPGA. In the XEM 3001’s case all of these pins are predetermined.
Many of them are still available for user inputs and outputs on three I/O blocks JP1, JP2, and JP3
(see figure 8).
Figure 8: Layout of Opal Kelly XEM 3001
8
However, many of the pins are permanently used by the interface to the PC. These inaccessible
pins are then used as endpoints for the exchange of data between the PC and FPGA. These
endpoints are described on the FPGA side by having VHDL (Very High Level Integrated Circuit
Hardware Description Language) libraries define functions which correlate to different types of
endpoints. On the PC, C++ libraries, and now .DLLs (dynamic link library), define the functions
to be able to use the same endpoints to communicate with the FPGA in real-time. Endpoint
types used in the PC Based Logic Analyzer design include Wire and BufferedPipe. The Wire
function is an 8-bit connection that is only updated when the PC dictates; this makes it ideal for
set up information but poor for large data transfer. The BufferedPipe function is an 8-bit
connection that is started and stopped on the PC, and the PC dictates how much data it would
like to receive. It is buffered on the sender (in this case the FPGA) in a FIFO (First in First Out)
structure, so that a large amount of data can be sent rapidly from the FPGA to the PC. Figure 9
from the Opal Kelly user manual helps explain endpoints.
Figure 9: Opal Kelly’s user manual endpoint description Figure
The FPGA is programmed with a .bit file compiled from VHDL (see appendix V and VI)
and runs in a state machine format. The FPGA has four states it cycles through. In the first state
9
it transfers from JP2, where the comparison circuitry’s data enters, all thirty two bits into a
temporary location. This is to ensure that every sample occurs at the same time on all lines.
Also in the first state, it places the first eight bits of the thirty two into the FIFO buffer to be sent.
The remaining three states simply place the 2nd, 3rd, and 4th bytes of the thirty two bits into the
FIFO respectively. The flow chart below (Figure 10) shows the flow of the VHDL. The clock
speed on the FPGA is 48 MHz so the overall sampling rate is 12 MHz.
EVENT: Clock Rising Edge
Enter Next State
Write to FIFO Buffer Command (if enabled)
Perform action based on State
State = S1
State = S2
Ybus 7 to
0 to FIFO
Write Ybus
to
Pipebuffer
Pipebuffer
15 to 8
to FIFO
State = S3
Pipebuffer
23 to 16
to FIFO
State = S4
Pipebuffer
31 to 24
to FIFO
Figure 10: VHDL State machine flow chart
Finally once the data is in the FIFO buffer, whenever the PC requests for data to be sent
(ideally at cyclical intervals) the buffer is transferred and the data from the sampled lines is now
in the PC portion.
10
Software
The main program for the logic analyzer is written in C#. This language was chosen because
Windows XP™ systems are the target environment and C# a good IDE (integrated development
environment). The Microsoft Visual Studio .NET™ IDE provides drag and drop GUI (graphical
user interface) creation. The one problem with using C# is the Opal Kelly Front Panel API™
(Application Program Interface) is a static C++ library. C# cannot link to a static library; it
needs a DLL (dynamic link library). Opal Kelly developed a DLL version of the API but it was
not ready early enough to be used in this project. One solution to this problem was to have the
C# main program call C++ programs would communicate with the XEM 3001. There are two
operations that must be completed by the C++ programs: FPGA configuration and data
collection.
FPGA Configuration:
The FPGA on the XEM 3001 board is a Xilinx Inc. Spartan-3. A synthesized BIT file must be
loaded into the Spartan in order for the FPGA to operate. The Front Panel API provides
functions for loading a BIT file into the Spartan. Figure 11 shows the process for configuring the
Spartan.
[Space left black for formatting. Figure 11 on next page.]
11
Figure 11: FPGA Configure Flowchart
If opening an instance of the XEM 3001 fails an error code of 4 is reported. This error code tells
the user via a message box to check that the XEM 3001 board is connected to the USB. The
ConfigureFPGA function tries to load test4.bit to the Spartan-3 (see Appendix I for syntax). If
this fails, a message box informs the user. This error condition should not happen unless the bit
file becomes corrupted or there is a more serious hardware problem. If no errors occur, the
Spartan is configured and the XEM 3001 is ready to gather data at the user’s command.
Data Collection:
The data collection program acquires data using a pipe style data transfer. This style of transfer
provided buffered data transmission between the PC and the XEM 3001. The buffer will allow
more processing time for the PC. Once the data is read, it must be parsed and written to a text
file so the C# program can interpret and display the data. This process is shown in Figure 12.
12
Figure 12: Data Collection Flowchart
The ReadFromPipeOut() function reads a buffer of 1024 characters from the XEM 3001 into a
character array. Each probe line is represented by two bits thus it takes four characters to store
one sample of all sixteen lines. This means 1024 characters store a total of 256 samples. Each
two bit value must be parsed and written to data.txt so it is available to read by the C# program.
The program parses data using a shifting two bit mask and a switch statement. This is shown in
Figure 13.
[Space left black for formatting. Figure 13 on next page.]
13
Figure 13: Parsing Flowchart
The switch statement has four cases corresponding to states: logic ‘0’, indeterminate, high Z, and
logic ‘1’. For a logic ‘0’, the two data bits are 00 and a ‘0’ is written to data.txt. For
indeterminate, the data is 01 and a 0.33 is written to data.txt. For high Z, the data is 10 and a
0.66 is written to data.txt. For a logic ‘1’, the data is 11 and a ‘1’ is written to data.txt. It is
possible reduce the number of cases from sixteen to four by shifting the data bits as shown in
Figure 13. Shifting the mask selects different two data bits (representing a different probe line)
14
each time through the masking loop. The masking loop happens four times per byte because
there are eight bits in a byte and two bits are analyzed at a time. Now that the data is stored in a
text file, the C# program must read and store it for plotting.
CirQlar
Since a logic analyzer handles large streams of data, it must use an efficient storage structure.
One such structure is a circular queue. A queue is FIFO (First In First Out) memory structure.
Each time data is removed from the queue all the data values must be shifted so that the first
element is in the first index position. The time required to shift data increases as more data
elements are added to the queue. A circular queue removes the need for shifting the data when
an element is removed because the front index is shifted instead of the data. This means that no
matter how many data elements the queue contains, the complexity is constant.
A circular queue requires two basic functions: Push and Pop. Push adds a new value to the back
of the queue and Pop increments the pointer to the first element. For example, an empty circular
queue with six elements will look like Figure 14. qFront and qBack point to the same element
and the count of elements is zero.
Figure 14: Circular Queue Initial Point
15
If three values are pushed, the circular queue contains three elements. qFront points to the first
element and qBack points to the next empty element.
Figure 15: Three Values Pushed
When Pop is called twice, qFront gets incremented by two and still points to the first element.
Figure 16: Two Values Popped
Pushing two more values increments qBack modulo the queue capacity. qBack is now set to zero
rather than six as it would have been without using the modulo operator.
Figure 17: Two More Pushes
16
C# provides a queue that has these basic functions. With this queue, the programmer can only
view the first element and cannot index within the queue. This does not work well for the logic
analyzer because a trigger point must be set to an index in the queue and a subset of data around
the trigger point must be accessible. To obtain these features, a new circular queue library called
cirQlar was developed (see Appendix III). This library provides the basic circular queue
functions plus some functions specific to the logic analyzer. Figures 18 and 19 are the
flowcharts for the Push and Pop functions. They operate as discussed earlier. The Push function
is logic analyzer specific because rather than stop filling when the queue is full it removes the
oldest value and then stores the new value.
"
!
"
!
#
Figure 18: Push Flowchart
Figure 19: Pop Flowchart
17
In order for the data to be displayed, it must be stored in a standard array. The library contains a
ToArray function that is overloaded twice to facilitate three logic analyzer operations: plotting all
acquired data, centering the trigger point, and scrolling (see Appendix III pg 1-3). The basic
ToArray function just copies the whole circular queue (cQueue) to an array. This is done by
copying the values of the cQueue one by one to an array and returning the array. If cQueue is
empty the function returns an array of 0.5. This avoids a null pointer reference when the data is
plotted. This is shown in Figure 20.
Figure 20: Basic ToArray Flowchart
Displaying the whole buffer can sometimes be useful but more useful is displaying the trigger
point at the middle of the screen. This functionality is provided by the ToArray(int trigPoint)
function. This function returns an array that is only a portion of the whole cQueue size. The
center point of the array is the trigger point that was passed as a parameter. The size of the view
18
window is set by the user but the trigger point is always the center element. Figure 21 shows the
flow for this function.
)
*
$ *
+)
*
"
)
*
!
"
!
,
-) .
/
$
$
$
$
%&'
$
(
Figure 21: ToArray(int trigPoint) Flowchart
The graphical user interface will provide the ability to scroll through the buffer. The ToArray(int
beginPoint, bool dummyvariable) function accommodates this feature. The dummy variable
exists just to differentiate between the trigger point and begin point versions of the function. The
ToArray(int beginPoint, bool dummyvariable) function returns an array that has the value of
19
beginPoint as the first element and is the size of view window size. The flow for this is in Figure
22.
Figure 22: ToArray(int beginPoint, bool dummyvariable) Flowchart
Now that the data is in a linear array it can be displayed.
Graphical User Interface:
The GUI (Graphical User Interface) is the main program and was written in C#. It calls the C++
programs, provides user control, and displays the signals. When the GUI starts, it initializes the
display and calls the FPGA configuration program. Upon successful return from configuration,
the GUI waits for user input. The user enters an input using the mouse or keyboard. Figure 23
shows the several inputs the user can select: scroll bar, zoom bar, data.txt, Recenter Trigger, and
Run Until Trigger. The user uses the data.txt button to load data from the data text file. This
button can be used to redisplay data that the user saved from previous sessions. To acquire new
20
data, the user clicks Run Until Trigger. This calls the pcbladata.exe C++ program to read new
data from the XEM 3001 until a trigger event is found. A trigger event is defined by a rising
edge of probe line zero. When a trigger is found, the index of the trigger event is stored in
linedat[0].qTriggerPoint (see Appendix IV pg 4). The program then plots the gathered data with
the trigger point in the middle of the display. Once the data is plotted, the user can scroll and
zoom the display to analyze the data. After scrolling or zooming, if the user wants to recenter
the trigger point all they have to do is click the Recenter Trigger button. The number next to the
zoom bar is the array index of the trigger point. The status label in the bottom right corner tells
the user what the logic analyzer is current doing. By default it is “Status: Idle”.
Figure 23: Graphical User Interface
21
The signals are plotted using the NPlot library. This is an open source plotting library developed
by Matt Howlett. The source files and documentation can be found at
http://netcontrols.org/nplot/. The StepPlot portion of NPlot was used because this was the easiest
way to plot the four possible logical states. Each of the logical states is represented by a
different step height step. These steps are 0, 0.33, 0.66, and 1 as discussed in Data Collection
section of this report. The probe line number is added to each the display signals so they do not
all plot in the 0 to 1 range.
Conclusions
The team was successfully in the following areas: Successful determination of 3 states, VHDL
capable of transferring data from the pod to the PC, successful transfer of data from the pod to
the PC, and successfully display and GUI. Though all of these items were accomplished,
continuous data transfer was not achieved, and High-Z was not detected.
To be able to accomplish these goals another element must be added in the comparison
circuitry that will aid in determining if a High-Z state is in effect, also the DLL released by Opal
Kelly should speed up transfers immensely on the PC side, making continuous data transfer a
reality.
22
Appendix I: fpga config Code
#include <iostream>
#include <fstream>
// this is hard coded because VS C++ was having problems finding the header file.
// when rebuilding the project in a new directory make sure the path is correct.
#include <C:\Documents and Settings\Jason\My Documents\project\fpga config\fpga
config\okCUsbXEM.h>
#include <string>
using namespace std;
int main()
{
// Create an instance of the okCUsbXEM.
okCUsbXEM *xem = new okCUsbXEM();
// Open the first available device. If fail return 4 as error code.
int openfailcnt = 0;
bool check = false;
while(check == false)
{
check = xem->Open(0);
++openfailcnt;
if(openfailcnt == 4)
{
return(openfailcnt);
}
}
}
// Download a configuration file to the FPGA. If fail return 24 as error code.
int configfailcnt = 20;
check = false;
while(check == false)
{
check = xem->ConfigureFPGA("./test4.bit");
++configfailcnt;
if(configfailcnt == 24)
{
return(configfailcnt);
}
}
return(0);
1
Appendix II: pcbladata Code
#include <iostream>
#include <fstream>
// this is hard coded because VS C++ was having problems finding the header file.
// when rebuilding the project in a new directory make sure the path is correct.
#include <C:\Documents and Settings\Jason\My
Documents\project\pcbladata\pcbladata\okCUsbXEM.h>
#include <string>
using namespace std;
int main()
{
string fileName;
fileName = "./data.txt";
}
}
//
// the bufdump.txt file provides a raw dump of the acquired data for debugging purposes
string fileNamebd;
fileNamebd = "./bufdump.txt";
ofstream bufdump;
cout << "Opening File...";
bufdump.open(fileNamebd.c_str());
if (!bufdump.is_open()) {
cout << "ERROR: Cannot open file for writing." << endl;
return(1);
cout << "OK" << endl;
ofstream outFile;
cout << "Opening File...";
outFile.open(fileName.c_str());
if (!outFile.is_open()) {
cout << "ERROR: Cannot open file for writing." << endl;
return(1);
cout << "OK" << endl;
// --- Opal Kelly pipe code --unsigned char *buf;
long xfer_len = 1024;
long pkt_len = 1024;
long len;
// Pipe Out Test
unsigned char *buf2;
buf2 = new unsigned char[pkt_len];
1
// Perform transfer.
bool ret2;
cout << "Testing pipe read...";
// Create an instance of the okCUsbXEM.
okCUsbXEM *xem = new okCUsbXEM();
// Open the first available device.
xem->Open(0);
/*
This was commented out because it was just used for testing. this function is now being
handled by fpga config.exe
// Download a configuration file to the FPGA.
int configfailcnt = 20;
bool check = false;
while(check == false)
{
check = xem->ConfigureFPGA("./test4.bit");
++configfailcnt;
if(configfailcnt == 24)
{
return(configfailcnt);
}
}
*/
xem->SetWireInValue(0x01,0x01);
xem->UpdateWireIns();
for (int i=0; i<xfer_len/pkt_len; i++)
{
len = pkt_len;
ret2 = xem->ReadFromPipeOut(0xa0, len, buf2);
if (false == ret2) {
cout << "ReadFromPipeOut(...) failed.\n";
break;
}
if (pkt_len != len) {
cout << "Wanted " << pkt_len << " but got " << len << " (diff=" <<
pkt_len-len << ").\n";
break;
}
}
2
xem->SetWireInValue(0x01,0x00); // set the "write to buffer" signal on FPGA to '
0'
(ie
don'
t write)
xem->UpdateWireIns();
// --- dump the whole buffer (unparsed) to a text file --for(int i = 0;i<pkt_len;i++)
{
bufdump << buf2[i];
}
// --- Data parsing code for text file --int numlines = 16;
unsigned short parse_data;
unsigned short mask = 0xC0;
unsigned short pd;
int cnt = 0;
for(int i = 0;i<pkt_len; i++)
{
//cnt++;
parse_data = buf2[i];
mask = 0xC0;
for(int j = 0;j<4;j++)
{
pd = (parse_data & mask);
pd = pd >> (6-2*j);
mask = mask >> 2;
if (i==0 && j==0 && cnt==0)
goto gohere;
switch (pd)
{
case 0x00:
outFile << "0.00";
if(cnt != 4){ outFile << " ";}
break;
case 0x01:
outFile << "0.33";
if(cnt != 4){ outFile << " ";}
break;
case 0x02:
outFile << "0.66";
if(cnt != 4) outFile << " ";
break;
case 0x03:
outFile << "1.00";
if(cnt != 4) outFile << " ";
break;
3
}
gohere:
}
cnt++;
default:
outFile << "Probe Line Parsing Error";
if(cnt == 4)
{
outFile << endl;
cnt = 0;
}
}
outFile << "0.33";
delete buf2;
cout << "OK" << endl;
// --- End Opal Kelley Pipe Code --bufdump.close();
//
//
}
cout << "close file...";
outFile.close();
cout << "OK" << endl;
int x;
cin >> x;
return (0);
4
Appendix III: cirQlar Code
/* cirQlar
* Description: A circular queue library that allows indexing within the queue to accomodate a
trigger index.
* Author: Jason Nielsen
* Creation Date: 2/10/05
* Revision: 3/22/05 Changed the storage array to double instead of int because of the way
*
I was implementing the plot in pcbla.
* Revision: 4/11/05 Added a count variable to track the number of elements in the queue.
*
Modified the toArray() method so that it returns an array if the queue is full.
*
Made it throw away the oldest data if the queue is full and a new value is pushed.
* Revision: 4/21/05 Added overloads for the ToArray function that will provide pcbla
*
specific functionality. Made a qBackMinus function to help with triggering.
*/
using System;
namespace cirQlar
{
/// <summary>
/// Provide circular queue functions.
/// </summary>
public class cQueue
{
// Constructor
public cQueue()
{
//int[] qArray = new int[capacity_];
this.qfront_ = 0;
this.qback_ = 0;
this.qTriggerPoint = 0;
this.qArray = new double[10000];
}
// This funtion returns an array of all the elements in the queue.
public double[] ToArray()
{
double[] arr;
if(this.qcount_ == 0)
{
// added this so a null reference wouldn'
t be returned to NPlot
// this case shouldn'
t happen but if it does this should at least avoid
// a program crash.
arr = new double[1] {0.5};
}
else
1
{
}
arr = new double[this.qcount_];
int j = 0;
int i = this.qfront_;
int tmpcnt = this.qcount_;
while(tmpcnt != 0)
{
arr[j] = this.qArray[i];
i = ((i+1) % capacity_);
j++;
tmpcnt--;
}
}
return arr;
// This function returns an array of size qviewsize with the trigger point
// in the middle of the array.
public double[] ToArray(int trigPoint)
{
int arrsize = this.qViewSize;
if(this.qcount_ < arrsize)
{
arrsize = this.qcount_; // set max array size to # element in queue
}
double[] arr;
if(this.qcount_ == 0)
{
arr = new double[1] {0.5};
}
else
{
arr = new double[arrsize];
int temp = trigPoint - arrsize/2;
if(temp < 0)
{
this.qviewfront_ = this.qfront_;
}
else
{
this.qviewfront_ = trigPoint - (arrsize/2);
}
int j = 0;
int i = this.qviewfront_;
int tmpcnt = this.qViewSize;
while(tmpcnt != 0)
2
{
}
isn'
t required;
}
}
return arr;
arr[j] = this.qArray[i];
i = ((i+1) % capacity_);
j++;
tmpcnt--;
// This function is used for the zoom and scroll feature of pcbla. It returns
// an array of qviewsize starting at beginPoint. beginPoint is passed by the
// scrollbar in pcbla. The dummyvariable just distinguishes between this and
// the trigger point version of the ToArray function.
public double[] ToArray(int beginPoint, bool dummyvariable)
{
int arrsize = this.qViewSize;
double[] arr;
arr = new double[arrsize];
int j = 0;
int i = beginPoint; // usually this.qviewfront_ will be passed it but doing so
}
int tmpcnt = this.qViewSize;
while(tmpcnt != 0)
{
arr[j] = this.qArray[i];
i = ((i+1) % capacity_);
j++;
tmpcnt--;
}
return arr;
// Standard pop function removes an element from the queue
public void Pop()
{
if(this.qcount_ == 0)
{
// queue empty
this.qempty_ = true;
}
else
{
this.qfront_ = (this.qfront_ + 1) % capacity_;
this.qfull_ = false;
this.qcount_--;
3
}
}
// pcbla specific Push function. adds new data point to back of queue.
public void Push(double data)
{
if(this.qcount_ == capacity_)
{
// queue full
/* if the queue is full pop so the new data can be pushed
* this is a pcbla application specific action because
* I want pcbla to continually throw away data until the correct
* trigger is found and filling the queue stops.
*/
//qfull_ = true;
this.Pop();
}
this.qArray[this.qback_] = data;
this.qback_ = (this.qback_ + 1) % capacity_;
this.qempty_ = false;
this.qcount_++;
}
items
point.
// Properties to be accessed by programmer
const int capacity_ = 10000;
// specifies max number of storable queue
public int Capacity
{
get { return capacity_; }
}
// --- Static Properties --// These are static because they should be the same for all the lines.
// You wouldn'
t want to zoom only one line and there can be only one trigger
public int qViewSize
{
get { return qviewsize_; }
set { qviewsize_ = value; }
}
static int qviewsize_ = 100;
public int qTriggerPoint
{
set { qtriggerpoint_ = value; }
get { return qtriggerpoint_; }
4
}
static int qtriggerpoint_;
// --- end Static Properties --// --- Instance Specific Properties --public double[] qArray;
public double qTriggerPointValue
{
get { return this.qArray[qtriggerpoint_]; }
}
public int qViewFront
{
get { return qviewfront_; }
set { qviewfront_ = value; }
}
private int qviewfront_ = 0;
public int qViewBack
{
get { return qviewback_; }
}
private int qviewback_ = 5;
public int qCount
{
get { return qcount_; }
}
private int qcount_ = 0;
public int qFront
{
get { return qfront_; }
}
private int qfront_;
public double qFrontValue
{
get { return qArray[this.qfront_]; }
}
public int qBack
{
get { return qback_; }
}
5
private int qback_;
// this function provides a modulo capacity subtract function. This is needed
// because subtracting can result in negative indices with throws an exception.
// When triggering it is helpful to look at previous values. this makes certain
// that the indices are in with in the range of the queue.
public int qBackMinus(int subtractor)
{
int result;
int tmp;
tmp = this.qback_ - subtractor;
if(tmp < 0)
{
result = capacity_ + tmp;
}
else
{
result = this.qback_ - subtractor;
}
return result;
}
public bool qEmpty
{
get { return qempty_; }
}
private bool qempty_ = true;
}
}
public bool qFull
{
get { return qfull_; }
}
private bool qfull_ = false;
// --- end Instance Specific Properties ---
6
Appendix IV: pcbla Code
using System;
using System.Drawing;
using System.Drawing.Drawing2D;
using System.Collections;
using System.ComponentModel;
using System.Windows.Forms;
using System.Drawing.Printing;
using System.Data;
using NPlot;
using System.IO;
using System.Reflection;
using System.Diagnostics;
using cirQlar;
namespace pcbla
{
/// <summary>
/// Summary description for mainForm.
/// </summary>
public class mainForm : System.Windows.Forms.Form
{
// --- form designer added objects declaration --private System.Windows.Forms.MainMenu mainMenu1;
private System.Windows.Forms.MenuItem menuItem1;
private System.Windows.Forms.MenuItem menuItem2;
private System.Windows.Forms.MenuItem menuItem3;
private System.Windows.Forms.MenuItem menuItem4;
private System.Windows.Forms.MenuItem menuItem5;
private System.Windows.Forms.MenuItem menuItem6;
private System.Windows.Forms.MenuItem menuItem7;
private NPlot.Windows.PlotSurface2D plotSurface;
private System.Windows.Forms.Button bReload;
private System.Windows.Forms.HScrollBar sbHistory;
private System.Windows.Forms.Label lStatus;
private System.Windows.Forms.Button bRunTilTrig;
private System.Windows.Forms.Button bRecenterTrigger;
private System.Windows.Forms.Label lqTriggerPoint;
private System.Windows.Forms.HScrollBar sbZoom;
// --- end form designer added objects declaration --const int numlines = 16; // defines the number of lines
StepPlot[] lineplots = new StepPlot[numlines];
Color[] linecolor = new Color[16]
{Color.Red,Color.Blue,Color.Green,Color.Purple,Color.DarkGreen,Color.DarkBlue,Color.Dark
Magenta,Color.MidnightBlue,
1
Color.Red,Color.Blue,Color.Green,Color.Purple,Color.DarkGreen,Color.DarkBlue,Color.DarkM
agenta,Color.MidnightBlue};
// --- Declare cQueues array --cQueue[] linedat = new cQueue[numlines];
double pushval = 0.0;
const int trigline = 0;
/// <summary>
/// Required designer variable.
/// </summary>
private System.ComponentModel.Container components = null;
public mainForm()
{
//
// Required for Windows Form Designer support
//
InitializeComponent();
//
// TODO: Add any constructor code after InitializeComponent call
//
// The following line adds a resize event handler to mainForm().
// The code for this handler is at the bottom of this code.
this.Resize += new System.EventHandler(this.ResizeHandler);
// --- Declare linedat elements --for(int i = 0;i < numlines;i++)
{
linedat[i] = new cQueue();
}
something
sbZoom.Value = linedat[0].qViewSize;
this.configFPGA(); // configure the FPGA and then wait for the user to do
}
// This function calls the fpga config C++ program. If an error value is returned
// from that program the appropriate error message is reported to the user.
public void configFPGA()
{
Process proc = null;
ProcessStartInfo procInfo = new ProcessStartInfo("./fpga config.exe");
2
procInfo.UseShellExecute = false;
procInfo.CreateNoWindow = true;
proc = Process.Start(procInfo);
proc.WaitForExit();
int exitcode = proc.ExitCode;
if(exitcode == 4)
{
MessageBox.Show("Opening XEM3001 failed "+exitcode+"
times. Please check that the logic analyzer is plugged in.");
}
else if(exitcode == 24)
{
MessageBox.Show("Configuring FPGA failed "+(exitcode-20)+"
times. Check that the test4.bit file is in the same folder as fpga_config.exe");
}
}
// This function calls the C++ pcbladata.exe which will read data from the
// XEM3001 and store it in a text file
public void getData()
{
Process proc = null;
ProcessStartInfo procInfo = new ProcessStartInfo("./pcbladata.exe");
procInfo.UseShellExecute = false;
procInfo.CreateNoWindow = true;
proc = Process.Start(procInfo);
proc.WaitForExit();
}
// This function reads the data from the text file and stores it in the array of
// cQueues called linedat. This array of cQueues represents all the probe lines.
// As the function is pushing the data onto the queues it looks for a rising edge,
// a '
0'to '
1'transition, of line zero. When it find one, it sets the index
// of the '
1'to the trigger point. If there is more than one rising edge of
// linedat[0], the most most recent one will be set to the trigger point.
public void fillLinedat(string filename,bool trigger)
{
// --- read txt file to fill cQueues--StreamReader SR = new StreamReader(filename);
string myval = SR.ReadLine();
string[] mystrs;
double mydouble;
while(myval != null)
{
3
mystrs = myval.Split(''
);
for(int i = 0;i < mystrs.Length;i++)
{
mydouble = Convert.ToDouble(mystrs[i]);
linedat[i].Push(mydouble + (i*2));
// finds rising edge(0 to 1 transition) of line zero
if(i == 0 && trigger)
{
if(linedat[0].qArray[linedat[0].qBackMinus(1)] ==
1 && linedat[0].qArray[linedat[0].qBackMinus(2)] == 0)
{
linedat[0].qTriggerPoint = linedat[0].qBack;
}
}
}
myval = SR.ReadLine();
}
SR.Close();
// --- end Read File to Fill cQueues --}
// This function writes all the linedat buffers to a text file. This function
// was used for debugging but it can also be used for a "Save data" menu function.
// It would required a few changes related to letting the user pick the file name
// but other than that is ready to go.
// A load data function could also be used created using the fillLinedat function
// so the user could view old saved data.
public void writeLinedat()
{
// --- test toArray function --StreamWriter SW2 = new StreamWriter("./linedat.txt");
double [] myarra;
for(int i = 0;i<numlines;i++)
{
myarra = linedat[i].ToArray();
for(int j = 0;j<myarra.Length;j++)
{
SW2.Write(myarra[j]);
SW2.Write(" ");
}
SW2.WriteLine();
}
SW2.Close();
// --- end test toArray --}
4
// This function plots all the data in the linedat cQueues. I have overloaded
// the function to provide better viewing capabilities.
public void pcblaPlot(cQueue[] linedat)
{
// --- Plotting --plotSurface.Clear();
// --- Grid Code --Grid mygrid = new Grid();
//mygrid.MajorGridPen = new Pen(Color.Chartreuse);
/* I took the following line out because NPlot creates a dotted gray line by
* default. This is what I wanted for the minor grid lines. If desired the
* line could be uncommented.
* mygrid.MinorGridPen = new Pen(Color.Blue);
*/
VerticalGridType
/* Note: It seems from trial and error that HorizontalGridType actually
* refers to the vertical grid on the actual plot. Likewise,
* refers to the horizontal grid on the plot. Thus HorizontalGridType is set
* to None.
*/
mygrid.HorizontalGridType = Grid.GridType.None;
mygrid.VerticalGridType = Grid.GridType.Fine;
plotSurface.Add(mygrid);
// --- end Grid Code --for(int i = 0;i < numlines;i++)
{
lineplots[i] = new StepPlot();
lineplots[i].OrdinateData = linedat[i].ToArray();
lineplots[i].Pen = new Pen(linecolor[i], 1);
plotSurface.Add(lineplots[i]);
}
// --- Axis Configure --// For now the x-axis will be configured by default by NPlot
// left yaxis1 configuration
LinearAxis ly1 = (LinearAxis)plotSurface.YAxis1;
//ly1.WorldMin = 0.0f;
ly1.LargeTickStep = 1;
ly1.NumberOfSmallTicks = 2;
ly1.HideTickText = true;
ly1.WorldMax = 31.66;
ly1.WorldMin = -1;
LinearAxis lx1 = (LinearAxis)plotSurface.XAxis1;
lx1.HideTickText = true;
5
// --- end Axis Configure ---
}
plotSurface.Refresh();
// --- end Plotting ---
// This overload centers the display around the trigger point that is passed as
// a parameter.
public void pcblaPlot(cQueue[] linedat, int trigPoint)
{
// --- Plotting --plotSurface.Clear();
// --- Grid Code --Grid mygrid = new Grid();
//mygrid.MajorGridPen = new Pen(Color.Chartreuse);
/* I took the following line out because NPlot creates a dotted gray line by
* default. This is what I wanted for the minor grid lines. If desired the
* line could be uncommented.
* mygrid.MinorGridPen = new Pen(Color.Blue);
*/
VerticalGridType
/* Note: It seems from trial and error that HorizontalGridType actually
* refers to the vertical grid on the actual plot. Likewise,
* refers to the horizontal grid on the plot. Thus HorizontalGridType is set
* to None.
*/
mygrid.HorizontalGridType = Grid.GridType.None;
mygrid.VerticalGridType = Grid.GridType.Fine;
plotSurface.Add(mygrid);
// --- end Grid Code --for(int i = 0;i < numlines;i++)
{
lineplots[i] = new StepPlot();
lineplots[i].OrdinateData = linedat[i].ToArray(trigPoint);
lineplots[i].Pen = new Pen(linecolor[i], 1);
plotSurface.Add(lineplots[i]);
}
// --- Axis Configure --// For now the x-axis will be configured by default by NPlot
// left yaxis1 configuration
LinearAxis ly1 = (LinearAxis)plotSurface.YAxis1;
//ly1.WorldMin = 0.0f;
ly1.LargeTickStep = 1;
ly1.NumberOfSmallTicks = 2;
6
ly1.HideTickText = true;
ly1.WorldMax = 31.66;
ly1.WorldMin = -1;
LinearAxis lx1 = (LinearAxis)plotSurface.XAxis1;
lx1.HideTickText = true;
// --- end Axis Configure ---
}
plotSurface.Refresh();
// --- end Plotting ---
// This overload of the function is used to provide the scrolling through linedat.
public void pcblaPlot(cQueue[] linedat, int viewfront, bool dummyvariable)
{
// --- Plotting --plotSurface.Clear();
// --- Grid Code --Grid mygrid = new Grid();
//mygrid.MajorGridPen = new Pen(Color.Chartreuse);
/* I took the following line out because NPlot creates a dotted gray line by
* default. This is what I wanted for the minor grid lines. If desired the
* line could be uncommented.
* mygrid.MinorGridPen = new Pen(Color.Blue);
*/
VerticalGridType
/* Note: It seems from trial and error that HorizontalGridType actually
* refers to the vertical grid on the actual plot. Likewise,
* refers to the horizontal grid on the plot. Thus HorizontalGridType is set
* to None.
*/
mygrid.HorizontalGridType = Grid.GridType.None;
mygrid.VerticalGridType = Grid.GridType.Fine;
plotSurface.Add(mygrid);
// --- end Grid Code --for(int i = 0;i < numlines;i++)
{
lineplots[i] = new StepPlot();
lineplots[i].OrdinateData = linedat[i].ToArray(viewfront,false);
lineplots[i].Pen = new Pen(linecolor[i], 1);
plotSurface.Add(lineplots[i]);
}
// --- Axis Configure --// For now the x-axis will be configured by default by NPlot
7
// left yaxis1 configuration
LinearAxis ly1 = (LinearAxis)plotSurface.YAxis1;
//ly1.WorldMin = 0.0f;
ly1.LargeTickStep = 1;
ly1.NumberOfSmallTicks = 2;
ly1.HideTickText = true;
ly1.WorldMax = 31.66;
ly1.WorldMin = -1;
LinearAxis lx1 = (LinearAxis)plotSurface.XAxis1;
lx1.HideTickText = true;
// --- end Axis Configure ---
}
occurs
plotSurface.Refresh();
// --- end Plotting ---
// This handles repositioning GUI elements when a resize event occurs.
// This handler is attached to the window in the main function at the top
// of the page. Note that every element must be accounted for when a resize
// or else a button might end up in the plot or something of that nature.
private void ResizeHandler(object sender, System.EventArgs e)
{
plotSurface.Width = this.Width - 25;
plotSurface.Height = this.Height - 110;
bReload.Top = this.Height - 50;
sbHistory.Top = this.Height - 104;
sbHistory.Width = this.Width - 25;
lqTriggerPoint.Top = this.Height-50;
bRecenterTrigger.Top = this.Height - 50;
bRecenterTrigger.Left = this.Width - 330;
bRunTilTrig.Top = this.Height - 50;
bRunTilTrig.Left = this.Width - 225;
lStatus.Top = this.Height - 50;
lStatus.Left = this.Width - 110;
sbZoom.Top = this.Height - 50;
}
/// <summary>
/// Clean up any resources being used. This function was added by VS .NET
/// </summary>
protected override void Dispose( bool disposing )
{
if( disposing )
{
8
if (components != null)
{
components.Dispose();
}
}
}
base.Dispose( disposing );
#region Windows Form Designer generated code
/// <summary>
/// Required method for Designer support - do not modify
/// the contents of this method with the code editor.
/// </summary>
private void InitializeComponent()
{
this.mainMenu1 = new System.Windows.Forms.MainMenu();
this.menuItem1 = new System.Windows.Forms.MenuItem();
this.menuItem4 = new System.Windows.Forms.MenuItem();
this.menuItem5 = new System.Windows.Forms.MenuItem();
this.menuItem6 = new System.Windows.Forms.MenuItem();
this.menuItem7 = new System.Windows.Forms.MenuItem();
this.menuItem2 = new System.Windows.Forms.MenuItem();
this.menuItem3 = new System.Windows.Forms.MenuItem();
this.plotSurface = new NPlot.Windows.PlotSurface2D();
this.bReload = new System.Windows.Forms.Button();
this.sbHistory = new System.Windows.Forms.HScrollBar();
this.lStatus = new System.Windows.Forms.Label();
this.bRunTilTrig = new System.Windows.Forms.Button();
this.bRecenterTrigger = new System.Windows.Forms.Button();
this.lqTriggerPoint = new System.Windows.Forms.Label();
this.sbZoom = new System.Windows.Forms.HScrollBar();
this.SuspendLayout();
//
// mainMenu1
//
this.mainMenu1.MenuItems.AddRange(new
System.Windows.Forms.MenuItem[] {
this.menuItem1,
this.menuItem2,
//
// menuItem1
//
this.menuItem3});
9
this.menuItem1.Index = 0;
this.menuItem1.MenuItems.AddRange(new
System.Windows.Forms.MenuItem[] {
this.menuItem4,
this.menuItem5,
this.menuItem6,
this.menuItem7});
this.menuItem1.Text = "File";
//
// menuItem4
//
this.menuItem4.Index = 0;
this.menuItem4.Text = "New";
//
// menuItem5
//
this.menuItem5.Index = 1;
this.menuItem5.Text = "Open";
//
// menuItem6
//
this.menuItem6.Index = 2;
this.menuItem6.Shortcut = System.Windows.Forms.Shortcut.CtrlS;
this.menuItem6.Text = "Save";
//
// menuItem7
//
this.menuItem7.Index = 3;
this.menuItem7.Text = "Print";
//
// menuItem2
//
this.menuItem2.Index = 1;
this.menuItem2.Text = "Edit";
//
// menuItem3
//
this.menuItem3.Index = 2;
this.menuItem3.Text = "View";
//
// plotSurface
//
10
this.plotSurface.AllowSelection = false;
this.plotSurface.AutoScaleAutoGeneratedAxes = false;
this.plotSurface.AutoScaleTitle = false;
this.plotSurface.BackColor =
System.Drawing.SystemColors.ControlLightLight;
this.plotSurface.Legend = null;
this.plotSurface.Location = new System.Drawing.Point(8, 8);
this.plotSurface.Name = "plotSurface";
this.plotSurface.Padding = 10;
this.plotSurface.RightMenu = null;
this.plotSurface.ShowCoordinates = false;
this.plotSurface.Size = new System.Drawing.Size(664, 328);
this.plotSurface.SmoothingMode =
System.Drawing.Drawing2D.SmoothingMode.None;
this.plotSurface.TabIndex = 0;
this.plotSurface.Title = "";
this.plotSurface.TitleFont = new System.Drawing.Font("Arial", 14F,
System.Drawing.FontStyle.Regular, System.Drawing.GraphicsUnit.Pixel);
this.plotSurface.XAxis1 = null;
this.plotSurface.XAxis2 = null;
this.plotSurface.YAxis1 = null;
this.plotSurface.YAxis2 = null;
//
// bReload
//
this.bReload.Location = new System.Drawing.Point(8, 392);
this.bReload.Name = "bReload";
this.bReload.TabIndex = 3;
this.bReload.Text = "data.txt";
this.bReload.Click += new System.EventHandler(this.bReload_Click);
//
// sbHistory
//
this.sbHistory.Location = new System.Drawing.Point(8, 336);
this.sbHistory.Maximum = 10008;
this.sbHistory.Name = "sbHistory";
this.sbHistory.Size = new System.Drawing.Size(664, 16);
this.sbHistory.TabIndex = 10;
this.sbHistory.Scroll += new
System.Windows.Forms.ScrollEventHandler(this.sbHistory_Scroll);
//
// lStatus
//
this.lStatus.Location = new System.Drawing.Point(576, 392);
this.lStatus.Name = "lStatus";
this.lStatus.Size = new System.Drawing.Size(88, 23);
11
this.lStatus.TabIndex = 13;
this.lStatus.Text = "Status: Idle";
this.lStatus.TextAlign = System.Drawing.ContentAlignment.MiddleRight;
//
// bRunTilTrig
//
this.bRunTilTrig.Location = new System.Drawing.Point(464, 392);
this.bRunTilTrig.Name = "bRunTilTrig";
this.bRunTilTrig.Size = new System.Drawing.Size(104, 23);
this.bRunTilTrig.TabIndex = 14;
this.bRunTilTrig.Text = "Run Until Trigger";
this.bRunTilTrig.Click += new
System.EventHandler(this.bRunTilTrig_Click);
//
// bRecenterTrigger
//
this.bRecenterTrigger.Location = new System.Drawing.Point(352, 392);
this.bRecenterTrigger.Name = "bRecenterTrigger";
this.bRecenterTrigger.Size = new System.Drawing.Size(104, 23);
this.bRecenterTrigger.TabIndex = 15;
this.bRecenterTrigger.Text = "Recenter Trigger";
this.bRecenterTrigger.Click += new
System.EventHandler(this.bRecenterTrigger_Click);
//
// lqTriggerPoint
//
this.lqTriggerPoint.Location = new System.Drawing.Point(88, 392);
this.lqTriggerPoint.Name = "lqTriggerPoint";
this.lqTriggerPoint.Size = new System.Drawing.Size(80, 24);
this.lqTriggerPoint.TabIndex = 11;
this.lqTriggerPoint.Text = "qTriggerPoint";
this.lqTriggerPoint.TextAlign =
System.Drawing.ContentAlignment.MiddleCenter;
//
// sbZoom
//
this.sbZoom.LargeChange = 50;
this.sbZoom.Location = new System.Drawing.Point(176, 392);
this.sbZoom.Maximum = 1000;
this.sbZoom.Minimum = 10;
this.sbZoom.Name = "sbZoom";
this.sbZoom.Size = new System.Drawing.Size(160, 16);
this.sbZoom.SmallChange = 10;
this.sbZoom.TabIndex = 16;
this.sbZoom.Value = 10;
12
this.sbZoom.Scroll += new
System.Windows.Forms.ScrollEventHandler(this.sbZoom_Scroll);
//
// mainForm
//
this.AutoScaleBaseSize = new System.Drawing.Size(5, 13);
this.ClientSize = new System.Drawing.Size(680, 417);
this.Controls.Add(this.sbZoom);
this.Controls.Add(this.bRecenterTrigger);
this.Controls.Add(this.bRunTilTrig);
this.Controls.Add(this.lStatus);
this.Controls.Add(this.lqTriggerPoint);
this.Controls.Add(this.sbHistory);
this.Controls.Add(this.bReload);
this.Controls.Add(this.plotSurface);
this.Name = "mainForm";
this.Text = "PC Based Logic Analyzer";
this.ResumeLayout(false);
}
#endregion
/// <summary>
/// The main entry point for the application.
/// This function was added by VS .NET
/// </summary>
[STAThread]
static void Main()
{
Application.Run(new mainForm());
}
// This function loads sample data into linedat when the button is pushed.
// A function similar to this could be used to load old saved data.
private void bReload_Click(object sender, System.EventArgs e)
{
this.fillLinedat("./data 512 1 0.txt", true);
lqTriggerPoint.Text = Convert.ToString(linedat[0].qTriggerPoint);
this.pcblaPlot(linedat);
}
// This handles scrolling through the data
private void sbHistory_Scroll(object sender,
System.Windows.Forms.ScrollEventArgs e)
{
13
linedat[0].qViewFront = e.NewValue;// (linedat[0].qCount linedat[0].qViewSize)/100;
this.pcblaPlot(linedat, linedat[0].qViewFront, false);
}
obtained.
the
// This function trys 5 times to find a trigger in the data acquired from the
// XEM3001. If it can'
t find it by then it reports that and displays the data it
// does have. The limit of five was set because we weren'
t getting data in from
// XEM3001. This limit could/should be removed, if actual data could be
private void bRunTilTrig_Click(object sender, System.EventArgs e)
{
linedat[0].qTriggerPoint = 0;
lStatus.Text = "Seeking Trigger";
lStatus.Refresh(); // this must be refreshed or it won'
t be updated before
because display update is
bRunTilTrig.Enabled = false;
bReload.Enabled = false;
// rest of the function happens
// given less priority.
int seekcnt = 0;
while(linedat[0].qTriggerPoint == 0)
{
if(seekcnt == 5)
{
MessageBox.Show("Finding a trigger event failed
"+seekcnt+" times. Plotting acquired data.");
break;
}
this.getData();
this.fillLinedat("./data.txt", true);
seekcnt++;
}
//this.getData();
//this.fillLinedat(false);
this.pcblaPlot(linedat,linedat[0].qTriggerPoint);
lStatus.Text = "Status: Idle";
bRunTilTrig.Enabled = true;
bReload.Enabled = true;
}
// This function recenters the trigger point in the display.
private void bRecenterTrigger_Click(object sender, System.EventArgs e)
{
14
}
lqTriggerPoint.Text = Convert.ToString(linedat[0].qTriggerPoint);
this.pcblaPlot(linedat,linedat[0].qTriggerPoint);
// This function is a scroll bar that handles the zoom level
private void sbZoom_Scroll(object sender,
System.Windows.Forms.ScrollEventArgs e)
{
linedat[0].qViewSize = e.NewValue;
this.pcblaPlot(linedat, linedat[0].qViewFront, false);
}
}
}
15
Appendix V: VHDL code
--------------------------------------------------------------------------- Test4.vhd
---This is a test program for the Logic Analyzer. It attempts to
--be able to transfer the full sixteen lines of data into the PC.
--It also uses a state machine instead of a counter.
--------------------------------------------------------------------------library IEEE;
use IEEE.std_logic_1164.all;
use IEEE.std_logic_arith.all;
use IEEE.std_logic_misc.all;
use IEEE.std_logic_unsigned.all;
entity Test4 is
port (
end Test4;
hi_clk
hi_cs
hi_rdwr
hi_busy
hi_irq
hi_addr
hi_data
: in STD_LOGIC;
: in STD_LOGIC;
: in STD_LOGIC;
: out STD_LOGIC;
: out STD_LOGIC;
: in STD_LOGIC_VECTOR(3 downto 0);
: inout STD_LOGIC_VECTOR(7 downto 0);
led
ybus
xbus
button
clk1
);
: out STD_LOGIC_VECTOR(7 downto 0);
: in STD_LOGIC_VECTOR(31 downto 0);
: out STD_LOGIC_VECTOR(31 downto 24);
: in STD_LOGIC_VECTOR(3 downto 0);
: in STD_LOGIC
architecture BEHV of Test4 is
type STATE_TYPE is (S1, S2, S3, S4);
attribute ENUM_ENCODING: STRING;
attribute ENUM_ENCODING of STATE_TYPE:type is "00 01 10 11";
signal CS, NS: STATE_TYPE;
component okHostInterface port (
hi_clk
: in
std_logic;
hi_rdwr
: in
std_logic;
hi_cs
: in
std_logic;
hi_irq
: out std_logic;
1
hi_busy
hi_addr
hi_data
ti_clk
ti_control
ti_data
end component;
: out std_logic;
: in
std_logic_vector(3 downto 0);
: inout std_logic_vector(7 downto 0);
: out std_logic;
: out std_logic_vector(12 downto 0);
: inout std_logic_vector(7 downto 0));
component okWireIn port (
ti_clk
: in
ti_control
: in
ti_data
: in
ep_addr
ep_dataout
: out
end component;
std_logic;
std_logic_vector(12 downto 0);
std_logic_vector(7 downto 0);
: in
std_logic_vector(7 downto 0);
std_logic_vector(7 downto 0));
component okWireOut port (
ti_clk
: in
ti_control
: in
ti_data
: out
ep_addr
ep_datain
: in
end component;
std_logic;
std_logic_vector(12 downto 0);
std_logic_vector(7 downto 0);
: in
std_logic_vector(7 downto 0);
std_logic_vector(7 downto 0));
component okBufferedPipeOut port(
ti_clk
: in std_logic;
ti_control
: in std_logic_vector (12 downto 0);
ti_data
: out std_logic_vector (7 downto 0);
ep_addr
: in std_logic_vector (7 downto 0);
ep_clk
: in std_logic;
ep_reset
: in std_logic;
ep_write
: in std_logic;
ep_datain
: in std_logic_vector (7 downto 0);
ep_full
: out std_logic;
ep_empty
: out std_logic;
ep_status
: out std_logic_vector (3 downto 0));
end component;
signal ti_clk : STD_LOGIC;
signal ti_control : STD_LOGIC_VECTOR(12 downto 0);
signal ti_data : STD_LOGIC_VECTOR(7 downto 0);
signal ep00wire
signal ep01wire
signal ep20wire
: STD_LOGIC_VECTOR(7 downto 0);
: STD_LOGIC_VECTOR(7 downto 0);
: STD_LOGIC_VECTOR(7 downto 0);
2
signal clk2
: STD_LOGIC;
signal reset
: STD_LOGIC;
signal pipewrite
: STD_LOGIC;
signal pipeData
: STD_LOGIC_VECTOR(7 downto 0);
signal pipefull : STD_LOGIC;
signal pipeEmpty
: STD_LOGIC;
signal pipeStatus
: STD_LOGIC_VECTOR(3 downto 0);
signal countr
: STD_LOGIC_VECTOR(1 downto 0);
signal pipebuffer
: STD_LOGIC_VECTOR(31 downto 0);
signal testcount
: STD_LOGIC_VECTOR(7 downto 0);
begin
-- Due to the fact that there is no High-Z there is no combinational
-- logic needed. Data is transfered via the pipe function.
clk2 <= ti_clk; -- makes clock for FIFO same as system clock
-- Writes data regarding the state of the FIFO to the wire for PC to read
ep20wire <= ("0000" & pipeStatus (3 downto 0));
led <= ("11" & not pipeStatus (3 downto 0) & pipefull & pipeEmpty);
-- Puts data from wire from PC into the reset value.
reset <= not button (0) or not button (1) or not button (2) or not button (3);
pipewrite <= ep01wire (0);
xbus <= testcount;
--The state machine sets it up so it reads all 16 lines into a buffer
--then each state it writes one of the bytes into the FIFO buffer.
SYNC_PROC: process(clk1) begin
if rising_edge(clk1) then
CS <= NS;
testcount
<= testcount + "1";
end if;
end process;
COMB_PROC: process(CS) begin
case CS is
when S1 =>
pipebuffer <= not ybus; --reads in all data
pipeData <= not ybus (7 downto 0);
NS <= S2;
3
when S2 =>
pipeData <= pipebuffer (15 downto 8); --write second byte
NS <= S3;
when S3 =>
pipeData <= pipebuffer (23 downto 16); --write thrid byte
NS <= S4;
when S4 =>
pipeData <= pipebuffer (31 downto 24); --write fourth byte
NS <= S1;
end case;
end process;
-- Instantiate the okHostInterface and connect endpoints to
-- the target interface.
okHI : okHostInterface port map (
hi_clk => hi_clk,
hi_rdwr => hi_rdwr,
hi_cs => hi_cs,
hi_irq => hi_irq,
hi_busy => hi_busy,
hi_addr => hi_addr,
hi_data => hi_data,
ti_clk => ti_clk,
ti_control => ti_control,
ti_data => ti_data
);
ep00 : okWireIn port map (
ti_clk => ti_clk, ti_control => ti_control, ti_data => ti_data,
ep_addr => x"00", ep_dataout => ep00wire);
ep01 : okWireIn port map (
ti_clk => ti_clk, ti_control => ti_control, ti_data => ti_data,
ep_addr => x"01", ep_dataout => ep01wire);
ep20 : okWireOut port map (
ti_clk => ti_clk, ti_control => ti_control, ti_data => ti_data,
ep_addr => x"20", ep_datain => ep20wire);
epA0 : okBufferedPipeout port map (
ti_clk => ti_clk, ti_control => ti_control, ti_data => ti_data,
ep_addr => x"A0", ep_clk => clk2, ep_reset => reset,
ep_write => pipewrite, ep_datain => pipeData, ep_full => pipefull,
ep_empty => pipeEmpty, ep_status => pipestatus);
end BEHV;
4
Appendix VI: Pin listing (.ucf listing)
#------------------------------------------------------------------------# XEM3001 - Xilinx constraints file
#
# Pin mappings for the XEM3001.
#------------------------------------------------------------------------#------------------------------# FrontPanel Host Interface pins
#------------------------------NET "hi_clk"
LOC = "P79";
NET "hi_cs"
LOC = "P57";
NET "hi_rdwr" LOC = "P58";
NET "hi_busy" LOC = "P81";
NET "hi_irq"
LOC = "P85";
NET "hi_addr<0>" LOC = "P64";
NET "hi_addr<1>" LOC = "P63";
NET "hi_addr<2>" LOC = "P62";
NET "hi_addr<3>" LOC = "P61";
NET "hi_data<0>" LOC = "P67";
NET "hi_data<1>" LOC = "P68";
NET "hi_data<2>" LOC = "P72";
NET "hi_data<3>" LOC = "P74";
NET "hi_data<4>" LOC = "P86";
NET "hi_data<5>" LOC = "P87";
NET "hi_data<6>" LOC = "P90";
NET "hi_data<7>" LOC = "P92";
#--------------# PLL Clock pins
#--------------NET "clk1"
#NET "clk2"
#NET "clk3"
LOC = "P80";
LOC = "P77";
LOC = "P76";
#---------------# Port JP1 (zbus)
#---------------#NET "zclk1"
#NET "zclk2"
#NET "zbus<0>"
#NET "zbus<1>"
#NET "zbus<2>"
#NET "zbus<3>"
#NET "zbus<4>"
#NET "zbus<5>"
LOC = "P183";
LOC = "P181";
LOC = "P187";
LOC = "P185";
LOC = "P182";
LOC = "P178";
LOC = "P176";
LOC = "P175";
1
#NET "zbus<6>"
#NET "zbus<7>"
#NET "zbus<8>"
#NET "zbus<9>"
#NET "zbus<10>"
#NET "zbus<11>"
#NET "zbus<12>"
#NET "zbus<13>"
LOC = "P172";
LOC = "P171";
LOC = "P169";
LOC = "P168";
LOC = "P167";
LOC = "P166";
LOC = "P165";
LOC = "P162";
#---------------# Port JP2 (ybus)
#---------------#NET "yclk1"
NET "ybus<0>"
NET "ybus<1>"
NET "ybus<2>"
NET "ybus<3>"
NET "ybus<4>"
NET "ybus<5>"
NET "ybus<6>"
NET "ybus<7>"
NET "ybus<8>"
NET "ybus<9>"
NET "ybus<10>"
NET "ybus<11>"
NET "ybus<12>"
NET "ybus<13>"
NET "ybus<14>"
NET "ybus<15>"
NET "ybus<16>"
NET "ybus<17>"
NET "ybus<18>"
NET "ybus<19>"
NET "ybus<20>"
NET "ybus<21>"
NET "ybus<22>"
NET "ybus<23>"
NET "ybus<24>"
NET "ybus<25>"
NET "ybus<26>"
NET "ybus<27>"
NET "ybus<28>"
NET "ybus<29>"
NET "ybus<30>"
NET "ybus<31>"
#NET "ybus<32>"
LOC = "P184";
LOC = "P52";
LOC = "P51";
LOC = "P50";
LOC = "P48";
LOC = "P46";
LOC = "P45";
LOC = "P44";
LOC = "P43";
LOC = "P42";
LOC = "P40";
LOC = "P39";
LOC = "P37";
LOC = "P36";
LOC = "P35";
LOC = "P34";
LOC = "P33";
LOC = "P31";
LOC = "P29";
LOC = "P28";
LOC = "P27";
LOC = "P26";
LOC = "P24";
LOC = "P22";
LOC = "P21";
LOC = "P20";
LOC = "P19";
LOC = "P18";
LOC = "P16";
LOC = "P15";
LOC = "P13";
LOC = "P12";
LOC = "P11";
LOC = "P10";
2
#NET "ybus<33>"
#NET "ybus<34>"
#NET "ybus<35>"
LOC = "P9";
LOC = "P7";
LOC = "P5";
#---------------# Port JP3 (xbus)
#---------------#NET "xclk1"
#NET "xbus<0>"
#NET "xbus<1>"
#NET "xbus<2>"
#NET "xbus<3>"
#NET "xbus<4>"
#NET "xbus<5>"
#NET "xbus<6>"
#NET "xbus<7>"
#NET "xbus<8>"
#NET "xbus<9>"
#NET "xbus<10>"
#NET "xbus<11>"
#NET "xbus<12>"
#NET "xbus<13>"
#NET "xbus<14>"
#NET "xbus<15>"
#NET "xbus<16>"
#NET "xbus<17>"
#NET "xbus<18>"
#NET "xbus<19>"
#NET "xbus<20>"
#NET "xbus<21>"
#NET "xbus<22>"
#NET "xbus<23>"
NET "xbus<24>"
NET "xbus<25>"
NET "xbus<26>"
NET "xbus<27>"
NET "xbus<28>"
NET "xbus<29>"
NET "xbus<30>"
NET "xbus<31>"
#NET "xbus<32>"
#NET "xbus<33>"
#NET "xbus<34>"
#NET "xbus<35>"
LOC = "P180";
LOC = "P156";
LOC = "P155";
LOC = "P154";
LOC = "P152";
LOC = "P150";
LOC = "P149";
LOC = "P148";
LOC = "P147";
LOC = "P146";
LOC = "P144";
LOC = "P143";
LOC = "P141";
LOC = "P140";
LOC = "P139";
LOC = "P138";
LOC = "P137";
LOC = "P135";
LOC = "P133";
LOC = "P132";
LOC = "P131";
LOC = "P130";
LOC = "P128";
LOC = "P126";
LOC = "P125";
LOC = "P124";
LOC = "P123";
LOC = "P122";
LOC = "P120";
LOC = "P119";
LOC = "P117";
LOC = "P116";
LOC = "P115";
LOC = "P114";
LOC = "P113";
LOC = "P111";
LOC = "P109";
#------------
3
# Peripherals
#-----------NET "led<0>"
NET "led<1>"
NET "led<2>"
NET "led<3>"
NET "led<4>"
NET "led<5>"
NET "led<6>"
NET "led<7>"
LOC = "P205";
LOC = "P204";
LOC = "P203";
LOC = "P200";
LOC = "P199";
LOC = "P198";
LOC = "P197";
LOC = "P196";
NET "button<0>" LOC = "P194";
NET "button<1>" LOC = "P191";
NET "button<2>" LOC = "P190";
NET "button<3>" LOC = "P189";
4
Appendix VII: Original Functional Description
PC Based Logic Analyzer
Functional Description
Advisors: Dr. James H. Irwin, Mr. José Sánchez
Team Members: Jeffery Earleson, Jason Nielsen
October 28, 2004
EE 451
Bradley University
Electrical and Computer Engineering Department
1
Introduction:
A logic analyzer is an instrument that displays digital signals. It functions much like an analog
oscilloscope except it only displays four levels: low, high, tri-state and indeterminate; it also
samples more lines. This project will create a PC based logic analyzer for use in Junior
laboratory. It will have external conditioning hardware (known as a POD) connected to the PC.
The PC will provide a Graphical User Interface (GUI), triggering, and signal display. This data
flow is seen in Figure 1.
Figure 1: System Block Diagram
Inputs:
Analog Signals
PC Commands
Outputs:
Monitor Display
Printer
Storage
Signals on the POD’s probes. These can be TTL or CMOS based.
Commands entered using keyboard and mouse.
Displays captured data, trigger signal, cursors and basic Windows functions
(print, save etc.)
Prints the displayed waveform.
Saves waveform as an image
System Description
POD: This will accept analog signals on 8-16 data lines. The signals originate from TTL or
CMOS based circuits. The POD will condition the signal to be transmitted to the PC via USB.
PC: The software will receive conditioned signals and display them in a user-friendly manner. It
will provide several forms of triggering, cursors, zooming, etc. and standard window features.
2
Modes of Operation
Setup Mode: In this mode, the user selects the desired threshold levels for the analog signal
type (TTL or CMOS), the number of lines to be sampled, and the triggering method.
Run Mode: In this mode, the analyzer displays the conditioned signals based on the selected
triggering method.
Stop Mode: This mode allows the user to stop collecting data and freeze the display. The
display can still be zoomed and the cursors moved.
3
Appendix VIII: Original System Block Diagrams
PC Based Logic Analyzer
Complete System Level Block Diagram
Advisors: Dr. James H. Irwin, Mr. José Sánchez
Team Members: Jeffery Earleson, Jason Nielsen
November 23, 2004
EE 451
Bradley University
Electrical and Computer Engineering Department
4
Introduction:
A logic analyzer is an instrument that displays digital signals. It functions much like an analog
oscilloscope except it only displays four levels: low, high, tri-state and indeterminate; it also
samples more lines. This project will create a PC based logic analyzer for use in Junior
laboratory. It will have external conditioning hardware (known as a POD) connected to the PC.
The PC will provide a Graphical User Interface (GUI), triggering, and signal display. This data
flow is seen in Figure 1.
Figure 1: System Block Diagram
Inputs:
Analog Signals
PC Commands
Outputs:
Monitor Display
Printer
Storage
Signals on the POD’s probes. These can be TTL or CMOS based.
Commands entered using keyboard and mouse.
Displays captured data, trigger signal, cursors and basic Windows functions
(print, save etc.)
Prints the displayed waveform.
Saves waveform as an image
System Description
POD: This will accept analog signals on 8-16 data lines. The signals originate from TTL or
CMOS based circuits. The POD will condition the signal to be transmitted to the PC via USB.
PC: The software will receive conditioned signals and display them in a user-friendly manner. It
will provide several forms of triggering, cursors, zooming, etc. and standard window features.
5
Modes of Operation
Setup Mode: In this mode, the user selects the desired threshold levels for the analog signal
type (TTL or CMOS), the number of lines to be sampled, the trigger condition, and the sampling
method (synchronous or asynchronous).
Sample Mode: In this mode, started by the user, the analyzer collects the conditioned signals
based on the selected triggering method.
Display Mode: This mode is entered automatically after the buffer is filled and the trigger
occurs. The display can be zoomed and the cursors moved.
POD Functionality
Sampled lines
Comparison
Circuit
Buffer
USB Interface
Data line to PC
Figure 2: POD Block Diagram
Inputs:
Sixteen lines
Outputs:
Data line to PC
These are the lines that are of interest to the user. They can be TTL or CMOS
type. In addition, one of the signals may be designated as a clock signal on the
target device and can be used for synchronous sampling.
This is the sampled data in a 2-bit per sample per line form. A packet is sent
on this line and USB protocols are used.
The POD is the sampling device for the logic analyzer. The POD has eight or sixteen
digital lines configured to respond to a TTL and/or CMOS signal levels. It samples them
synchronously using a designated clock line or asynchronously using an internal clock. For
synchronous mode, the clock signal coming from the device under test (DUT) dictates when
samples are taken, thus creating the appearance that all signals on all lines change on the clock.
This is useful for simple testing; it allows the user to quickly see what happens in the device
through each of its clock cycles. In asynchronous mode, all sixteen lines are sample lines. An
internal clock set at a very high frequency dictates when samples will be taken. This is useful for
allowing the user to see the independent activity of lines during a DUT’s clock cycle. Moreover,
this allows for much more detailed debugging. The comparison circuit determines one of four
states for each line. The comparator can classify signals as high, low, intermediate signal
(between high and low thresholds), or no signal (a High-Z condition). Once the state has been
determined, the data is sent in the form of 2-bits into a buffer. Once several samples for all
6
sixteen lines have been collected in the buffer, the buffer sends the data to the PC through the
USB interface. More detail on the separate sections can be seen in figures below.
Designated Clock
Line
Sampled lines
Probe
Synchronous/
asynchronous
switch
Internal
Clock
To Buffer
(2 bits)
Probe
Combinational
Logic
High Comparison circuit
Low Comparison circuit
High-Z Comparison circuit
Figure 3: Comparison Circuit Block Diagram
2 Bits from
Comparison
circuit
Line to USB
Controller
Memory
Space
Write
Controller
Read
Controller
Figure 4: Buffer Block Diagram
From Buffer
USB
Transceiver
Chip
Data line to PC
Figure 5: USB Interface Block Diagram
PC Functionality
7
Figure 6: PC Block Diagram
PC Inputs:
Conditioned Signals
Keyboard/Mouse
Outputs:
Monitor Display
Printer
Storage
Signals sent from the POD to the PC with all sampled data in packet form
using USB protocols.
Commands entered using keyboard and mouse to setup trigger conditions,
change display format, save the waveform, setup, and hardcopies.
Displays captured data, trigger signal, cursors and basic Windows functions
(print, save etc.)
Prints the displayed waveform.
Saves waveform as an image
The PC is the user interface to the logic analyzer. The conditioned signals are received
by the PC and the raw data is extracted from the USB packets. The raw data is then stored in
memory. A significant amount of data will be kept in memory such that all trigger conditions
could be adequately displayed based on the samples contained in memory. The user can set the
trigger conditions using the keyboard, the mouse and the GUI. When the trigger condition is
met, the software will display the samples that are relevant to the time at which the trigger
condition was met. The software will also display a user-controlled-length of data both before
and after the trigger condition. This allows the user to see data prior to the trigger point, to see
data after the trigger, or see a percentage of data before and after the trigger point. The displayed
image is going to be based on the user’s choice of sample rate. If a slower sample rate is chosen,
then the user will be able to see a longer length of time in around each trigger but with less
resolution; if a faster rate is chosen, more detail is shown, but the length of time displayed
around a trigger is less. More detail in each section of the block diagram can be seen in the
Figure 7 and Figure 8.
Start
Keyboard or
mouse entry
Set trigger
display point,
output type,
number of
signals to
display
End
Figure 7: Control Block Diagram
Start
Store as a 32-bit
unsigned integer
array
Remove USB
Header Bits
End
Figure 8: USB Data Acquisition
8
Start
Start
Probe
Data[i] ==
Trigger
Mask
Store USB
Data[i] in Temp
Temp & Mask
Yes
No
Increment i
Adjust queue
indices
Yes
Store Temp to
the front of
Line[k]
Is i <=
Front of Probe
Data
No
Store trigger
index
Done
Mask * 4
Figure 10: Trigger Block
Increment k
Is k < 16?
Yes
No
Place trigger
index at desired
display position
Increment i
Is i <= USB
data size
Start
Yes
No
Done
Figure 9: Memory Store
Draw every
tenth data point
pre and post of
trigger index
Done
Figure 11: Display Block
9
Start
Print
Print or Save
Save
Take screen shot
Take screen shot
Write to printer
driver
Write as jpeg
Figure 12: Output Block
10
Appendix IX: Original Project Proposal
PC Based Logic Analyzer
Project Proposal
Advisors: Dr. James H. Irwin, Mr. José Sánchez
Team Members: Jeffery Earleson, Jason Nielsen
November 30, 2004
EE 451
Bradley University
Electrical and Computer Engineering Department
11
Introduction:
A logic analyzer is an instrument that displays digital signals. It functions much like an analog
oscilloscope except it only displays four levels: low, high, tri-state and indeterminate; it also
samples more lines. This project will create a PC based logic analyzer for use in Junior
laboratory. It will have external conditioning hardware (known as a POD) connected to the PC.
The PC will provide a Graphical User Interface (GUI), triggering, and signal display. This data
flow is seen in Figure 1.
Figure 1: System Block Diagram
Inputs:
Analog Signals
PC Commands
Outputs:
Monitor Display
Printer
Storage
Signals on the POD’s probes. These can be TTL or CMOS based.
Commands entered using keyboard and mouse.
Displays captured data, trigger signal, cursors and basic Windows functions
(print, save etc.)
Prints the displayed waveform.
Saves waveform as an image
System Description
POD: This will accept analog signals on 8-16 data lines. The signals originate from TTL or
CMOS based circuits. The POD will condition the signal to be transmitted to the PC via USB.
PC: The software will receive conditioned signals and display them in a user-friendly manner. It
will provide several forms of triggering, cursors, zooming, etc. and standard window features.
12
Modes of Operation
Setup Mode: In this mode, the user selects the desired threshold levels for the analog signal
type (TTL or CMOS), the number of lines to be sampled, the trigger condition, and the sampling
method (synchronous or asynchronous).
Sample Mode: In this mode, started by the user, the analyzer collects the conditioned signals
based on the selected triggering method.
Display Mode: This mode is entered automatically after the buffer is filled and the trigger
occurs. The display can be zoomed and the cursors moved.
POD Functionality
Sampled lines
Comparison
Circuit
Buffer
USB Interface
Data line to PC
Figure 2: POD Block Diagram
Inputs:
Sixteen lines
Outputs:
Data line to PC
These are the lines that are of interest to the user. They can be TTL or CMOS
type. In addition, one of the signals may be designated as a clock signal on the
target device and can be used for synchronous sampling.
This is the sampled data in a 2-bit per sample per line form. A packet is sent
on this line and USB protocols are used.
The POD is the sampling device for the logic analyzer. The POD has eight or sixteen
digital lines configured to respond to a TTL and/or CMOS signal levels. It samples them
synchronously using a designated clock line or asynchronously using an internal clock. For
synchronous mode, the clock signal coming from the device under test (DUT) dictates when
samples are taken, thus creating the appearance that all signals on all lines change on the clock.
This is useful for simple testing; it allows the user to quickly see what happens in the device
through each of its clock cycles. In asynchronous mode, all sixteen lines are sample lines. An
internal clock set at a very high frequency dictates when samples will be taken. This is useful for
allowing the user to see the independent activity of lines during a DUT’s clock cycle. Moreover,
this allows for much more detailed debugging. The comparison circuit determines one of four
states for each line. The comparator can classify signals as high, low, intermediate signal
(between high and low thresholds), or no signal (a High-Z condition). Once the state has been
determined, the data is sent in the form of 2-bits into a buffer. Once several samples for all
13
sixteen lines have been collected in the buffer, the buffer sends the data to the PC through the
USB interface. More detail on the separate sections can be seen in figures below.
Designated Clock
Line
Sampled lines
Probe
Synchronous/
asynchronous
switch
Internal
Clock
To Buffer
(2 bits)
Probe
Combinational
Logic
High Comparison circuit
Low Comparison circuit
High-Z Comparison circuit
Figure 3: Comparison Circuit Block Diagram
2 Bits from
Comparison
circuit
Line to USB
Controller
Memory
Space
Write
Controller
Read
Controller
Figure 4: Buffer Block Diagram
From Buffer
USB
Transceiver
Chip
Data line to PC
Figure 5: USB Interface Block Diagram
PC Functionality
14
Figure 6: PC Block Diagram
PC Inputs:
Conditioned Signals
Keyboard/Mouse
Outputs:
Monitor Display
Printer
Storage
Signals sent from the POD to the PC with all sampled data in packet form
using USB protocols.
Commands entered using keyboard and mouse to setup trigger conditions,
change display format, save the waveform, setup, and hardcopies.
Displays captured data, trigger signal, cursors and basic Windows functions
(print, save etc.)
Prints the displayed waveform.
Saves waveform as an image
The PC is the user interface to the logic analyzer. The conditioned signals are received
by the PC and the raw data is extracted from the USB packets. The raw data is then stored in
memory. A significant amount of data will be kept in memory such that all trigger conditions
could be adequately displayed based on the samples contained in memory. The user can set the
trigger conditions using the keyboard, the mouse and the GUI. When the trigger condition is
met, the software will display the samples that are relevant to the time at which the trigger
condition was met. The software will also display a user-controlled-length of data both before
and after the trigger condition. This allows the user to see data prior to the trigger point, to see
data after the trigger, or see a percentage of data before and after the trigger point. The displayed
image is going to be based on the user’s choice of sample rate. If a slower sample rate is chosen,
then the user will be able to see a longer length of time in around each trigger but with less
resolution; if a faster rate is chosen, more detail is shown, but the length of time displayed
around a trigger is less. More detail in each section of the block diagram can be seen in the
Figure 7 and Figure 8.
Start
Keyboard or
mouse entry
Set trigger
display point,
output type,
number of
signals to
display
End
Figure 7: Control Block Diagram
Start
Store as a 32-bit
unsigned integer
array
Remove USB
Header Bits
End
Figure 8: USB Data Acquisition
15
Start
Start
Probe
Data[i] ==
Trigger
Mask
Store USB
Data[i] in Temp
Temp & Mask
Yes
No
Increment i
Adjust queue
indices
Yes
Store Temp to
the front of
Line[k]
Is i <=
Front of Probe
Data
No
Store trigger
index
Done
Mask * 4
Figure 10: Trigger Block
Increment k
Is k < 16?
Yes
No
Place trigger
index at desired
display position
Increment i
Is i <= USB
data size
Start
Yes
No
Done
Figure 9: Memory Store
Draw every
tenth data point
pre and post of
trigger index
Done
Figure 11: Display Block
16
Start
Print
Print or Save
Save
Take screen shot
Take screen shot
Write to printer
driver
Write as jpeg
Figure 12: Output Block
Division of Labor
Jason Nielsen
• Programming the graphical user interface
• USB device drivers
• Data display
• Triggering
Jeff Earleson
• Hardware detection of 8 to 16 digital lines
• USB interface
• Probe connection
• Microcontroller USB interface
Schedule of Development
Software
• Programming the graphical user interface – 2 weeks1
• USB device drivers – 3 weeks
• Data display – 3 weeks
• Triggering – 2 weeks
Hardware
• Hardware detection – 3 weeks
• USB interface – 3 weeks
• Probe connection - 1 week
• Microcontroller USB interface – 3 weeks
Part List
• 1 Junior Lab computer
• Microsoft .NET framework
• 16 high impedance probes
• 32 Schmitt triggers
• 1 USB interface chip
17
•
1 microcontroller
Appendix A
Full Feature List
Primary
1) Cursors indicating time difference
2) Trigger on clock line (internal or external)
3) Print waveform
4) Logic levels at the cursors. Display binary or hex value of a multiple line bus at the cursors.
5) Change the number of lines displayed
6) Basic idiot protection
7) Indeterminate state
8) Trigger position in the buffer: middle, pre, post
9) TTL or CMOS level detection
Secondary
1) Trigger on user defined combinational logic
2) Hardware options controlled by software
3) Display window resize
4) Variable trigger position in the buffer
5) Rearrange line locations on the display
6) Trigger on one signal line
7) Save waveform as an image
8) Zoom on waveform
Tertiary
1) Program Decoding
2) Tristate detection
3) Super hardware idiot protection
4) Save the whole buffer data in the image so the whole buffer can be regenerated when loaded
into the PCBLA software.
5) Option to change the number of lines sampled to any number divisible by two.
18