1
Thesis
Current state of technology and potential of
Smart Map Browsing in web browsers
using the example of the Free web mapping application OpenLayers
Submitted by
Emanuel Schütze
Thesis Supervisors:
Prof. Dr.-Ing. Heide-Rose Vatterrott
(Bremen University of Applied Sciences)
Dr. rer. nat. Dipl.-Systemwiss. Jan-Oliver Wagner
(Intevation GmbH, Osnabrück)
Program of Study:
Multimedia Technology
Bremen University of Applied Sciences
Osnabrück, June 1 2007
c 2007 Emanuel Schütze, some rights reserved
This work is licensed under the Creative Commons License Attribution-ShareAlike
2.0 Germany. A summary of the licensing agreement can be found in Appendix ??
or at http://creativecommons.org/licenses/by-sa/2.0/de.
A copy of this thesis can be found at http://smartmapbrowsing.org.
Contact: [email protected]
Abstract
The use of web mapping applications has increased considerably over the last number of
years. The growing user base points to a need to investigate the user friendliness of web-based
mapping applications. Free software also plays an important part in this development.
This thesis analyzes the usability of web mapping applications using the following three
steps:
Analysis: First, the usability of eleven selected Free web mapping applications and Google
Maps will be analysed.
Smart Map Browsing : Based on the results of this analysis the term Smart Map Browsing
will be used to indicate the usability of web mapping applications. The properties of
Smart Map Browsing will be derived from the current state of technology and analyzed
for their future potential.
Realization: Finally, for the practical part of this thesis, the Smart Map Browsing feature
animated zooming is implemented into the Free JavaScript web mapping application
OpenLayers. This extension allows the user to scale a map to a new zoom level during
the zooming process.
A first phase of the software development is already integrated into OpenLayers 2.4 RC2
(released in April 2007). The entire animated zooming feature is expected to be included in
OpenLayers 2.5.
3
Zusammenfassung
Die Nutzung von WebMapping-Anwendungen hat in den letzten Jahren stark zugenommen.
Der wachsende Nutzerkreis macht es erforderlich, verstärkt die Gebrauchstauglichkeit von
webbasierten Kartenanwendungen zu untersuchen. In dieser Entwicklung spielt Freie Software eine bedeutende Rolle.
Im Rahmen dieser Arbeit wird die Usability von WebMapping-Anwendungen thematisiert
und in folgenden drei Schritten dargestellt:
Bestandsanalyse: Zunächst wird die Ausgangssituation analysiert. Dazu werden elf ausgewählte Freie WebMapping-Anwendungen und Google Maps auf ihre Gebrauchstauglichkeit
untersucht.
Smart Map Browsing : Auf Grundlage der Analyseergebnisse wird in dieser Arbeit der Begriff Smart Map Browsing als neuer Ausdruck für die Usability von WebMappingAnwendungen geprägt. Die Eigenschaften von Smart Map Browsing werden nach dem
aktuellen Stand der Technik abgeleitet und auf ihre Potenziale untersucht.
Realisierung: Im praktischen Entwicklungsteil dieser Arbeit wird das Smart Map Browsing Feature animated zooming ausgewählt und für die Freie JavaScript-WebMappingAnwendung OpenLayers realisiert. Mit dieser Erweiterung wird die Karte beim Zoomwechsel bis zur neuen Zoomstufe skaliert, um die Orientierung des Nutzers beim Zoomvorgang zu verbessern.
Ein erster Teil der durchgeführten Software-Entwicklungsarbeit ist bereits im April 2007 in
die OpenLayers-Version 2.4 RC2 eingeflossen und veröffentlicht worden. Das komplette animated zooming Feature wird voraussichtlich in die Version 2.5 von OpenLayers mit aufgenommen.
4
Contents
A
Current State Analysis . . . . . . . . . . . . . . . . . . . . . . . . . . . . . . . ??
B
Classification Diagram . . . . . . . . . . . . . . . . . . . . . . . . . . . . . . . ??
C
Test Plan . . . . . . . . . . . . . . . . . . . . . . . . . . . . . . . . . . . . . . ??
D
Creative Commons License . . . . . . . . . . . . . . . . . . . . . . . . . . . . ??
E
Affidavit . . . . . . . . . . . . . . . . . . . . . . . . . . . . . . . . . . . . . . . ??
F
CD-ROM . . . . . . . . . . . . . . . . . . . . . . . . . . . . . . . . . . . . . . ??
5
1 Introduction
The use of web-based maps has seen a tremendous increase over the last few years. In 1999
approximately 40 million maps per day were accessed over the Internet. Two years later this
number had increased to 200 million maps per day, and it is reasonable to expect that this
number has multiplied several times since then. This development also shows the growing
significance of the presentation of spatial information on the Internet [??].
The release of Google Maps in February 2005 caused a sensation in the web mapping industry.
Google Maps presented a novel web-based mapping application which garnered the world’s
attention with its high speed and high degree of interactive mapping capability, as well as
features including high-resolution satellite images and an attractive map design [?]. Google
Maps was able to revolutionize the usability of web mapping applications through its implementation of a pure, client-side JavaScript - an aspect which until then had been neglected
by many existing applications even though usability clearly influences user satisfaction and
greatly contributes to the success of an application.
A search of existing literature shows very little research focusing on the usability of web
mapping applications. Analyses or empirical research on the usability of web mapping applications have not been published to date.
This thesis will examine the usability of web mapping applications by using the term Smart
Map Browsing as an indicator of usability. This expression does not exist in current literature
and will therefore be developed and further defined as part of the work presented herein,
more specifically in Chapter ??. As a result, this thesis intends to contribute to the further
technical development of the usability of web mapping applications.
6
1 Introduction
7
1.1 Objectives
The section below outlines the research objectives formulated at the start of this thesis.
One objective of this thesis is to investigate the current state of client-side web mapping
technology, with an emphasis on the different Smart Map Browsing characteristics of free
Internet map applications. The term Smart Map Browsing will be defined as a result of this
investigation.
For the practical part of this thesis, a Smart Map Browsing feature will be selected and
applied to pure JavaScript web mapping applications. The objective of this extension is to
increase the usability of such applications in web browsers. It is also hoped that a resulting
solution will be widely applicable so that it can be easily integrated into existing free web
mapping applications.
1.2 Thesis Outline
Chapter 2 (Background) gives an overview of the main background materials for this thesis. It will present and discuss terms such as Free Software, Usability, WebMapping and
Open Geospatial Consortium, and explain the basic principles of Web Map Services.
Chapter 3 (Analysis) commences with a current state analysis of selected web mapping applications. The results of this analysis are used to assist in defining the term Smart Map
Browsing. This will be followed by a requirements analysis for the animated zooming
feature. The chapter concludes with a technical analysis of OpenLayers.
Chapter 4 (Concept) provides the concept behind the implementation of the planned OpenLayers extension. It will discuss the technical details as well as the development guidelines of the OpenLayers project, all of which are important criteria to consider for the
implementation process.
Chapter 5 (Implementation) illustrates the steps required for the implementation of the
animated zooming features, as well as the testing procedure and potential difficulties.
Chapter 6 (Conclusion) summarizes the results of this thesis, discusses some of the open
issues and concludes with a look to the future.
Appendix A (Current State Analysis) contains the detailed results of the analysis conducted on the twelve web mapping applications from Chapter 3.
Appendix B (Classification Diagram) shows a complete classification diagram of OpenLayers. All functions and classifications which were changed during the implementation
process are highlighted.
1 Introduction
8
Appendix C (Test Plan) comprises the test plan for the integration testing done in Chapter
5.
Appendix F (CD-ROM) is comprised of a CD-ROM which contains the animated zooming
and panning extension, integrated into OpenLayers, Version 2.4 RC5 (as of May 25,
2007).
2 Background
This chapter discusses relevant background material required for a proper understanding of
this thesis.
2.1 Free Software
2.1.1 Term
The word ’free’ in the term Free Software (FS) is not related to the concept of monetary
value ie. price, but derives its meaning from the idea of »freedom«.
Seen as thus, the term Free Software is defined by the following four freedoms [?]:
1. The freedom to run the program, for any purpose.
2. The freedom to study how the program works, and adapt it to your needs.
3. The freedom to redistribute copies so you can help your neighbor.
4. The freedom to improve the program, and release your improvements to the public, so
that the whole community benefits.
A program is defined as Free Software only when it provides the user with these four freedoms, otherwise it is defined as not free or proprietary. In this thesis, the use of the word
»Free« in capital letters denotes software with the above-mentioned four characteristics ie.
freedoms.
In 1985 Richard Stallman founded the Free Software Foundation (FSF) with the goal of
advancing the concept of Free Software [?]. Free Software does not prohibit the commercial
use of programs (as per Freedom 1). Actually, a market study conducted by the EU Commission in 2007 showed the economic significance of business models based on Free Software
ie. Open Source [?]:
»EU researchers predict that open-source related services will comprise 32 percent
of IT services in 2010. Furthermore, the contribution of the open-source sector to
the GDP could reach 4 percent by that year. Currently, the total IT infrastructure
share of the European GDP is at 10 percent.«
9
2 Background
10
2.1.2 Free Software versus Open Source
Free Software is not the same as Open Source.
Background: The term Free Software is often misinterpreted because »Free« is understood in
terms of price, not freedom (as per the FSF definition). This confusion was one of the reasons
why the Open Source Initiative (OSI) 1 started to use the term Open Source instead (1998).
The main objective of this marketing campaign was to promote the commercialization and
acceptance of Free software in the business sector. This development also resulted in a move
away from focusing on the philosophical and ethical ideas behind Free software, and instead
only emphasized the technical advantages of open source. [?]. Seen this way, Open Source
refers only to open source access, which is a decidedly weaker criteria compared to the
concepts underlying Free Software [?].
2.1.3 Licensing Categories
Software licenses outline a user’s rights to using a software. A Free software license is one
which expressly bestows upon the user the four freedoms outlined in Section 2.1.1. They are
however just as binding as licenses for proprietary software.
The licensing conditions apply when a software is distributed (with or without changes).
Figure ?? classifies a number of Free software licenses (based on their strength of protection)
into four categories [?]:
1. Strong Protection
e.g. GNU General Public License (GPL): A license who modifies a GNU GPL software
agrees to distribute it under the same licensing conditions along with the corresponding
source code.
2. Weak Protection
e.g. GNU Lesser General Public License (LGPL): GNU LGPL The software can be
used in proprietary software, however the GNU LPGL source code must remain free.
3. No Protection
e.g. X11 (modified BSD): The software can be distributed without preserving the source
code or Free Software freedoms; furthermore it can be used in proprietary software.
4. GPL Non-Compatible or Imbalanced
Includes all other Free Software licenses, ie. do not fit criteria outlined in (1) to (3);
e.g. Netscape Public License
Software with numerous different licenses under (1) to (3) are protected by the strongest
license [?]. Free Software licenses with protection are also referred to as Copyleft. Copyleft
means that anyone distributing software (with or without modifications) confers to other
1
http://www.opensource.org [Last Viewed: May 15, 2007]
2 Background
11
Free Software
"copyleft"
proprietary Software
strong protection
ex. GPL
weak protection
ex. LGPL
binary only
no protection, X11 style
unbalanced or
incompatible with GPL
"Shareware"
free download
Figure 2.1: FS Licensing Categories (as per [?])
users the right to further distribute or modify the softwre. Copyleft therefore guarantees
this right for all users. The GNU project describes and compares the difference between
Copyleft and Copyright in the following terms [?]:
»Developers of proprietary software use copyrights to limit the freedom of users
whereas we guarantee it. As a result, we have changed the name ’Copyright’ into
’Copyleft’ to illustrate this difference.«
2 Background
12
2.2 Usability
2.2.1 Terms
The German language contains a number of words which are used synonymously with the
term Usability, such as: Bedienbarkeit, Bedienerfreundlichkeit, Benutzbarkeit, Benutzerfreundlichkeit, Ergonomie, Gebrauchstauglichkeit, Handhabbarkeit, Nutzungsqualität, SoftwareErgonomie, User Experience etc. However, the term Gebrauchstauglichkeit has established
itself as the widely accepted translation of the term Usability. In this sense, the word »Gebrauch« refers to the context in which a product is used. In contrast to some of the abovementioned terms (e.g. Benutzerfreundlichkeit ) this term takes into account not only the user,
but also the task to be completed. If the product does not support the user in completing a
task, it is considered ineffective [??].
The term Usability was initially defined in 1998 as part of the international standard ISO
9241-11; one year later it was translated into German [?]:
English: »Usability« (ISO 9241-11:1998)
»Extent to which a product can be used by specified users to achieve specified
goals with effectiveness, efficiency and satisfaction in a specified context of
use.«
German: »Gebrauchstauglichkeit« (DIN EN ISO 9241-11:1999; German Translation)
»Das Ausmaß in dem ein Produkt durch bestimmte Benutzer in einem bestimmten Nutzungskontext genutzt werden kann, um bestimmte Ziele effektiv,
effizient und zufriedenstellend zu erreichen.«
Jakob Nielsen, who is considered one of the leading authorities in the software and web design
usability field, describes usability as the »degree of quality with which a user experiences an
interaction« [?].
In this thesis the term Usability will be used synonymously with the German terms Gebrauchstauglichkeit and Benutzbarkeit.
2 Background
13
2.2.2 Measurability
The usability of a product can be measured using the ISO attributes of Effectiveness, Efficiency and Satisfaction. At the same time, these characteristics are unlikely to serve as
a consistent standard as their significance will greatly depend on the user context and ultimate use objective. As a result usability should always be viewed in the context of its
objectives. [?]. Given a user’s different needs along with his/her subjective impressions, a
purely objective assessment of usability is almost impossible.
Jakob Nielsen divides the concept of usability into five measurable factors, and also illustrates
the diverse nature of the term usability with an interactive application system [??]:
• Learnability: The user should be able to learn the system easily in order to complete
his/her tasks.
• Efficiency: The user should be able to perform tasks quickly, thereby increasing productivity.
• Memorability: The user should be able to quickly re-establish proficiency in the
operation of the system after a (prolonged) absence.
• Errors: The system should enable the user to have a very low error rate.
• Satisfaction: The operation of the system should be pleasant for the user.
Along these lines usability is seen as a measure of the quality of user-system interaction. It
greatly influences the user’s acceptance and accordingly, the success of a system.
2 Background
14
2.3 Web Mapping
2.3.1 Terms
There are a number of terms which describe the electronic illustration of maps on the Internet
- among the more commonly used are: Internet Map, Web Map, net-based e-map, Cyber Map
etc.
Jens Fitzke also defined three general terms to be used for these types of maps [?]:
GIS online is used as a collective term for all types of GIS applications which are available
through a network. Internet-GIS narrows this focus to network technology based on specific
protocols. In most cases the term can be even further defined by assuming the existence of
a specific client (the web browser), leading to the term WebGIS.
On the other hand, Frank Dickmann uses the terms WebMapping und WebGIS to classify
the electronic illustration of maps on the Internet.
Web Mapping is derived from the term Web Map although it is more strongly associated
with the map production process. Web Mapping includes not only the visual presentation of
maps on the Internet, but also simple viewing features such as Zooming, Panning as well as
Layering. However, these features are not yet considered »GIS adequate« [?].
The term WebGIS is used to indicate a user’s ability to modify attributes beyond the usual
Web Mapping functions, as well as to perform additional GIS operations (such as keyword
searches, search functions, area and distance measurements).
However, since basic GIS analysis functions such as attribute searches are also associated
with Web Mapping, it becomes clear that a clear demarcation line between Web Mapping
and WebGIS does not exist [?].
This thesis will use the term Web Mapping as described by Frank Dickmann, which also
includes the simple analytical functions found in a GIS system.
2.3.2 Classification
Web mapping applications are classified into static and interactive maps, depending on their
degree of interactivity [?].
Static maps or view-only maps are ready-made maps which are integrated into the website
as a stand-alone picture.
In the early stages of web mapping development paper copies of maps were scanned and
subsequently shown on the Internet in bitmap format.
This resulted in a considerable on-line collection of static maps, which is still widely in use
today [??].
The introduction of interactive maps provided users with the option to adjust map sections
to suit their individual needs, as well as to obtain additional information by panning images,
2 Background
15
zooming in, activating other map layers or requesting map-related information. At each
change the map section is redrawn and displayed with the new information [?].
From a technical view the distinction between static and interactive mapping illustrations
is not an easy one to make. For example, a map which has been altered by panning and/or
zooming would still be considered a static map [?] if the zooming function merely changed
the scale of the map without revealing any new detail ie. information.
2.3.3 Architecture
The client-side server model forms the basis of Web Mapping and WebGIS applications,
whereby a web browser becomes the client communicating with the web server. Figure ??
illustrates this process: The client requests a map by sending an inquiry to the web server.
The web server directs the inquiry to the map server which evaluates the inquiry, searches
for the relevant geographical data and generates the corresponding map. The map is then
sent to the web server, where it is integrated into a HTML page and sent back to the client
browser [??].
Figure 2.2: Client-Server Architecture (as per [?])
2 Background
16
Client Technology
On the client side, the existence of a web browser is the only prerequisite for using a web
mapping application. A standard browser will usually be able to illustrate raster data in
GIF, JPG and PNG format.
However, vector data ara not yet supported by all browsers. One example is Mozilla Firefox2
(Version 2.0) which supports the SVG 1.1 specification3 . Because this type of SVG standard
is not yet widely supported by web browsers, vector data does not figure significantly in
current web mapping applications. The topic of web mapping in conjunction with vector
data will not be discussed in further detail at this point, as it is not relevant to the work
presented herein (see [??] for more information).
Server Technology
On the server side, a web server (e.g. Apache 4 ) along with a specific map server is required,
whereby the latter does not have to be installed on the same computer (same applies to the
geodata base) [?]. The UMN MapServer 5 is a free and very popular map server which communicates with the web server via a Common Gateway Interface (CGI). Many web mapping
applications are based on the UMN MapServer (see Chapter ??). Two other significant map
servers are Geoserver 6 and deegree 7 .
2.3.4 Characteristics
What are the main characteristics of a web mapping application? This section provides a
general introduction to the main components and interactive potentials of a web mapping
application. Section 3.1 provides a detailed analysis of selected web mapping applications.
Components
Generally speaking, the user interface of web mapping applications consists of the following
components (Figure ?? shows several of these using the example of OpenLayers):
2
http://www.mozilla-europe.org [Last Viewed: May 15, 2007]
http://www.w3.org/TR/SVG11 [Last Viewed: May 15, 2007]
4
http://www.apache.org [Last Viewed: May 15, 2007]
5
http://mapserver.gis.umn.edu [Last Viewed: May 15, 2007]
6
http://docs.codehaus.org/display/GEOS/Home [Last Viewed: May 15, 2007]
7
http://deegree.org [Last Viewed: May 15, 2007]
3
2 Background
17
• Main Map
The basic component of every application. It contains one or more layered raster or
vector graphics as well as additional components placed into the map.
• Overview Map
Displays the main map (usually showing the full geographic dimensions) in the form
of a smaller navigable reference map and highlights the current view portion of the
main map. The purpose of this map is to assist the user’s orientation, allowing for a
good overview of the maps at hand.
• Pan/Zoom Bar
Includes panning arrows as well as a zoom tool with a slider for changing zoom levels.
• Layer Overview
Lists all available map layers along with an option to turn layers on or off.
• Toolbar
Contains buttons and menu options for activating various (GIS) functions (e.g. Navigation, Analysis, Queries and Printing).
• Scale Bar
Shows the current scale in form of a bar, description field or check box.
• Legend
Explains the colors and symbols used in the map, often in conjunction with the layer
overview.
Figure 2.3: Components of Web Mapping Application OpenLayers
2 Background
18
Interaction Possibilities
With the growth of the Internet and the growing popularity of web mapping applications
the concept of interactivity has become a fundamental component in the development and
usability of mapping applications [?].
Critical to this development is the ability to navigate around a map, allowing the user to
adjust the map by using Drag&Drop per mouse click. By clicking on the panning arrows the
map can also be panned in predefined increments.
Changing the zoom level of a map can be done in a variety of ways: clicking on the + or –
button, double-clicking on the map, using the mouse to open a zoom box, moving of zoom
slider or mouse wheel.
Some web mapping applications also offer panning and zoom navigation options using the
keyboard (see Chapter ??).
Often the user can also change the view of the currently selected map portion in the overview
map (by mouse click or Drag&Drop), which will also change the main map accordingly. In
the same vein, the overview map is updated along with changes made to the main map.
In the layer overview, interactivity includes the ability to turn layers on and off by means of
check boxes or buttons, and to combine layers into one main layer.
Toolbar functions represent varying degrees of interactivity, including the already mentioned
pan/zoom functions as well as options related to printing, querying, object selection, distance
measurements and getting directions.
Two additional interactive features in web mapping applications are represented by cursors
showing the current ground location, and individually adjusted map sizing. Some web mapping applications also offer users the ability to make queries about geographically referenced
objects or obtain more information on other items, thereby creating a highly interactive
environment.
All of the above-mentioned features contribute to the interactive nature of a web mapping
application. The increasing trend towards Web 2.0 and AJAX has also resulted in noticeable
interactivity improvements in the web mapping area. One of the highlights in this area is
the asynchroneous data transfer through the XMLHttpRequest object, as it allows websites
to be refreshed in the background instead of having to be re-loaded after every modification.
Because of this technology, a web mapping application is able to execute a user’s command
in a fairly short time period, as the necessary steps can be completed in the background. As
a result, the usability of interactive web mapping applications is approaching the features of
classic Desktop(GIS) applications [??].
2 Background
19
2.3.5 Tiling
Tiling is a fairly new development - it involves the division of maps into smaller tiles in order
to increase the usability of web mapping applications.
The following section provides a general discussion of the tiling method, using Figure ??
[??]:
In order to create an optimum web mapping environment (ie. not burdening the application
with extraneous data), the application’s maps are initially divided into tiles (a). In effect,
each tile is a small map on its own, however, in combination with the other tiles it forms
one complete map and is not visually distinguishable as a separate unit. Once a specific
map area is selected (b), all tiles which are completely or partially visible in this area must
be loaded (c). In addition, all tiles which border the selected area but are not visible are
also loaded (d). If the user moves or adjusts the map, the tiles loaded in (d) are now shown
without delay. At the same time, all remaining tiles which now border the new selected area
(but are not yet visible) are also loaded for future use, while the tiles no longer bordering
on the new area are removed.
Figure 2.4: Determination of Tiles to be Loaded (as per [??])
2 Background
20
Tiling can be done in two ways: client-side or server-side. In client-side tiling the web mapping
client defines the tiling boundaries and requests each tile from the map server. In server-side
tiling the server divides the map into smaller tiles and sends these to the web browser which
then displays the data on the computer.
Generally the web mapping application performs a client-side management of the loaded tiles,
whereby the tiles are stored in a DOM tree that represents the current HTML website. As
soon as the selected map area is changed, the program calculates the new tiling arrangements,
removes the now extraneous tiles and adds the tiles required for the new selection.
Even though this »tile preloading process« involves a higher amount of data transfer, it
significantly increases the speed of web mapping operations, particularly the navigation
within maps (Map Browsing).
Each zoom level has its own »tile grid«, with uniform tile sizes for each zoom level (usually
256 pixels). During a zoom-in function the height and width of each tile are doubled, that is,
each tile is divided into four new tiles, each containing more detailed information. During
zoom-out the process is reversed: four tiles are combined into one tile.
2.4 Open Geospatial Consortium
The Open Geospatial Consortium (OGC) 8 was formed out of the Open GRASS Foundation
(OGF) in 1994 (known as OpenGIS Consortium until 2004 ). It is an international non-profit
industry association consisting of businesses, government organizations and universities with
a current (May 2007) membership base of over 340 members [??].
The OGC’s objective is to define open standards in the form of interfaces and protocols for
standard access to spatial information, as well as to provide public access to these specifications for the purpose of interoperability [?]. All specifications are arrived at by consensus
R
[?]. OpenGIS
is the registered trademark of the Open Geospatial Consortium [?].
Products and services conforming to OGC specifications allow for a smooth exchange and/or
use of spatially referenced data between different systems. This interoperability, even within
competing applications, also enables users to select an application that best suits their needs
and requirements [?].
8
http://www.opengeospatial.org [Last Viewed: May 15, 2007]
2 Background
21
2.5 Web Map Service
Web Service is a service available over the Internet, which uses a standardized XML-based
messaging system. Web Services are integral to the interoperability of software applications,
that is to say, Web Services support the exchange of otherwise independent web applications
by way of a standardized interface. Web Services operate independent of existing programming languages and operating systems [?].
Web Services are becoming very popular in web mapping applications, where they have been
described as the »future of web mapping« [?]. The so-called Web Map Services (WMS) allow
for a smooth integration of different (raster or vector) maps in web mapping applications
over the Internet. In this process, the role of displaying the map is performed by a Web Map
Server (WMS Server) [?].
2.5.1 Web Map Client
A Web Map Client is the system which integrates the WMS, either server-side (e.g. in a map
server) or client-side (e.g. in a web mapping application).
In a server-side WMS integration individual Web Map Services are cascaded, ie. several
Web Map Services are integrated into one. The resulting linkages (or chain) act as a single
WMS, ie. the chain is not visible to the user. The disadvantage of this arrangment is that the
speed of map display in the browser will be determined by the slowest WMS in the chain.
Another problem area: if one WMS in the chain is disabled, the web map client does not
receive a response and the map area remains empty [?]. Here the map server takes on the
role of the web map client.
During a client-side WMS integration the web mapping application requests the maps
directly from the web map server and then displays these in the browser. When using several
Web Map Services, each WMS can be displayed as a layer in the application. In this case
the browser, ie. the web mapping application, acts as the web map client.
If only external Web Map Servers are used, the web mapping application does not really
require its »own« map server since the extensive map generation process is shifted to the
WMS server. Still, quite a few (Free) web mapping applications are designed to include their
own map server (more on this in Chapter ??).
2 Background
22
2.5.2 OGC conforming WMS
When a Web Map Service fulfills the WMS specifications9 of the OGC, it is referred to as a
OGC conforming WMS. This means that requests to and responses from the WMS must be
done according to a specific standard. The following three queries fall under current OGC
specifications (with the third being optional)[??]:
1. GetCapabilities
queries the WMS’ capabilities.
2. GetMap
requests a specific map.
3. GetFeatureInfo
requests information on individual map objects.
Figure ?? illustrates the relationships between some OGC web services, as well as the main
operators (as defined by the OGC web services).
Figure 2.5: OGC Web Services Architecture (as per [?])
9
http://www.opengeospatial.org/standards/wms [Last Viewed: May 15, 2007]
3 Analysis
This chapter begins with a current state analysis of the usability features in Free web mapping applications. Based on the results of this analysis, the term Smart Map Browsing will
be defined and its characteristics and potential will be derived. A selected feature will be the
subject of a requirements analysis which forms the basis for a subsequent implementation.
The web mapping application chosen for this process will be analyzed in more detail towards
the end of this chapter.
3.1 Current State Analysis
3.1.1 Objective
The objective of this analysis is to provide a general overview of the main Free web mapping
applications and to discern specific user-friendly navigation features. Based on the results of
the overview it should be possible to derive the characteristics and potential of Smart Map
Browsing.
3.1.2 Method
Criteria
Before conducting the analysis, standardized criteria are defined and divided into the following eight categories:
1. General
name, URLs (home, documentation, download, live demo), current version, last update,
license, businesses/organizations (which have/had a major role in the development),
short description
2. System
architecture (client-side or client-serverside), programming language, prerequisites,
supported browser; where applicable, integration with other Free software
23
3 Analysis
24
3. Community
URL of mailing lists (ML), developer and user ML’s (categorized by month and totals of active developers/users within a fixed time period), revision administration,
commercial support
4. Documentation
for installation/development/operation (notes/instructions, tutorials, URLs)
5. Usability
general impression, main map, overview map, layer overview, legend, scale bar, toolbar,
zoom bar, pan navigation panel, zoom, zoom with double-click/mouse wheel/ zoom
box, panning, zooming and panning with keyboard, tiling
6. Additional Features
analysis, search, help and print functions
7. Notes
8. Screenshot
of analyzed demo
Category 1 and 2 provide general information about the web mapping application while
category 3 takes a closer look at the corresponding community and its activities. Category
4 contains instructions, brief evaluations and further information on the available documentation. The usability analysis of the application forms the main part of the investigation
(category 5). It tests and evaluates different GUI components for their usability and interactivity based on a pre-selected demo. Category 6 investigates additional interactive (GIS)
functions that do not play a major role in an application’s usability. Category 7 lists relevant
notes and special remarks. The screenshot shown in Category 8 serves as an illustration of
the demo testing.
Please note that the analysis will not provide a complete list of features for each application.
Specific technical details (for example, the support of WMS or WFS) are not relevant to this
analysis and will not be investigated further. The key focus of this analysis is the usability
of the application.
3 Analysis
25
Mailing List Analysis
The activity of a particular FS community is reflected in its mailing lists (MLs), which are
generally divided into developer and user mailing lists (Free web mapping applications). In
order to compare the activity on the lists, two numbers are used as indicators:
• Average number of mails per month.
• Total number of developers/users who have contributed within a certain time period.
Note: Developers in this context also includes individuals who express an interest in
development but do not actively contribute to the development of the application.
Because ML archives are also divided by month, a six-month time period (October 2006 March 2007) was selected for the purposes of this investigation.
For an automatic determination of the requested numbers, a script written in Python1
performs the count function (see Listing 3.1), provided that that the monthly ML archives
are located (unzipped) in a separate directory and the mails from a particular month are
in one file (unformatted text format). Otherwise an automatic analysis cannot be correctly
carried out.
In this analysis two popular types of ML archives (including their different syntax for sender
information) are used: the very popular GNU Mailman 2 archive (zipped txt files; Syntax
»From [name] at [domain]«) and the ML archive of SourceForge 3 (HTML format; Syntax
»From: [real name] <name@do...>«).
The script is applied to the directories containing the different archive data. Below are the
main steps of this operation:
1. Open file (Line 11)
2. Find line containing string »From « or »From: « (13; 23)
3. Read sender’s mail address (14-17; 24-27)
4. Increase mail count variable (18; 28)
5. Increase user count variable if address not available (19-20; 29-30)
6. Repeat steps 2 - 5 for remaining file lines
7. Analogous read-out of remaining files as per steps 1-6
8. Final output of calculated values (34-38)
1
http://www.python.org [Last Viewed: May 15, 2007]
http://www.gnu.org/software/mailman [Last Viewed: May 15, 2007]
3
http://sourceforge.net [Last Viewed: May 15, 2007]
2
3 Analysis
1
2
3
4
5
26
import o s
def w a l k e r ( arg , d i r , path ) :
months=0
m a i l s =0
users =[]
6
7
8
9
10
11
12
13
14
15
16
17
18
19
20
21
22
23
24
25
26
27
28
29
30
31
32
33
34
35
36
37
38
39
f o r f i l e in path :
i= f i l e . f i n d ( " . " , 0 , 1 )
i f i ==−1:
months=months+1
t e x t=open ( f i l e ) . r e a d l i n e s ( )
f o r l i n e in t e x t :
i f l i n e . f i n d ( "From " )>−1:
f i e l d s =l i n e . s p l i t ( " " )
try :
i f f i e l d s [2]==" a t " :
u s e r= f i e l d s [ 1 ] + "@"+ f i e l d s [ 3 ]
m a i l s=m a i l s +1
i f u s e r s . c o u n t ( u s e r )==0:
u s e r s . append ( u s e r )
except I n d e x E r r o r :
pass
i f l i n e . f i n d ( "From : " )>−1:
f i e l d s =l i n e . s p l i t ( " " )
try :
i f l i n e . f i n d ( " . . . > " )>−1:
u s e r= f i e l d s [ 1 ]
m a i l s=m a i l s +1
i f u s e r s . c o u n t ( u s e r )==0:
u s e r s . append ( u s e r )
except I n d e x E r r o r :
pass
print f i l e +" : %s "%m a i l s +" m a i l s "
print "−−−"
print " months
: "+s t r ( months )
print " m a i l s t o t a l : "+s t r ( m a i l s )
print " m a i l s /month : "+s t r ( m a i l s / months )
print " u s e r s t o t a l : "+s t r ( l e n ( u s e r s ) )
o s . path . walk ( " . " , w a l k e r , None )
Listing 3.1: Python script for analysis of ML archives; MLanalyse.py
Example using analysis of developer ML of OpenLayers:
2006− December . t x t : 36 m a i l s
2006− November . t x t : 131 m a i l s
2006− October . t x t : 196 m a i l s
2007− January . t x t : 262 m a i l s
2007− February . t x t : 342 m a i l s
2007− March . t x t : 510 m a i l s
−−−
months
: 6
m a i l s t o t a l : 510
m a i l s /month : 85
u s e r s t o t a l : 72
3 Analysis
27
Live Demo
Using the sample demo, the listed usability criteria (Category 5) and other defined features
(Category 6) are analyzed. It should be possible to use the demo in Firefox browser without
installation of the application and pre-installed plug-ins (JavaScript activation is assumed).
Generally such demos are available on the home page of the respective web mapping applications.
It is important to bear in mind that a demo will not necessarily include all the functions
available in the actual application. Even the user interface of a demo may only represent a
likely GUI configuration of the application. For this reason it is important to note that this
analysis will focus solely on demos used for this purpose.
Another item worthy of mention is the objective nature of a usability analysis. When evaluating the usability and design of an application the line between objective judgement and
subjective impression is not always clearly defined (see Section ??).
Many of the interactive features of web applications have become standard, and for the most
part meet user expectations, such as the Drag&Drop functions used for moving map areas
or the icons used for zooming and panning functions. Usability criteria such as these can
fairly easily be evaluated on an objective basis.
However, factors related to the design of applications, such as the use of colors or the configuration of different components, invariably involve some range or leeway in making usability
judgements. In the following analysis the subjective evaluation part will be kept to a minimum.
3.1.3 Selection
The Internet portal FreeGIS 4 will be used for the selection of the Free web mapping applications to be analyzed. A search using the key word »Web Mapping« lists more than 50
software tools in the »Software« category (as of April 10, 2007). Because the number is quite
large, some restrictions were applied to achieve a suitable number for the purpose of this
thesis.
Based on the definitions of terms related to web mapping (see Chapter ??) several entries
were removed - for example, MapServer, Geoserver and deegree do not fit the criteria for
required web mapping clients.
Following an evaluation of the remaining entries eleven of the most promising and significant
(as shown by being mentioned on other GIS portals such as OSGeo 5 or MapTools 6 ) Free
web mapping client applications were selected.
4
http://freegis.org [Last Viewed: May 15, 2007]
http://www.osgeo.org [Last Viewed: May 15, 2007]
6
http://www.maptools.org [Last Viewed: May 15, 2007]
5
3 Analysis
28
In this vein the current state analysis does not purport to present an exchaustive analysis of
available applications. It is rather intended as an overview of the variety found in Free web
mapping applications and their usability-related functions.
Owing to the great significance and popularity of Google Maps [?], this proprietary software
will also be compared to the eleven Free software applications.
Below is a list of all twelve selected web mapping applications (in alphabetical order):
• CartoWeb
• Chameleon
• Google Maps
• iGeoPortal
• ka-Map
• Mapbender
• Mapbuilder
• MapGuide Open Source
• MappingWidgets
• OpenLayers
• p.mapper
• WMS Mapper
3 Analysis
29
3.1.4 Result
Complete analysis results of the twelve analyzed web mapping applications can be found in
Appendix ?? (pg. ?? and following) – two pages per tool.
Applications can be classified into the following three types:
Type 1: Free, 100% client-side
Type 2: Free, client-serverside
Type 3: Proprietary, 100% client-side
Two of the twelve applications are Free Software and pure JavaScript applications, which run
exclusively on the client (Type 1), that is to say, they only contact an external map server for
the purpose of requesting the map whereas all functions of the application are implemented
on the client. A map server (e.g. WMS server) is still required but in this case does not form
an actual part of the web mapping application. In the thesis the term client-side is used
when these criteria are fulfilled.
Nine of the twelve analyzed applications are Free software client-serverside applications
(Type 2), ie. the application implies or assumes the existence of a proper map server.
Client-server mixed applications, on the other hand, require an installation. The term clientserverside will be used for this type of web mapping application.
Google Maps is a Type 1 application (pure JavaScript), and the only proprietary application
used in the testing procedure. As mentioned in Section ??, the analysis’ main focus is on
Free web mapping solutions, but given the significance of Google Maps the latter was also
included in the analysis for comparison purposes. Proprietary client-server solutions were
not considered as part of this analysis.
Table ?? shows the most significant results of the analysis along with an opportunity to
compare the selected applications.
proprietary&
??f
S.??f
Google Maps
??f
p.mapper
S.??f
Mapping
Widgets
100%client.
MapGuide
Open Source
S.??f
Mapbuilder
S.??f
Mapbender
S.??f
ka-Map
S.??f
iGeoPortal
S.??f
Chameleon
S.??f
Free &
client-serverside
CartoWeb
S.??f
WMS
Mapper
OpenLayers
Free &
100% client-side
S.??f
Version
last Update
FS-License
2.3
21.02.07
BSD
0.03
k.A.
AFL
3.3.0
31.08.06
GNU
GPL
2.4.1
06.09.06
X11
1.2.1
15.09.05
GNU
GPL
1.0
05.02.07
MIT
2.4.1
23.03.07
GNU
GPL
1.0.1
19.07.06
GNU
LGPL
1.1.0
09.12.06
GNU
LGPL
0.3.1
17.03.06
GNU
GPL
3.0.1
30.12.06
GNU
GPL
2.79
18.04.07
-
Revision Administration
Developer Mailing List (ML)
Mails per Month1
Active Developers2
User Mailing List (ML)
Mails per Month1
Active Users2
SVN
X
85
72
X
197
150
-
CVS
X
16
12
X
80
86
CVS
-
CVS
X
11
7
X
96
121
SVN
X
55
46
X
107
98
SVN
X
120
47
X
65
78
SVN
X
168
42
X
527
297
SVN
-
SVN
-
X
51
63
SVN
X3
49
101
X3
92
106
-
X
82
61
X
-4
-4
Overview Map
Layer Overview
Legend
Scale Bar
Zoom Bar
Pan Navigation
on map edge
in PanZoom Bar
X
X
X/ X
-/-
X
X
X5
X/ X
-
X
X
X
-/X
-
X
X
-/-
X
X
X5
X/ X
-
X
X
X
X/ X
-
X
X/ -
X
X5
X/ X
X
-
X
X
X
X/ X
X
X
X
-/X
X
X
-
X
-
X
-
X
-
-
X
-
-
X
-
-
X
X
X
X(X)
-
X(X)
X(-)
X(-)
X
X(-)
X(-)
X(X)
X(X)
X(-)
X
X(X)
X
X
-
X
-
X
X
X
X
X
-
-
-
X
X
-
Zooming per
Double-click
Mousewheel
Zoom Box (Shift-key)
Panning with
Overview Map
Zooming & Panning
with Keyboard
X
-
-
-
-
-
-
-
-
-
X
X
Tiling
X
X
-
-
-
X
-
-
X
-
-
X
1
Average monthly mail volume Oct 2006 - Mar 2007 (6 months)
Total number of active developers/users in analyzed time period (Oct 2006 - Mar 2007; 6 months)
Uses general user/developer ML of deegree
4 Automatic analysis not possible in Google Groups
5
Legend is integrated into layer overview
3 Analysis
Table 3.1: Listing of Analysis Results of Web Mapping Applications
As of: May 15, 2007
2
30
3
3 Analysis
31
3.1.5 Evaluation
The results obtained in Section ?? are now compared and evaluated according to usability.
This evaluation offers a first thorough overview of exemplary Smart Map Browsing capabilities in web mapping applications and forms the basis for a subsequent definition of Smart
Map Browsing in Section ??.
The evaluation is classified into three categories: GUI Components, Pan/Zoom Characteristics, and Community.
A) GUI Components
Overview Map Eight out of twelve applications feature an overview map which can be manipulated (per mouse click or double-click) to move the main map. Mapbender has an
optional pull-out area which allows a combination of zoom and pan functions. Google
Maps offers animated panning of the main and overview maps with double-click or
Drag&Drop of the viewed section. Ka-Map shows signs of similar animation features.
Once a user zooms the map, the selected section moves in sync with the overview map.
Google Maps and OpenLayers, for example, feature a dynamic overview map which is
automatically zoomed along with the main map (whereas it remains fixed during other
functions). However, the centering of a map section after manual repositioning is only
possible with Google Maps.
Google Maps displays the reference map in the same style as the main map. On the
other hand, in OpenLayers the style is defined only by the active base layer, and overlays are not displayed. Similarly, only Google Maps and OpenLayers offer a minimizable
overview map display.
Conclusion: A close-to perfect rendition in Google Maps; a good approach and similar
potential in OpenLayers. Static overview maps of other tools are not very helpful at
high zoom levels.
Layer Overview Nine of twelve applications feature a layer overview. Three of those use
a layer overview in conjunction with a legend. OpenLayers und Mapbender are able
to completely minimize the control. Other applications offer collapsable (sub-)layers
although this carries with it the risk of interleaving (see CartoWeb, ka-Map).
If the layers list is too long, there is a risk of the user losing track of the layers (see
Chameleon). Similarly, usability is less than optimal when the user has to confirm
a layer selection with an additional click to update the selection (see CartoWeb, extitChameleon, and iGeoPortal). In Ka-Map and iGeoPortal it is possible to select and
change the sequence of different layers. Google Maps displays only three types of layers
options, namely Map, Satellite, and Hybrid.
Conclusion: Good combination possibilities involving the legend, some risk with interleaving, disadvantage with manual update requirements, convincing simplicity in
Google Maps and OpenLayers.
3 Analysis
32
Scale Scale display in web mapping application is quite variable, including the use of
scale bars (such as ka-Map), simple numerical scale indicators (OpenLayers), a predefined menu box(CartoWeb, Mapbender ) or an editable scale text field (Mapbuilder,
p.mapper ).
Conclusion: Selection boxes and text fields look more complex than bars or simple
scale indicators. A semi-transparent bar fits in nicely with the map.
Toolbar All applications investigated for this thesis contain a tool bar, ranging from the very
minimalistic (OpenLayers, WMS Mapper ) to the very elaborate (as seen in ka-Map,
Mapbender ). However, the differences in their functional ranges are quite small. Noticeable features are the Zoom History buttons (as found in Mapbender and MapGuide
Open Source). Most applications however do not automatically adapt the mouse cursor
to the selected tool function.
Conclusion: Generally speaking, featured tool bars show only small differences, with
the »usual« range of tool functions. Applications which are 100% client-side are limited
to the more basic functions.
Zoom Bar Four out of twelve applications feature a zoom bar (OpenLayers, MapGuide
Open Source, p.mapper and Google Maps). In MapGuide Open Source the zoom bar
can be placed anywhere on the map. P.mapper offers a remarkable continuous zooming
feature: when the zoom slider is moved, the map is simultaneously scaled, then redrawn.
However, the non-functioning + and – »buttons« are rather annoying.
Conclusion: Zoom bars offer a good selection of zooming levels. All four applications
offer a remarkably high degree of usability.
Pan Navigation Panel Four applications feature panning buttons at the edge of the map.
On the other hand, three applications offer a navigation panel as part of a combined
pan-zoom bar navigation feature (see OpenLayers, MapGuide Open Source and Google
Maps). In the remaining five applications the map can be panned only by way of
Drag&Drop.
Conclusion: Panning controls are very useful. However, having to navigate through a
map using features located at the edge of the map impairs the visual integration of
the map into a website. A PanZoom bar shortens and thus considerably facilitates the
navigation process.
3 Analysis
33
B) Pan/Zoom Characteristics
Zooming with double-click Only OpenLayers and Google Maps have an automatic zoom-in
option by virtue of double-clicking on the mouse. Applications which require the user
to switch to the ZoomIn tool before being able to click for zoom-in are not considered
here.
Conclusion: The usability feature shows that a smooth transition between panning and
zooming is possible without having to first select a specific tool for this purpose. This
results in very smooth map browsing.
Zooming with mouse wheel Three applications permit a zoom level change by using the
mouse wheel (OpenLayers, Google Maps, p.mapper ). Only Google Maps continues to
show the exact location pointed to by the mouse cursor after the zooming feature has
been activated. In comparison, OpenLayers centres the map according to the location
of the cursor; p.mapper zooms in and out regardless of the location of the mouse cursor.
Conclusion: Similar to the double-click feature, mouse wheel zooming allows for a
smooth transition between panning and zooming. Only Google Maps offers the expected characteristics by adjusting the map in sync with the cursor location.
Zooming per zoom box Ten of twelve applications offer a pull-out box (per mouse) which
allows the user to perform zoom functions for selected areas. Only WMS Mapper und
Google Maps do not offer this feature. The color highlighting of the zoom area is
considered a positive feature (inc. OpenLayers, ka-Map). In five applications it is also
possible to access the zoom box via the Shift-key (inc. OpenLayers, mapbuilder ).
Conclusion: This is a »basic« feature found in most applications (so it is somewhat
surprising not to find it in Google Maps); it is very useful for direct zooming of a
particular area, whereby the use of Shift-key command is also widespread.
Zooming/Panning with keyboard OpenLayers, p.mapper and Google Maps allow Zoom/Pan navigation using the keyboard. Google Maps’ panning key configuration is very
extensive and intuitive.
Conclusion: Only a few applications provide navigation options using the keyboard.
Expanded key configuration offers a good level of convenience.
Zoom Level The ability to see the current zoom level is an important factor in the usability
of an application.
Four application feature an unlimited number of minimum and maximum zoom levels,
ie. no limitation on zoom level intervals (see Chameleon, iGeoPortal, Mapbuilder and
MappingWidgets). Two applications, (WMS Mapper and CartoWeb), define a minimum and maximum zoom depth, but still enable »on-the-spot« zooming. The remaining six applications feature well coordinated minimum/maximum zooming properties.
Applications using a zoom bar offer a particularly good indication of zoom levels.
Conclusion: Good zoom level indicators have a positive effect on usability, unlimited
zoom levels to a lesser degree.
3 Analysis
34
Zoom Reset With the exception of WMS Mapper all applications have the option of reverting a map to its maximum dimension (usually as a button on the tool bar). Google
Maps does a good job of integrating this function into the pan/zoom bar. OpenLayers
does not generally offer the possiblity of combining the zoom reset function with the
expanded zoom bar.
Conclusion: An expected standard feature which should be included in every application.
Tiling Map tiling is supported by five applications (OpenLayers, WMS Mapper, ka-Map,
MapGuide Open Source and Google Maps). A noticeably quick (ie. without delay)
panning process is offered only by OpenLayers and Google Maps. Other applications
feature rather sluggish panning properties.
Conclusion: Noticeably good pan/zoom characteristics in tiling-based applications. Superior panning characteristics in OpenLayers and Google Maps.
Load Time The load time required for panning and zooming are critical factors in evaluating
the usability of a web application.
Tiling-based applications have a clear speed advantage compared to conventional web
applications.
In zooming three different forms of map construction are observed:
• map is constructed by sequentially ordered tiles (OpenLayers, ka-Map, MapGuide
Open Source, Google Maps)
• new map is displayed as a complete unit (inc. Mapbender, Mapbuilder )
• new map is displayed as a complete unit after a certain load time (»loading«
indicator) (iGeoPortal, p.mapper, CartoWeb)
Conclusion: Load times can be lengthy and somewhat disruptive during the panning
process. Zoom changes sometimes result in an empty map background. A gradual tile
assembly ensures a dynamic and visible loading process.
3 Analysis
35
C) Community
Revision Administration Seven applications offer source code administration with SVN7 ,
three provide this by way of CVS8 . WMS Mapper und Google Maps do not provide
source code administration features.
Conclusion: A revision administration is a standard feature in every FS project. The
trend towards the more modern SVN is not surprising.
Developer Mailing List (ML) Seven of twelve applications provide a developer mailing list.
Looking at the monthly number of mails, applications such as MapGuide Open Source
(168), Mapbuilder (120) and OpenLayers (85) are noted for their activity. The remaining applications show between 10 and 50 mails per month.
Leading the number of active developers (using the six month defined time period) is
iGeoPortal with 101 developerss (note that iGeoPortal uses the deegree ML). OpenLayers follows with 72 different developers, whereas the remaining applications range
between 10 and 50 developers.
Conclusion: MapGuide Open Source has a surprisingly high mail activity with relatively
few developers. OpenLayers shows above-average mail activity and the highest number
of active developers in a single project.
User Mailing List (ML) Ten of twelve application have a user mailing list. MapGuide Open
Source is the most prominent with 527 mails per month. The high number is likely a
result of the application’s widespread use due to the earlier proprietary background
of Autodesk. At 197 mails per month, OpenLayers is also counted among the leading
applications. The majority of the applications have mailing lists ranging from 50-100
mails per month.
Among active users MapGuideOpen Source is the clear front runner with 297 mails
per month, followed by OpenLayers at 150. The remaining mailing lists range from 60
to 120 active users in the six month time period.
Conclusion: Noticeably high monthly mail volume at MapGuide Open Source, which
also has the highest number of active users. In the same vein, the number of users and
mails atOpenLayers is also above average (as is its developer mailing list).
7
8
http://subversion.tigris.org [Last Viewed: May 15, 2007]
http://www.nongnu.org/cvs [Last Viewed: May 15, 2007]
3 Analysis
36
3.2 Smart Map Browsing
Using the foregoing analysis results as a base, the objective of the following section is to: a)
devise a definion of the term Smart Map Browsing, b) derive its properties, and c) outline
its potential.
The expression Smart Map Browsing is not used in current literature and will be further
defined and elaborated in this thesis.
3.2.1 Term
The definition for the term Smart Map Browsing is based on the ISO standard for usability
(see Section ??):
Smart Map Browsing describes a web mapping application’s usability in terms of
its effectiveness, efficiency and satisfaction for the user.
The characteristics of Smart Map Browsing are defined by a variety of selfexplanatory, interactive elements and functions which display the expected interactive properties - they define the ideal, user-friendly web mapping application,
taking into account the most current technology available.
3.2.2 Characteristics
The current state of technology related to Smart Map Browsing can be described in more
detail using two categories – GUI components and Pan/Zoom properties. It should be noted
that because these characteristics are based on the current state of technology (effectively a
Smart Map Browsing 1.0 ), medium-term modifications will be required as newer technology
becomes avaialble.
A) GUI Components
Main Map In web applications where the map forms the main part of the application (as
opposed to applications where maps are merely useful »additions« to other functions),
the map should occupy the main part of the application’s interface. A seamless change
in map size (e.g. by moving map edges) allows the user to set a map according to
his/her individual requirements. The ability to adjust the map to the current browser
size is is also considered a positive Smart Map Browsing feature.
One usability aspect in web mapping applications that should not be overlooked is
map design. An attractive map layout, easy-to-read signatures, symbols and lettering,
3 Analysis
37
intuitive colors in attractive combinations and a well-selected graphic picture density
- they all have a positive influence on the attractiveness of a web map [?].
Overview Map The ability to navigate in the overview map is an important criteria in Smart
Map Browsing. The click/double-click along with Drag&Drop drags the selected section
in the reference map. Following the intereaction with the overview map the selected
section is always re-centered. This is an important feature for maintaing the interactive
relationship with the user, as well as to ensure his/her orientation during this process.
By panning the main map, the overview map is also immediately adjusted to the new
location. In this case, a simultaneous panning action (animated panning) involving the
main and overview map is considered ideal as the user is provided with the new map
position but does not lose track of the overall position.
The overview map is also adjusted according to the zoom level in the main map. In this
case the scale used is always larger than the one used in the main map (by a defined
factor) so that the overview map retains its ability to serve as an »overview« for the
user.
The feature allowing the minimization of the overview map is considered useful. Placing
it within the main map means more available space for the main map; at the same
time this location of the overview map places it within the user’s center of attention.
A further improvement to usability would be to also display the active layers in the
main map in the overview map.
Layer Control When a layer is turned on/off, the map is automatically updated (no confirmation required). This feature is an important characteristic of Smart Map Browsing.
The ability to minimize the overview enables the user to turn his/her full attention
to the map at hand. In addition, the ability to change the layer sequence and to integrate a legend into the layer control are also considered useful (depending on the
application).
Legends Legends should be as succinct as possible and directly related to the map contents.
The components of a legend should be ordered according to their significance, grouped
with similar elements and displayed accordingly [?]. Again, the ability to minimize the
legend enables the user to get a better view of the map at hand.
Scale Scale indicators or bars are only useful if they are recalculated for each zoom level [?].
A scale bar should be available during Map Browsing so that estimates of distances
can be done with the naked eye. The use of bars is recommended (particularly for web
applications with »inexperienced« map users) and is preferred over the use of scale
indicators. Ideally, the bar is displayed semi-transparently within the map.
Toolbar Overly extensive toolbars can have a negative effect on the usability of an application. Limiting the toolbar to the advanced query and analysis functions is advisable
as it would result in »smart« Map Browsing. Simple zooming and panning functions
are ideally done with a pan/zoom bar or similar ’intuitive’ pan/zoom features (such
as mouse wheel, double-click). Another important factor in smooth Map Browsing is
3 Analysis
38
the ability to switch between panning and zooming without having to first activate the
respective tool.
In so far that it is considered useful, a mouse cursor should visually reflect the user’s
tool choice (by changing the cursor image) so as to confirm the selection.
In this respect the zoom history feature is a useful Smart Map Browsing feature. This
feature allows a user to un/redo recently-made panning or zooming activities.
Zoom Bar One of the most significant Smart Map Browsing feature is the zoom bar. It
offers a high degree of interactivity and a good visual indicator of the current zoom
level relative to available zoom levels.
The term continuous zooming denotes the ability to scale a map ’on the fly’ by moving
the zoom slider. The map is only loaded to the selected scale when the slider is released.
This feature increases the user’s navigational ability and serves as a good example of
Smart Map Browsing.
Pan Navigation Panel The pan navigation panel offers intuitive and precise panning. Integrating the panel into a Pan/Zoom bar is preferable to locating it on the map edge
because navigation »by mouse« is made simpler and quicker.
According to [?] navigation and control elements in web mapping applications should be
self-explanatory and efficient. They should also be logically grouped to facilitate the use of
the web mapping program. The user should be able to quickly find the required function
instead of being overwhelmed by the available functions. The navigation of a map containing
many different elements is quite complicated and requires a fairly steep learning curve. As a
result, a map navigation control pad which is intuitive should be the main focus, while the
more demanding functions should be simplified as much as possible or at least reduced to a
minimum [?].
It it not imperative to place navigation components outside the map view. The advantage of
placing the controls inside the map is that the user is always aware of the available options,
as they are in plain view (and easily noticed) rather than being relegated to the side. Having
a correspondingly attractive representation of the controls is also beneficial [?].
3 Analysis
39
B) Pan/Zoom Characteristics
Zooming with double-click Zooming with double-clicking on the map enables a smooth
transition between panning and zooming without having to separately switch to the
corresponding controls. This feature increases the intuitive nature of the application
and is therefore defined as a characteristic of Smart Map Browsing.
Zooming with mouse wheel Similar to double-click zooming, zooming via mouse wheel also
increases the usability of the application by ensuring a smooth transition into zoom
mode.
Accordingly, we speak of a Smart Map Browsing feature when the geographic position
shown by the mouse wheel during the zoom process is at the same pixel position after
the zoom is completed. On the other hand, zooming that centres the map according
to the position of the mouse cursor, or does not take into account the actual cursor
position, is not along expected lines and therefore not considered part of a Smart Map
Browsing definition.
Zooming with zoom box The ability to zoom with a pull-out zoom box has become a
standard feature in most web mapping application - a feature most users would now
expect to see. Along with a zoom box button on the toolbar it should also be possible to
draw the zoom box by pressing the Shift-key. In addition, a unicolour, semi-transparent
shading of the zoomed area provides the user with a visual confirmation of his choice.
This useful feature is considered a critical element of Smart Map Browsing.
Zooming/Panning with keyboard Simple navigation manouveurs should be executable with
the plus, minus or arrow keys. An extended, intuitive keypad for the pan function is
considered beneficial to usability (some of the more obvious choices for rudimentary
map re-positioning are Home, End, Page ↑, Page ↓).
Zoom Levels Zoom level intervals should be clearly delineated. The zooming function is
deactivated once the maximum or minimum zoom level is reached, with the corresponding buttons showing that the zooming function is no longer active. Displaying
the potential zoom depth on a zoom bar is also helpful to the user’s orientation while
viewing the map.
Zoom Reset A user would expect to be able to reset the map to its maximum dimensions
by using a zoom reset function. Following the principles of usability, whereby similar
elements are grouped logically, a similar integration of the zoom reset buttons into the
pan/zoom bar is recommended. This means that all zoom and pan functions can be
located outside of the toolbar (see also (A) GUI Components).
3 Analysis
40
Animation Animation in web maps is done for several reasons: To increase the user’s attention level, to direct attention to specific objects, to increase the user’s orientation
during the navigation process or to lead him/her through a specific topic. There are
two different types of animation: temporal and non-temporal [??].
Temporal animation displays spatial changes which occured in a specific period of time
[??]. An example of temporal animation is the display of population growth of a city
in, say, the last century. The user should be able to interact with the animation by
using self-explanatory navigation elements. It is easier to display complex data with
time flow. These types of animations should take place within the confines of the main
map and not replace a web mapping application’s interactive Map Browsing.
Non-temporal animation displays spatial data of one concrete point in time with different illustrations [??]. An example of non-temporal animation would be an automatic
»ZoomTo« feature, whereby the user is led to a specific location through the use of
non-temporal animation. This in combination with map navigation controls results in
very dynamic pan and zoom properties, which are described as animated panning and
animated zooming in [?]. The user’s orientation and ability to judge distances ie. scale
is not hindered.
Cartographic animations increase the user’s attention and add considerable value to
the map. Animations (within a reasonable range) are an important characteristic of
Smart Map Browsing.
Tiling One of the most fundamental characteristics of Smart Map Browsing is the tiling of
maps. To reduce the cumbersome computing time associated with servers, a client-side
tiling is to be preferred over server-side processes (see Section ??). Provable measurements were not carried out. Ideally, tiling results in an absolutey smooth (ie. without
delay) map movement. During zooming the tiles are assembled in a spiral or star-like
manner, beginning from the middle of the map. This dynamic loading process provides
the user with a visible confirmation of the map loading process.
Load Time The most important criteria of a web page is its load time [?]. Here a distinction
between objective and subjective load time needs to be made. The former is the time
actually required to load a page; the latter refers to the user’s personal impression of
time while the page is loading. According to Jakob Nielsen the objective load time
should not exceed eight seconds. Anything above this value negatively affects the usability of a web application.
In the context of web mapping applications, the most important issue is the time required for a user to be able to view a map. The load time required for the complete
page, including all details and if applicable, pre-loaded tiles for the non-visible area, is
less significant in this case [?].
3 Analysis
41
Ideally there is no time delay during a drag procedure (see Tiling). A map constructed
with sequentially appearing tiles appears to take less time (ie. has a faster subjective
load time) than an untiled map which is shown only when the process is completed.
Tile Caches can be used to increase the objective load time during tiling. A more
detailed discussion follows in the next section.
Inherent in the definition of Smart Map Browsing is the user’s ability to interact with a web
mapping application in a variety of ways. At the same time, the usability of each interaction
is of paramount importance, that is, the performance of the component(s) should always
conform to expectations.
3.2.3 Potential
The main characteristics of Smart Map Browsing along with their potential in the web
mapping area are featured below:
Tiling (client-side tiling only) is without doubt one of the most significant characteristics
of Smart Map Browsing, with great potential for user-friendly web mapping applications.
However, tiling on its own (see Chapter ??) does not guarantee good Smart Map Browsing.
Even the highest-performance application cannot offer good usability if the response time
of the map server is very long. Tiling does not predict the objective load times of tiles. In
the spirit of the Smart Map Browsing definition, the goal should be to reduce objective load
times as much as possible.
One solution is server-side Tile Caching (client-side caching will not be discussed). Here
the tiles are kept on the server in the form of readily rendered graphics, thereby reducing
the response time of the map server: When a client requests a map, the server does not have
to generate the map, instead it accesses the finished tiles (usually stored in the file system)
and sends them to the client in a considerably shorter time frame. For this purpose, the tiles
must be of uniform size and available in a pre-defined tile grid.
WMS Tile Caching 9 or WMS-Cached – in short, WMS-C – is representative of an initial
recommendation on how such a standard could look based on the OGC WMS specifications.
A more detailed suggestion for a standardized solution is described in the WMS Tiling
Client Recommendation 10 , a result of the Tiling Discussion Group at the FOSS4G Conference 200611 in Lausanne. Based on this recommendation the US company MetaCarta 12 has
developed the implementation of TileCache 13 – a WMS-C compliant server, available under
the BSD license. TileCache is a Python-based WMS/TMS14 server containing mechanisms
9
http://wiki.osgeo.org/index.php/WMS_Tile_Caching [Last Viewed: May 15, 2007]
http://wiki.osgeo.org/index.php/WMS_Tiling_Client_Recommendation [Last Viewed: May 15, 2007]
11
http://www.foss4g2006.org [Last Viewed: May 15, 2007]
12
http://www.metacarta.com [Last Viewed: May 15, 2007]
13
http://www.tilecache.org [Last Viewed: May 15, 2007]
14
http://wiki.osgeo.org/index.php/Tile_Map_Service_Specification [Last Viewed: May 15, 2007]
10
3 Analysis
42
for the rendering and caching of tiles. In the most simple scenario, TileCache can create its
own local cache of (all) tiles on the hard drive. It accomplishes this by means of write access
to the hard drive, the ability to execute Python CGI scripts and the designation of a chosen
WMS server. The tiles are subsequently requested by a WMS-C or TMS-supporting client
(such as OpenLayers). TileCache is said to speed up WMS requests by a factor of 10 to 100.
The use of TileCache under mod_python 15 supports more than 300 requests per second [?].
Server-side tile caching offers significant potential for the further development of Smart Map
Browsing in web mapping applications. Despite the short history and still outstanding OGC
standardization of WMS-C, noticeable progress in the load times of WMS maps has been
made. Accordingly, tile caching promises to become a fundamental feature of Smart Map
Browsing.
By turning the focus to the navigational elements of web mapping applications the Smart
Map Browsing ability of the Zoom Bar is noteworthy. The analysis (see Section ??) shows a
noticeably improved usability in the four applications which feature this type of component.
The zoom bar in combination with a pan navigation panel and a zoom reset button enables an
implementation of the above-mentioned usability guidelines. The defined aspects of the zoom
depth orientation (see Section ??) offer additional opportunities to influence the concept of
usability.
In conclusion, the use of a zoom bar offers great future potential.
Closely connected to this development are the very recent and innovative attempts at animating different navigational features. Animated panning and animated zooming are
Smart Map Browsing features which are currently implemented in only three of the analyzed
applications.
Animated panning, in conjunction with tiling, offers a good method of assisting users to
go from point A to B by way of an animated and no-delay process. Similar to Drag&Drop
panning, this process demonstrates to the user that the viewed map selection is only a part
of a whole, seamlessly connected map - a clear advantage in preserving the user’s orientation
in the viewing process.
Essentially, the animated zooming feature is an automatic zooming process that animates
the transition from zoom level A to level B. During the zooming process the map is scaled
and redrawn once zooming level B is reached. This type of animation permits the zooming
in and out of the map at one or more zoom levels. animated panning and zooming is also a
possibility.
Furthermore, the animated zooming feature implies an additional function: Moving the slider
of a zoom bar results in a seamless rescaling (up or down) of the current map. This is an
example of manual non-temporal animation.
An accepted glossary term for zooming animations in web mapping applications does not yet
exist. Given the similarity to animated panning characteristics the term animated zooming
seems a plausible choice. On the other hand, Google Maps, uses the term continuous zooming to denote zooming animation per mouse wheel (currently only in Windows operating
15
http://www.modpython.org [Last Viewed: May 15, 2007]
3 Analysis
43
systems). In this discussion the term animated zooming is used to denote automatic zoom
processes (initiated by e.g. click, double-click, mouse wheel or zoom box). Furthermore,
animated zooming is used as a collective term describing all animation-supporting zoom
processes in web mapping applications, including continuous zooming (used interchangeably
with seamless zooming).
It stands to reason that these two recent features (animated panning und zooming) will play
a signficant role in the further development of Smart Map Browsing. Currently, some performance problems (caused by limited band width or client hardware) can occur with extensive
animation, which could negatively influence usability. At the same time, the future potential
of these extensions is clearly recognized, and it is conceivable that they will soon become an
intrinsic part of any web mapping application.
3 Analysis
44
3.3 Requirements Analysis
One of the more surprising observations in Section ?? is the extraordinary continuous zooming feature of p.mapper. OpenLayers on the other hand is convincing in almost all other
areas, and in addition has one of the most active communities in the Free web mapping
area. Furthermore, using the new term Smart Map Browsing (see Section ??) as a guide,
there is great development potential for OpenLayers and animated zoom processes. A zoom
feature similar to the one featured in p.mapper would be an ideal addition to OpenLayers.
Based on the reasons stated above, the Free web mapping application OpenLayers supplemented with a novel add-on animated zooming feature was selected for the practical part of
this thesis. This section details the exact requirements for this type of add-on feature.
3.3.1 Purpose
The purpose of the practical thesis portion is to implement the Smart Map Browsing feature
animated zooming into the Free mapping application OpenLayers.
The main purpose of the extension is to assist during navigation, so as to ensure the user’s
orientation during the zoom process.
Note: Empirical measurements will not be conducted, therefore a measureable enhancement
is not possible. However, the definition of Smart Map Browsing implies that this extension
would have a positive effect on usability. In comparison to non-animated zoom processes
(whereby the map »jumps« into the desired zoom level), an animated continuous zoom
process would noticeably improve the user’s orientation, which would likely also lead to
greater acceptance by the community. A general consensus regarding the attractivness of
this extension is evidenced by the mailing list discussions on animated zooming.
3 Analysis
45
3.3.2 Must-Have Criteria
The functionality of an application (as seen from the user’s point of view) is described by
the following Must-Have requirements:
1. It should be possible to freely move the zoom slider on the zoom bar by holding down
the left mouse key. This means implementing the following application scenarios:
a) The selected view of the main map is scaled on-the-fly by moving the zoom slider.
b) During ZoomIn the map is scaled by an enlargement of visible tiles. Depending
on the difference in zoom levels, the tile bitmap graphics will be somewhat or
significantly more pixelated.
c) During ZoomOut the main map is initially scaled by decreasing the size of visible
tiles. The resulting white border (around the smaller map) should be filled in such
a way that the user is always viewing a completely filled-in map surface.
The redrawn map surface is scaled relative to the tiles of the original map selection.
d) If several overlays are activated, they are scaled together with the selected base
layer. Note that items such as symbols and letters will also be scaled up or down
as part of this process.
e) The overview map contains a marker, whose size adjusts along with the zoom
process (simultaneously with the modifications to the main map). The marker
always shows the current area of the main map.
2. As soon as the user selects the desired zoom level (by releasing the left mouse key),
the hitherto scaled bitmap tiles (along with all activated overlays) are redrawn.
3.3.3 Should-Have Criteria
The should-have criteria for the animated zooming feature are defined as follows:
1. Full animated zooming support for all layer types available in OpenLayers.
2. Zoom Animation with Zoom Bar (buttons)
a) On clicking the + or – button at the end of the zoom bar, the map is zoomed in
or out by one level.
b) On clicking at a specific point on the zoom bar, the map is zoomed to the level
indicated by the pointer.
3 Analysis
46
3. Double-click Zoom Animation
a) When a user double-clicks on the map, the map will be zoomed in by one zoom
level. The geographic position of where the double-click ocurred is now the new
centre of the scaled map view.
b) With double-click animation the zoom and pan processes are combined. This requires only an animation of the zoom process; the panning occurs before zooming
without animation.
4. Zoom Animation with Mousewheel
a) By turning the mouse wheel up (ie. away from the user) or down (ie. towards the
user), the user is able to zoom into/out of the map by exactly one zoom level.
b) As per the Smart Map Browsing definition of mouse wheel zooming properties (see
Section ??), zooming per mouse wheel is described as follows: »The geographic
position below the cursor at the time of mouse wheel operation remains at the
same pixel position after the zoom has been completed.«
5. Zoom Animation with Zoom Box
a) Once the user has pulled up a map area and released the left mouse key, the map
is zoomed to a level that displays this selected area.
b) Using the zoom box tool to click on the map (without pulling the zoom box
into the map) results in a zoom action equal to one zoom level. The geographic
position of where the click occured now becomes the new center point of the map.
c) In zoom box animation zooming and panning processes are combined. Only an
animation of zoom processes is required however; panning occurs before zooming
without animation.
6. Zoom Animation with Keyboard
a) Pressing the + or – key results in a one level zoom increase/decrease.
The following is valid for each zoom animation:
The animated zoom process occurs automatically within a defined time period. The zoom
slider moves in sync with the animation until the desired position (up or down) is reached.
Once the map is at its highest/lowest zoom level, no additional zoom-out or zoom-in animation is possible. During the zoom animation the marker in the overview map adjusts itself
continuously to the section of the main map. As long as the zooming animation is active, no
additional zoom processes can be activated.
3 Analysis
47
3.4 Technical Analysis of OpenLayers
At this point the functionality of OpenLayers will be examined in more detail. The purpose
of this analysis is to increase the understanding of the application as well as to serve as a
premise for the subsequent conceptualization and implementation.
3.4.1 General
OpenLayers is a pure JavaScript API for the creation of web mapping applications; it also
offers support for the use of numerous (standardized) formats (OGC WMS, OGC WFS,
GeoRSS, ka-Map, WorldWind and many more) which are integrated as layers into OpenLayers.
In addition, OpenLayers features panning and zooming of maps, client-side tiling, markers,
»popup windows«, various adjustable navigation components, keyboard commands, a robust
event handling mechanism and more. Each part of OpenLayers is configurable [?].
A Python/Shell-based script enables the automatic creation of a lite version of OpenLayers,
whereby selected classes can be integrated into one single JavaScript file [?]. This is a result
of a discussion that took place in September 2006 at the FOSS4G Conference, where such a
solution called webmap.js was requested [??].
The target group for OpenLayers includes all users or developers who wish to display a map
on the Internet, or build a map-based Internet application [?].
History
The February 2005 release of Google Maps drew a lot of attention. As a result of numerous reverse engineerings of Google Maps codes (by Phil Lindsay, among others16 ) Google
responded with its first Google Maps API17 in June 2005. However, the possibility for commercial implementation did not exist [??].
Recognizing this deficiency, the US company MetaCarta, in cooperation with Phil Lindsay,
developed a first prototype of the eventual OpenLayers which was presented in late June
2005 at the Where 2.0 Conference in San Francisco18 . One year later, shortly after the
June 2006 Where 2.0 in San Jose, the team headed by developers Schuyler Erle, Chrisopher
Schmidt and Erik Uzureau released the first official version (1.0) of OpenLayers on July 5,
2006. Not long after, in August 2006, Version 2.0 of the project was released[??].
At present OpenLayers is undergoing the incubation process at the independent Open Source
Geospatial Foundation (OSGeo), with the goal of being accepted as a software project by
the summer of 2007. Parallel to this process, serious efforts are being made to integrate
16
http://stuff.rancidbacon.com/gmaps-standalone [Last Viewed: May 15, 2007]
http://www.google.com/apis/maps [Last Viewed: May 15, 2007]
18
http://conferences.oreillynet.com/cs/where2006/view/e_sess/9310 [Last Viewed: May 15, 2007]
17
3 Analysis
48
key functions of OpenLayers into other Free web mapping applications [?] – with ongoing
discussions at ka-Map 19,20 , Mapbuilder 21 and Mapbender 22 .
3.4.2 Class Overview
Because of its object-oriented programming, the API of OpenLayers is divided into a multitude of classes, of which the main ones are briefly described below. The remaining classes are
not discussed in any further detail, as they are not a requirement for a basic understanding
of API. More detailed information can be found in the JSDoc documentation23 . A complete
classification diagram of OpenLayers (Version 2.4 RC5; as of May 25, 2007) can be found in
Appendix ?? on page ??.
OpenLayers.Map is the main class of the OpenLayers API. It compiles the application’s
main map and provides numerous methods for the administration of the map display,
including the display of layers and operating components, zooming and panning. In
addition, this class allows for queries of current map status through numerous ’get’
methods.
OpenLayers.Layer: Layers represent the most significant component of OpenLayers. All
map displays are based on the Layer class. Layer.js produces individual layers, sets
the transparency and resolution of each, and provides the basic ’get’ methods.
OpenLayers.Layer serves as the primary class for a number of special subclasses. Version 2.4 RC5 of OpenLayers supports the following layer types: Free tile-based layers
(WMS, MapServer, KaMap, TMS, WorldWind ), Free untiled layers (WMSUntiled,
MapServerUntiled ), proprietary third-party layers (Google, VirtualEarth, Yahoo, MultiMap) as well as the layers Image (for displaying raster graphics) and Canvas (for
drawing of colored lines, only Overlay display is possible).
Below four layer classes are described in more detail:
OpenLayers.Layer.Grid
Derived from the HTTPRequest class, Grid serves as one of the important primary
classes for the above-mentioned Free tile-based layers. Grid.js divides the layers into
tiles, holds them in an array, and loads them as a spiral-like sequence beginning from
the middle.
OpenLayers.Layer.WMS
As a subclass of Grid, WMS receives the URL of the WMS servers and is responsible
for generating the individual tile WMS URL’s based on the desired tile boundaries
(bounds).
OpenLayers.Layer.WMS.Untiled
The Untiled class displays the complete map section in a WMS tile URL. Note that
19
http://lists.maptools.org/pipermail/ka-map-users/2006-June/001729.html [Last Viewed: May 15, 2007]
http://ka-map.ominiverdi.org/wiki/index.php/OpenLayers_ka-Map_Merge [Last Viewed: May 15, 2007]
21
http://geoservices.cgdi.ca/mapbuilder/demo/openlayers/index.html [Last Viewed: May 15, 2007]
22
http://www.mapbender.org/index.php/Open_layers [Last Viewed: May 15, 2007]
23
http://dev.openlayers.org/docs/overview-tree.html [Last Viewed: May 15, 2007]
20
3 Analysis
49
many WMS servers will have a pre-defined maximum tile size of 2048 pixels; if OpenLayers requests a larger map section, the WMS server will send an error message and
the map view will remain empty.
OpenLayers.Layer.Image
Derived from Layer, the Image class permits the display of individual bitmap graphics
as map layers. Besides a URL, the pixel size as well as the geographic dimension of
the requested picture are also required.
OpenLayers.Control: Operating elements in OpenLayers are elements related to map navigation as well the display of map information (e.g. scale). The Control class serves as
a base class for all operating elements, among them:
OpenLayers.Control.PanZoom
generates pan/zoom navigation with a panning pad (4 arrow buttons), as well as a
ZoomIn, ZoomOut, and ZoomReset button. The slideFactor parameter defines the
number of pixels used during the panning processes.
OpenLayers.Control.PanZoomBar
generates a pan/zoom bar with a pan navigation panel as well as a zoombar with a
zoom slider containing a ZoomIn and ZoomOut button at each end. (see Section ??
on page ??).
The zoom bar is integral to the development of animated zooming features. For this
reason its functionality is described in more detail.
There are three ways to use the zoom bar:
1. Click on the + or – button located at each end of the zoom bar.
This results in an increase/decrease of the map view by one zoom level.
2. Click anywhere on the zoom bar.
The slider moves to the nearest predefined zoom level. The map is redrawn to the
corresponding zoom level.
3. Use Drag&Drop to move zoom slider smoothly over the zoom bar.
Upon releasing the left mouse key, the slider positions itself on the next available
zoom level, and the selected map view is redrawn to the corresponding zoom level.
OpenLayers.Control.OverviewMap
generates a small overview map (see Section ??; pg. ??). This map shows the current
view of the main map and serves as a positioning and navigational tool. The overview
map is usually located in the lower right hand side of the map and can be minimized
by pressing a button on the map edge. This class provides the functions needed for
querying and setting of the selection rectangle, which can be moved by way of defined
mouse events.
OpenLayers.Control.KeyboardDefaults
defines type and activities of (keyboard) key commands.
OpenLayers.Control.MouseDefaults
defines map activity during mouse events. This includes click, double-click, mouse
wheel and mouse movement events.
3 Analysis
50
OpenLayers.Tile: When a map is tiled, each tile is defined by a Tile object. To generate
a tile, the corresponding layer, pixel position, geographic tile dimensions, the URL
and pixel size of the tile are required. The standard tile size is 256 pixels. An option
available during map initialization allows for a change of the standard size.
OpenLayers.Tile.Image
Derived from the Tile class, the Tile.Image object presents the proper tile graphic and
creates an img-Div-HTML element for each tile during the drawing of the map.
OpenLayers.Events takes over the event handling from OpenLayers.
OpenLayers.Pixel displays monitor coordinates in n x- and y- pixel values.
OpenLayers.Size displays a pixel size value pair in width and height.
OpenLayers.LonLat displays geographic coordinates in longitude and latitude.
OpenLayers.Bounds displays a rectangular area (bounding box ) whose four sides (left, below, right, above) are indicated with geographic coordinates in float format. The
Bounds class provides different get-functions (e.g. center and pixel dimensions of the
bounding box ) as well as comparative functions (e.g. whether a pixel is located within
the defined bounding box ).
OpenLayers.Util contains the different functions and settings which cannot be assigned to
any of the otherOpenLayers classes.
3 Analysis
51
3.4.3 Unit Tests
OpenLayers uses the Test.AnotherWay 24 framework for unit tests. Version 2.4 RC5 of OpenLayers (as of May 25, 2007) supplies almost 1500 unit tests, which are controlled over
a central web interface25 . The framework offers the ability to test HTML and JavaScript
source codes, and also provides the test results.
Each HTML test page contains one or more JavaScript test functions which start with test_;
they must also define a test object t as the transfer parameter [??].
11
12
13
14
15
16
17
18
19
20
21
22
23
24
25
26
27
28
29
30
<html>
<head>
< s c r i p t s r c = " . . / l i b / OpenLayers . j s "></ s c r i p t >
< s c r i p t ty p e = " t e x t / j a v a s c r i p t ">
function test_Map_Zoom ( t ) {
t . plan ( 1 ) ;
var map = new OpenLayers . Map(" map " ) ;
var l a y e r = new OpenLayers . Layer .WMS("ABC" ,
" h ttp : // example . com/123" ,
{ ’ layers ’ : ’ test ’ });
map . addLayer ( l a y e r ) ;
map . zoomTo ( 0 ) ;
t . eq (map . zoom , 0 , "Map zoomed to l e v e l 0 c o r r e c t l y . " ) ;
}
</ s c r i p t >
</head>
<body>
<d i v i d="map" s t y l e ="width : 512 px ; h e i g h t : 512 px ;"/ >
</body>
</html>
Listing 3.2: A sample of a simple test page with a test function
Listing ?? shows a sample test page which can be used for a simple testing of an OpenLayers
function. On line 6 the test function defines the number of planned tests (here: one), with
the expectation that they will be completed correctly. If the number does not match the
number of actual tests, the test function is not successful. Lines 7 to 12 produce a map with
a WMS layer, at zoom level 0. Line 13 tests the assertion that the map is actually at zoom
level 0.
24
25
http://straytree.com/TestAnotherWay/doc [Last Viewed: May 15, 2007]
http://openlayers.org/dev/tests/run-tests.html [Last Viewed: May 15, 2007]
3 Analysis
52
The testing framework provides five methods for the testing of self-defined assertions:
• t.ok(boolean, “String for output”)
The test is successful if the assertion boolean is true.
• t.eq(value1, value2, “String for output”)
The test is successful if the value1 value corresponds with the expected value2 value.
• t.like(string, regEx, “String for output”)
The test is successful if string corresponds with the regular term regEx.
• t.html_eq(HTML1, HTML2, “String for output”)
The test is successful if HTML1 corresponds with the expected value HTML2; each HTML
can be stated as DOM Element or HTML string.
• t.fail(“String for output”)
Used for a deliberate test failure; expects only output string.
Examples and additional information on the functionality of the framework can be found in
the [?] documentation.
4 Concept
The previous sections of this thesis provided a current state analysis as well as an overview of
the functionality of OpenLayers. The purpose of this chapter is to draft an implementation
concept for the animated zooming feature.
4.1 Objectives
The objective of the practical part of this thesis is to implement a new Smart Map Browsing
extension for the Free JavaScript web mapping application OpenLayers.
The new animated zooming feature is intended to expand the functionality of OpenLayers
with a user-friendly zooming extension: On moving the zoom slider, the scale of the main
map is simultaneously and smoothly adjusted to the most current slider position, thereby rescaling the map by enlarging or reducing it. Once the slider is released, the map is redrawn
at the new zoom level. An improvement in the user’s orientation during zooming is an
important objective for this extension.
Cooperation with the developers of OpenLayers is desired to achieve an optimal benefit level
for this feature. In this process suggestions made by the developers would also be taken into
account. The goal is the adaption of the animated zooming features into the current SVN
developer’s version, with the eventual objective of making it a part of the next official version
of OpenLayers.
4.2 Functionality
At this point the conceptualized animated zooming scale model is introduced in detail. The
discussion starts with a description of the full zooming process using a zoom slider, followed
by a description of the special features of the ZoomOut process.
53
4 Concept
54
Suppose Zn is the current zoom level of the main map, Zmax the maximum ZoomIn level,
and Zmin = 0 as the minimum ZoomOutlevel, for which the following applies:
Z ∈ N and Zmin ≤ Zn ≤ Zmax
The following steps describe the developed scaling model as well as the exact process involved
in using the zoom slider. A state diagram (Figure ??; pg. ??) and an activity diagram (Figure
??; pg. ??) illustrate this model. The individual steps involved are referenced by the numbers
contained in the processes of the activity diagram:
1. The user points the mouse on the zoom slider, presses and holds down the left mouse
key. As soon as he/she releases the key, the process is stopped and completed with
Step 8.
2. The current zoom level Zn is determined.
3. All tiles k within zoom level Zn , which are fully or partially located in the visible area,
as well as all pre-loaded tiles which border on this area, are determined.
4. The user decides on a zoom direction (ZoomIn or ZoomOut).
5. At this point the compatibility of the decision made in (4) with the current zoom level
Zi (in the first round Zi = Zn ) is verified, ie. if Zi = Zmin , respectively Zi = Zmax ,
then ZoomOut or ZoomIn is not possible. In this case, a new zoom direction must be
selected (Step 4). Otherwise the process continues with step (6).
6. The corresponding zoom-scale process occurs in tandem with the zoom slider operation
(in the direction chosen in (4)):
a) New zoom slider position Pi is determined.
b) New zoom level Zi = Z(Pi ) is calculated.
c) New (scaled) tile size K(Zi ) of the current zoom level Zi is calculated on the basis
of Zn . The following rules apply:
K(Zi ) = 2Zi −Zn ∗ K(Zn )
f”ur Zn < Zi
(4.1)
K(Zi ) = K(Zn )
1
∗ K(Zn )
K(Zi ) =
Z
n
2 −Zi
f”ur Zn = Zi
(4.2)
f”ur Zn > Zi
(4.3)
Starting with zoom level Zn the tile size K(Zn ) is doubled with every new zoom
level (for Zn < Zi ; see equation 4.1) or halved (for Zn > Zi ; see equation 4.3)
so as to obtain the new tile size K(Zi ) for the currently active zoom level Zi . At
equal zoom levels (Zn = Zi ) the tile sizes are of equal size (see equation 4.2).
Note: The individual zoom levels serve only as defined interim values. The actual
scaling process occurs continuously.
d) During the ZoomIn or ZoomOut process all currently loaded (visible and nonvisible) tiles are scaled to the calculated tile size K(Zi ) (more accurately: expanded or shrunk).
4 Concept
55
e) Only for ZoomOut: As soon as all tiles k (as defined in (3)) are sized to a
level where all are part of the visible area, additional tiles must be loaded in the
background to avoid the creation of a white border during ZoomOut. A more
detailed discussion on tile preloading in ZoomOut processes is provided in the
following paragraph »Special Features of ZoomOut«.
7. As long as the left mouse key is held down (see Step 1), the user can change the zoom
direction at any time, which brings the process back to (4). Once the mouse key is
released, the zoom process is completed with (8).
8. The visible area is redrawn in the new zoom level Zi including all required tiles (using
standard tile size K(Zn )). In addition (according to the principles outlined in the tiling
method; see Section ??), all adjacent non-visible tiles are preloaded at the same size.
This completes the zoom process.
left mouse key pressed and held down
zoom slider is used
MouseUp
[Zn > Zi]
MouseMove
ZoomIn [Zn < Zi]
MouseUp
map is scaled (shrinked)
map is scaled (enlarged)
MouseUp
left mouse key released
MouseUp
map is updated
Figure 4.1: State Diagram of Zoom Process Using Slider
MouseMove
4 Concept
56
Press left mouse key (1)
determine current zoom level Zn (2)
determine all loaded tiles k in Zn (3)
select zoom direction (4)
[Zn=Zmin]
[to -]
[Zn=Zmax]
[to +]
check current zoom level (5)
check current zoom level (5)
[Zn>Zmin]
[Zn<Zmax]
ZoomOut Scaling
ZoomIn Scaling
determine new zoom slider position Pi (6a)
move zoom slider
towards - (6)
move zoom slider
towards + (6)
determine new zoom level Zi (6b)
determine new zoom slider position Pi (6a)
determine new zoom level Zi (6b)
[Mouse key pressed and held down]
calculate new tile size K(Zi) (6c)
calculate new tile size K(Zi) (6c)
enlarge tile (6d)
shrink tile (6d)
load adjoining tiles (6e)
[mouse key released]
redraw all tiles at zoom level Zi (8)
Figure 4.2: Activity Diagram of Zoom Process Using Slider
4 Concept
57
Special Considerations for ZoomOut
Two solutions regarding the preloading of tiles in Steps 6e of the zoom process are introduced.
The objective is to ensure quick tile loading (ie. without delay) and thereby eliminate the
creation of a white border around a now smaller map.
A) As soon as a previously non-visible tile of k becomes part of the visible area, all nonvisible tiles are newly defined and preloaded in the background at zoom level Zn . They
are stored as new, non-visible tiles in the DOM tree. All loaded tiles are immediately
adjusted to thr current scale, ie. they are simultaneously adjusted to the same scale as
the remaining tiles (where the calculated tile size is K(Zi )).
The disadvantage: the zooming process requires a continuous loading of a large number
of tiles which also have to be scaled in accordance with the remaining tiles. Therefore
it is likely that performance is negatively impacted by an increased number of tiles.
B) A special feature of the second solution is a newly defined »ZoomOut tile«. In addition
to the tiles k described in Step 3, during initialization of the application one additional
tile k∗ is loaded for the purpose of executing the Zoom Out process. k∗ shows the
geographic dimension of the complete map on one tile. The pre-defined tile pixel size
K∗ of k∗ is to be larger than the pr-edefined tile size Kk of all tiles k by a factor of x:
K∗ = x ∗ Kk , whereby x ≥ 1 and x ∈ R. A suitable value for x is dependent on the
size of the whole map as well as the number of possible zoom levels; it is determined
in the implementation (see Section ??). The center of the whole map is the geographic
center of k∗ .
The objective of this approach is to reduce the time-consuming reloading of tiles during
a on-the-fly zoom-out procedure (featured in Solution (A)). Instead, k∗ is used as a
kind of base tile, with which the majority of the scale processes can be executed. This
way, it is no longer necessary to keep loading and scaling new tiles in order to »fill in«
the white area that would otherwise appear, especially since the high level of detail on
these tiles is not even required for ZoomOut scaling.
At a certain level of magnification, however, the extensive »pixelation« of k∗ will be
a disadvantage. Depending on the zoom level intervals this can lead to an inability to
identify map sections during high-scale processes.
4 Concept
58
4.3 Technical Framework Requirements
The OpenLayers demo controls.html 1 serves as the basis for the implemention of the animated zooming feature. Adaptations are possible. The following layers (along with their map
sources) are used:
• WMS-BaseLayer (default):
http://labs.metacarta.com/wms/vmap0
• WMS Untiled-BaseLayer:
http://labs.metacarta.com/wms/vmap0
• Image-BaseLayer:
• WMS-Overlay:
http://earthtrends.wri.org/images/maps/4_m_citylights_lg.gif
http://www2.dmsolutions.ca/cgi-bin/mswms_gmap
Expandability
The implementation takes into account a possible expandability of the application at a later
date. In particular, the should-have criteria outlined in Section ?? are to be integrated into
the conceptualized animated zooming feature with as little effort as possible. The animated
panning feature2 developed by OpenLayers (currently still in review stage) serves as a component for the implementation of the automatic zoom animation. The algorithm for the
time-dependent calculation of force movement curves (rapid start, damped finish) is to be
extended in such a way that it can used for the zoom animation process. A combination of
pan and zoom animation processes should also be possible.
Because of the different types of layers (see Section ??) supported by OpenLayers an individual treatment of each different scale action is required. Identical source code can be
stored in the base class Layer.js. Layer-specific zoom activity can be treated with individual
(overwritten) methods so that only the new layer class has to be adapted during the integration of new layer types. Changes in the key functions is not required, ensuring a fairly
easy expandability of the animated zooming feature.
1
2
http://www.openlayers.org/dev/examples/controls.html [Last Viewed: May 15, 2007]
http://trac.openlayers.org/ticket/110 [Last Viewed: May 15, 2007]
4 Concept
59
4.4 Development Guidelines in OpenLayers
The development guidelines of the OpenLayers project are clearly defined:
By following specific rules 3 anyone can use the Ticket System4 of OpenLayers to advise
of bugs or suggestions for new features. A finished patch file 5 correcting the bug or implementing the feature is attached to the generated ticket; the ticket status is set to review. A
summary of implemented changes should then be circulated through the developers’ mailing
list, where they can be discussed and if need be, further modified. If no modifications are
required, the patch is tested (and changed, if required) by one or more authorized project
committers and subsequently integrated into the most current SVN developer’s version, the
Trunk [?].
Registered developers can set up their own SVN sandbox for testing and demonstration
purposes. Each sandbox is independent of the Trunk. Within the confines of the sandbox
developers have unlimited room for action and are not required to follow any guidelines.
Presently, the Project Steering Committee (PSC) of OpenLayers consists of seven members6 .
They supervise the project process and implement decision making processes that reflect the
spirit of the community. Major decisions, such as substantial source code changes, changes to
backward compatibility, dates of new releases, or the clarification of procedural questions are
subject to a vote by the committee members. Each person in the OpenLayers community can
use the developer’s mailing list to submit or comment on proposals, however, only committee
members are allowed to vote. The voting process is subject to clearly defined rules, with the
possible voting values listed below [?]:
+1 Fully support for the proposal, willingness for active collaberation
+0 Support for the proposal, but no willingness for active collaberation
0 No opinion
-0 Mild disagreement of proposal, but will not block
-1 Veto; refusal of proposal
A proposal is accepted if the total sum of voting results totals is at least +2 and there are
no veto votes (ie.-1). When submitting a veto, the voter has to provide a clear reason for
the veto and, within two days, an alternative for the solution to the problem. In cases of
considerable debate, the decision rests with the committee chairman[?].
The implementation of the animated zooming features is carried out on the basis of the
above-mentioned developer’s guidelines. Regular communication on available interim versions through the developer’s mailing list is meant to ensure that the OpenLayers community is part of the development process. It also ensures that suggested changes or suggestions
3
http://trac.openlayers.org/wiki/FilingTickets [Last Viewed: May 15, 2007]
http://trac.openlayers.org/query [Last Viewed: May 15, 2007]
5
http://trac.openlayers.org/wiki/CreatingPatches [Last Viewed: May 15, 2007]
6
http://trac.openlayers.org/wiki/SteeringCommitteeMembers [Last Viewed: May 15, 2007]
4
4 Concept
60
made by developers can be taken into account as quickly as possible. Furthermore, the transparency of this process results in the best possible acceptance of the feature. At this stage
it is important to note that the animated zooming feature is merely intended to extend the
existing API, therefore fundamental changes in the key components of OpenLayers will not
be required. At the same time, the analysis of the source codes by other developers also
servers as a quality assurance system.
4.5 Test Methods
4.5.1 Component Tests
Component tests support the development process of the planned extension. For this purpose,
the Test.AnotherWay framework used by OpenLayers will be applied (see Section ??). The
purpose of the unit tests is to verify the soundness of all functions and classes, and to serve
as part of the quality assurance process. The intention is a test first development, with the
component tests created alongside the actual source text.
During the compilation of unit tests for the animated zooming feature the special nature
of the automatic zoom animation needs to be taken into account: in order to achieve automatic animation, a time-dependent component which directs this process is required in the
API source code. The JavaScript function window.setInterval ensures a constantly recurring
infinite cyclical execution of a particular function along with interconnected breaks. This
function can be interrupted with window.clearInterval. To test these asynchronous function
commands in the source code with component tests, Test.AnotherWay offers the method
delay_call which supports two arguments: the waiting period between function commands
in seconds, and the executable function. If a time is not indicated, a time delay of .2 seconds
applies. For a successful testing procedure, the sample test function of Listing ?? has to be
modified for the zoom animation as follows:
11
...
map . zoomTo ( 0 ) ;
t . delay_call (1 , function () {
t . eq ( map . getZoom ( ) , 5 , "map . zoom i s c o r r e c t a f t e r
});
12
13
14
15
16
c a l l i n g zoomTo" ) ;
...
Listing 4.1: Sample test taking into account asynchronous function commands
4 Concept
61
4.5.2 Integration Tests
After the component tests are complete, as a quality assurance measure integration tests are
used to check the interaction of numerous (tested) unit components. A test plan describes
the action of selected test cases, which are carried out after the implementation has been
completed. The plan is divided into different test suites to achieve a logical division of the
functions to be tested. Each test suite can be carried out separately. It is divided into different
working steps (test cases) and expected results, which are checked during the implementation
of the test cases. If a result deviates from an expected performance, the test suite will fail.
A test plan for the animated zooming extension is developed on the basis of the requirements
analysis (see Section ??). A complete listing of all possible scenarios which could apply for
the use of the feature would be too extensive for the purposes of this thesis. Accordingly,
the test plan focuses on the typical and extreme cases of zoom performance. Application
functionalities which are independent of the implemented feature are not considered in the
test plan. They are verified as part of the component tests and ideally should not be impaired
by the implementation. To ensure comparability of the tests, they are carried out with the
OpenLayers demo controls.html. For each test the tester documents the date, operating
system, browser, name of tester, test duration and applicable comments.
The complete test plan for the animated zooming and panning extensions can be found in
Appendix ?? (pg. ?? and following). The animated panning was included in the tesplan
because at the time of conceptualization and implementation the review process by the
OpenLayers developers had not yet been completed. For this reason, a separate quality
assurance process was carried out to verify the correctness of the extension.
Note: Once the implemention was complete, the plan was updated in view of actually implemented criteria, which led to an expanded version of the test plan. A more detailed
discussion of the implementation and the associated updates to the test plan follows in the
next chapter.
5 Realization
This chapter addresses the implementation of the concept described in the previous chapter.
The realization process is divided into preparation, implementation, testing, and problems.
5.1 Preparation
To start, a new OpenLayers user account and SVN sandbox are created1 .The sandbox is
freely accessible at http://svn.openlayers.org/sandbox/emanuel/. A current version of the trunk is
copied into the sandbox and serves as the basis for further development. The sandbox allows
for its own source code administration and executes an automatic checkout into the public directoryhttp://dev.openlayers.org/sandbox/emanuel/. This enables other developers to test the
source code directly in the webbrowser without having to first perform a svn checkout.
The actual implementation is carried out in a checked-out sandbox version on a Debian
GNU/Linux system. No installation is required; OpenLayers runs without a web server in any
local directory. An internet connection is required to work with the map layers described in
Section ??. Firefox web broser is used for testing during the development phase. In addition,
the Firefox plugin Firebug 2 is used to debug JavaScript code, visualize individual HTMLDiv elements, and to test the DOM tree. The OpenLayers sample demo is adapted to the
selected layers (see Section ??).
5.2 Implementation
The ensuing description is based on the utilization of a tiled WMS layer, and is divided
into implementation steps that build on each other. The steps will be described in separate
sections.
The developed animated zooming und panning extension was updated to the OpenLayers
Version 2.4 RC5 (as of May 25, 2007); it is available through:
1
2
http://trac.openlayers.org/wiki/FrequentlyAskedQuestions [Last Viewed: May 15, 2007]
http://www.getfirebug.com [Last Viewed: May 15, 2007]
62
5 Realization
63
• the above-mentioned SVN sandbox (Revision 3197 of May 28, 2007);
either by checkout: svn co -r3197 http://svn.openlayers.org/sandbox/emanuel/animatedZooming/
or online per TracBrowser: http://trac.openlayers.org/browser/sandbox/emanuel/animatedZooming,
and
•
the attached CD-ROM in Appendix ??, which is a copy of the sandbox revision 3197.
All subsequently indicated source code references refer to Revision No. 3197. The sample
demo demo.html contained in the root directly was updated according to Section ?? and
can be run directly off the CD or the current sandbox version (http://dev.openlayers.org/sandbox/
emanuel/animatedZooming/demo.html).
The classification diagram in Appendix ?? highlights in color all classes that have been
changed for the purposes of implementing the animated zooming and panning extensions.
In addition, all edited methods are listed. The diagram is also based on Version 2.4 RC5 of
OpenLayers (as of May 25, 2007).
5.2.1 Zoom Slider Events
The three event steps necessary for the use of the zoom slider in the PanZoomBar.js are as
follows: MouseDown – MouseMove – MouseUp.
In the MouseDown event the current zoom level (before zooming) is stored in the Map object
property zoomlevel_startScale . This value forms the basis calculation for the scaling process.
If the MouseMove event is activated through a movement of the slider, the following three
values are re-calculated with every change in movement:
1. Slider position:
The currently active mouse position forms a pixel value pair whose y-value indicates
the slider position. Values located outside of the zoom bar are intercepted (see zoomBarDrag(); PanZoomBar.js).
2. Zoom Level:
The difference between slider start position and current slider position divided by the
indicated slide raster gives the new zoom level deviation. Added to the starting value
of the zoom level this results in the new zoom level zoomlevel_scale (see calculateNewZoomlevel(); Map.js):
var deltaY_zoomlevel = this.zoomStart.y − sliderPosition.y;
this.zoomlevel_scale = this.zoomlevel_startScale + deltaY_zoomlevel/zoomStopHeight;
3. Tile Size:
During scaling the tile size is doubled (or halved) with every change in zoom level (see
Section ?? and calculateNewTileSize(); Map.js). For the zoom-in process the following
applies for the tile width:
5 Realization
64
this. tileSize_scale .w =
Math.pow(2, (this.zoomlevel_scale − this.zoomlevel_startScale)) ∗ this.tileSize_startScale.w;
Similarly, for the zoom-out process:
this. tileSize_scale .w =
1 / (Math.pow(2, (this.zoomlevel_startScale − this.zoomlevel_scale))) ∗ this.tileSize_startScale.w;
Once the three values have been calculated, each tile is scaled to the newly determined tile
size (a detailed description follows in the next section).
Once the mouse key has been released (MouseUp event) the slider stops on the next adjacent
zoom level value, and all visible tiles are redrawn.
5.2.2 Scaling
Scaling is used only for the active base layer; other active layers are hidden during the
scaling process (see prepareZoomAnimation(); Map.js). This measure became necessary when
a noticeable decrease in performance was observed with just two active layers. Detailed
measurements were not taken. As a result, the decision was made not to continue scaling
more layers in order to obtain a faster (and more user-friendly) zoom-scaling process.
At the beginning of the zooming process the tile containing the centre of the visible area
must be determined. If the center is located on the edge of several tiles, the first tile located
is defined as the centerTile (see getCenterTile();Grid.js).
By moving the zoom slider the values defined in Section ?? are initially used to scale and
position the center tile (see scaleTileTo(); Grid.js). The new tile size is used to set the
width and height style parameter of the HTML-imgDiv element of the tile. The positioning
algorithm is based on the theorem on intersecting lines. Through the elementary geometric
line relationship between the tile center and the corner points of the original and scaled tiles
the new top and left pixel positions of the tile graphic can be determined.
The remaining (visible) tiles are scaled and repositioned based on the scaled center tile.
During the scaling process the overview map is simultaneously updated (see updateOverview();
OverviewMap.js). The red border which highlights the selected area is increased/decreased
during the zoom process and always indicates the exact section of the main map. During
slider movement, the zoom level of the overview map adjusts to the current main map. New
tiles for the reference map are loaded. This does not impair the zooming process.
5 Realization
65
5.2.3 ZoomOut Tiles
During intitialization of the current base layer a basis tile (larger by a factor of x) is loaded to
prevent the formation of a white border around a shrinking map during the zoom-out process
(see Section ??). A tile whose borders contain the full dimension of the map (maxExtent) is
determined, ie. the map must be displayable on one single tile. Beginning with zoom level 0
the resolution is doubled (and the map shrunk accordingly) until the whole map fits on one
tile (see setZoomOutTile_share; Layer.js).
After several days of testing, an optimal tile size factor x of 4 emerged. The standard tile
size in OpenLayers is 256 pixels (px). This means that the zoom-out tile would be loaded
with 1024 px. Background: Generally, many WMS servers (including MapServer) pre-define
2048 px as the maximum map size which should not be exceeded. Larger tiles result in
better quality during scaling. However, taking into account load time it is better to choose
a smaller tile with a smaller factor x. With a standard tile size of 512 px, a factor of 4 is
still within the permitted size range (2048 px); at 1024 it also has a justifiable load time (in
normal conditions). At smaller zoom level changes the quality at 1024 px is also considered
acceptable. However, definite »pixelation« occurs during large zoom changes, which cannot
be completed avoided even with a higher factor.
To request the ZoomOut tile in the defined size from the WMS server, the getURL method
in WMS.js was expanded by one parameter tileSize.
5.2.4 Automatic Zoom Animation
All requirements described in Section ?? are taken into account and implemented accordingly
(with the exception of overlay scaling). The animated zooming feature in the zoom bar is
expanded with the mentioned should-have criteria (see Section ??).
After discussions with the PSC members of OpenLayers the animated panning patch which
is currently in Review stage is used as the basis for the time-dependent calculation of the
zoom animation steps. The easeInOutZoom method in Util.js is the result of the adaption
of the analogously compiled animated panning function (see listing ??). Thereby delta is the
difference between the zoom levels before and after animation, totalsteps is the pre-defined
number of animation steps, step is the current »step counter«, and power is the pre-defined
power factor for the acceleration curve override.
1
2
3
4
OpenLayers.Util.easeInOutZoom = function(delta, totalSteps, step, power) {
var stepVal = Math.pow(((1 / totalSteps) ∗ step), power) ∗ delta;
return stepVal;
};
Listing 5.1: Force Movement Curve Algorithm for Zoom Animations; Util.js
After extensive testing with different values for the above-mentioned variables totalsteps = 4
and power = 0.7 were considered ideal values for the zooming process. Particular attention was
paid to the speed of the animation, which should not exceed two seconds. For this reason a
5 Realization
66
smaller step quantity was selected. For the power factor a value that would quickly accelerate
the zoom movement in the beginning and gradually slow it down at the end was desired.
The delay between user action and the first visible zoom movement is thus very small.
The window.setInterval method described in Section ?? is used as a »metronome« for the
gradually proceeding animation; in the zoomSlide method it is retrieved from the Map.js.
Clicking on the zoom bar (buttons), double-clicking on the map, moving the mouse wheel,
pulling out the zoom box or pressing the +/– key starts the automatic zoom animation
using the zoomTo method. An optional function parameter can be used to deactivate the
animation and to perform a more jump-like zooming process.
Starting or repeating a new animation using the above-mentioned interactions is not possible
while zoom animation is in process. Turning the mouse wheel numerous time will still only
result in a one-level zoom change. An extension of this function is conceivable.
Zooming with double-click, mouse wheel and zoom box simultaneously adjusts the map to
the new center (also with animation). Combining animated zooming and panning means that
two window.setInterval methods are running independently of each other – one for zooming
and one for panning.
5.2.5 Tile Configuration with smooth tile update
In OpenLayers the old map is deleted (white background appears) and subsquently reassembled through a gradual reloading of tiles (default setting). This effect would greatly
impair the forecasted improvement in user orientation during animated zooming. For this
reason a solution whereby the scaled background layer stays visible until until the new tiles
(in the layer above it) are completely loaded into the visible area is implemented. In this
thesis, this effect is described as smooth tile update; in line with its definition it is also
considered as a characteristic of Smart Map Browsing.
The actual implementation (see cloneBaseLayerDiv_share(); Layer.js):
First, the active base layer along with all its tiles is cloned (baseLayerDivClone) and added to
the layer container. The z-index of baseLayerDivClone is decreased by one so that the layer lies
directly under the original layer. Subsequently the ZoomOut tile of the original layer must
be switched invisibly (hidden) so that it does not cover the underlying cloned layer during
the tile assembly.
A loadend event in the Layer.js results when all tiles of the original layer are loaded into
the visible area (see spiralTileLoad(); Grid.js). After the cloned layer is deleted, a new zoom
animation may be started (see setLoadendVisibility(); Layer.js).
5 Realization
67
5.2.6 Supported Layers
After implementation, the animated zooming feature supports the layers Image, WMS Untiled as well as all derived layer classes of Grid, namely (WMS, MapServer, KaMap, TMS and
WorldWind; compare also classification diagram in Appendix ??). On the other hand, TMS
and WorldWind do not offer ZoomOut tile support, this requires a layer-specific adjustment
of the getURL method (similar to WMS.js).
Applications currently unsuited for animated zooming include MapServer Untiled as well as
layers of third-party providers (Google, VirtualEarth, Yahoo and MultiMap). Canvas serves
only as an overlay and is therefore also not supported.
The possible expansion of new layer types described in Section ?? is provided for by the Layer
base class. As conceptualized, new layer types do not by default support zoom animation.
Through the implementation of layer-specific methods (getTileSize(), getCenterTile() and if
applicable, cloneBaseLayerDiv()), the default properties of Layer.js are overwritten.
5.2.7 Animated Panning
The animated panning feature is used for combined zoom/pan operations (see Section ??).
Other than correcting a rounding error in the getLonLatFromViewPortPx method (Layer.js)
and supplementing the unit tests, the existing animated panning was not altered.
Panning control using arrow keys was expanded based on the Smart Map Browsing characteristics (see Section ??; heading Zooming/Panning with Keyboard ). Accordingly, it is
possible to reposition the map by 75% of the current map width/height at any one time,
using the keys Home, End, Page ↑ or Page ↓.
5 Realization
68
5.2.8 Source Code Structure
As the central object in OpenLayers, the Map class assumes the zoom animation control. The animated zooming source code is essentially divided into the functions prepareZoomAnimation(), runZoomAnimation() and finishZoomAnimation().
All zoom changes are done with the zoomTo method, from where the three above-mentioned
animation functions are retrieved.
At the end of the implementation the complete written (respectively: modified) source code
was divided into logically grouped patches. Table ?? shows the eight generated patch files
with the corresponding number of total lines as well as the added and deleted source code
lines. Listing ?? illustrates the principle of added and deleted files using as an example an
excerpt of the patch file final_animatedZooming_PanZoomBar.patch. For space reasons the
associated unit test changes (Line 1 - 53) are not illustrated here.
Lines
Nr.
Patch File
1
2
3
4
5
6
final_animatedZooming_Core.patch
final_animatedZooming_LayerImage.patch
final_animatedZooming_LayerWMSUntiled.patch
final_animatedZooming_Mouse.patch
final_animatedZooming_OverviewMap.patch
final_animatedZooming_PanZoomBar.patch
7
8
animatedPanning#2.patch
keyboardDefaults.patch
Total
total
added
deleted
1883
154
339
325
329
140
1293
115
1293
220
136
77
105
4
105
34
54
8
384
183
207
139
45
10
3737
2480
269
Table 5.1: Generated Patch Files for animated zooming und panning
The eight patch files are found on the attached CD; they are also available online at OpenLayers under the following three tickets:
• »animated zooming« (Ticket 442)3
• »animated panning« (Ticket 110)4
• »new keys for better panning« (Ticket 580)5
3
http://trac.openlayers.org/ticket/442 [Last Viewed: May 15, 2007]
http://trac.openlayers.org/ticket/110 [Last Viewed: May 15, 2007]
5
http://trac.openlayers.org/ticket/580 [Last Viewed: May 15, 2007]
4
5 Realization
54
55
56
57
58
59
60
61
62
63
64
65
66
67
68
Index: lib /OpenLayers/Control/PanZoomBar.js
=================================================================
−−− lib/OpenLayers/Control/PanZoomBar.js (Revision 2907)
+++ lib/OpenLayers/Control/PanZoomBar.js (Arbeitskopie)
@@ −152,7 +152,10 @@
var y = evt.xy.y;
var top = OpenLayers.Util.pagePosition(evt.object)[1];
var levels = Math.floor((y − top)/this.zoomStopHeight);
−
this.map.zoomTo((this.map.getNumZoomLevels() −1) − levels);
+
+
if (! this.map.zoomanimationActive)
+
this.map.zoomTo((this.map.getNumZoomLevels() −1) − levels);
+
OpenLayers.Event.stop(evt);
},
69
70
71
72
73
74
75
76
77
78
79
80
81
82
@@ −165,8 +168,12 @@
this.map.events.register ("mousemove", this, this.passEventToSlider);
this.map.events.register ("mouseup", this, this.passEventToSlider);
this.mouseDragStart = evt.xy.clone();
−
this.zoomStart = evt.xy.clone();
+
this.map.zoomStart = evt.xy.clone();
this.div. style .cursor = "move";
+
+
// get and set some settings for zoom animation
+
this.map.prepareZoomAnimation();
+
OpenLayers.Event.stop(evt);
},
83
84
85
86
87
88
89
90
91
92
93
94
95
96
97
98
99
100
101
102
103
104
105
106
107
108
109
110
111
112
69
@@ −186,6 +193,13 @@
this. slider . style .top = newTop+"px";
}
this.mouseDragStart = evt.xy.clone();
+
+
// set current slider position
+
var sliderPosition = new OpenLayers.Pixel(evt.xy.x, evt.xy.y);
+
+
// run zoom animation −> scale tile(s)
+
this.map.runZoomAnimation(this.zoomStopHeight, sliderPosition);
+
OpenLayers.Event.stop(evt);
}
},
@@ −197,12 +211,18 @@
∗/
zoomBarUp:function(evt) {
if (! OpenLayers.Event.isLeftClick(evt)) return;
−
if (this.zoomStart) {
+
if (this.map.zoomStart) {
this.div. style .cursor="default";
this.map.events.unregister("mouseup", this, this.passEventToSlider);
this.map.events.unregister("mousemove", this, this.passEventToSlider);
−
var deltaY = this.zoomStart.y − evt.xy.y
−
this.map.zoomTo(this.map.zoom + Math.round(deltaY/this.zoomStopHeight));
+
var deltaY = this.map.zoomStart.y − evt.xy.y;
+
+
// zoom map to new zoomlevel
+
var finalZoomlevel = this.map.zoom + Math.round(deltaY/this.zoomStopHeight);
5 Realization
113
114
115
116
117
118
119
120
+
+
+
+
70
// finish zoom animation
this.map.finishZoomAnimation(finalZoomlevel);
this.moveZoomBar();
this.mouseDragStart = null;
OpenLayers.Event.stop(evt);
@@ −211,10 +231,17 @@
121
122
123
124
125
+
+
126
127
128
129
130
131
132
133
134
135
136
137
−
−
−
+
+
+
+
+
+
+
+
/∗
∗ Change the location of the slider to match the current zoom level.
∗
∗ @param {float} zoomlevel
∗/
moveZoomBar:function() {
var newTop =
((this.map.getNumZoomLevels()−1) − this.map.getZoom()) ∗
moveZoomBar:function(zoomlevel) {
// check if zoomlevel is not a number
if (isNaN(zoomlevel)) {
zoomlevel = this.map.getZoom();
}
// set new top position
var newTop = ((this.map.getNumZoomLevels()−1) − zoomlevel) ∗
this.zoomStopHeight + this.startTop + 1;
this. slider . style .top = newTop + "px";
138
139
140
},
Listing 5.2: Patch File final_animatedZooming_PanZoomBar.patch (excerpt)
5.3 Tests
5.3.1 Component Tests
Component tests were set up at the beginning of the implementation, taking into account
the distinctiveness of asynchronous function commands in automatic zoom animations (see
Section ??). The following two notable characteristics were observed during the use of the
delay_call method:
1. According to the delay_call method, no additional test assertion which builds upon
assertions and instructions of the delay_call method can follow within a test function.
Otherwise the test function will fail.
Background: Because of the determined delay time, instructions that follow the delay_call method are preferred and therefore processed before delay_call() is carried
out. As a result, the generated component tests always set delay_call() as the last
instruction in test functions (see Listing ??; line 33/34).
2. Test functions involving several automatic zoom animations require a corresponding
number of delay_call commands. According to (1) these cannot be listed in consecutive
5 Realization
71
order. One solution would be to interleave them; ie. to executive a command within an
existing command. However, a more elegant solution is to list the individual functions
and their delay times in the parameter list of one delay_call method (see Listing ??).
Appropriate component tests were developed for almost all newly implemented (modified) functions of OpenLayers (see Classification Diagram in Appendix ??). In doing so,
three new test pages were created: test_WMS_Untiled.html, test_MouseDefaults.html and
test_KeyboardDefaults.html. The remaining test files were expanded with new methods. The
implementation of animated zooming resulted in a further required adjustment and expansion (with delay_call methods) of test functions which test zoom performance.
Towards the end of the implementation all tests were carried out successfully. The component tests provided a quality assurance aspect and thus ensured the correctness of the
animated zooming und panning features for future extensions.
1
2
3
4
5
6
7
8
9
10
11
12
13
14
15
16
17
18
19
20
21
22
23
24
25
26
27
28
29
30
31
32
33
34
function test_05_Map_center(t) {
t .plan(6);
map = new OpenLayers.Map(’map’);
var baseLayer = new OpenLayers.Layer.WMS("Test Layer", "http://octo.metacarta.com/cgi−bin/mapserv?",
{map: "/mapdata/vmap_wms.map", layers: "basic"} );
map.addLayer(baseLayer);
var ll = new OpenLayers.LonLat(2,1);
map.setCenter(ll, 0);
map.zoomIn();
t .delay_call(
1, function() {
t .eq( map.getZoom(), 1, "map.zoom is correct after calling setCenter,zoom in");
t .ok( map.getCenter().equals(ll ), "map center is correct after calling setCenter, zoom in");
// set zoomanimation flag manually,
// reason: loadend event in layers . js will not achieved in unittests
map.zoomanimationActive = false;
map.zoomOut();
},
1, function() {
t .eq( map.getZoom(), 0, "map.zoom is correct after calling setCenter,zoom in, zoom out");
map.zoomTo(5);
},
1, function() {
t .eq( map.getZoom(), 5, "map.zoom is correct after calling zoomTo" );
map.zoomToMaxExtent();
},
1, function() {
t .eq( map.getZoom(), 2, "map.zoom is correct after calling zoomToMaxExtent" );
var lonlat = map.getCenter();
var zero = new OpenLayers.LonLat(0, 0);
t .ok( lonlat .equals(zero ), "map center is correct after calling zoomToFullExtent" );
}
);
}
Listing 5.3: Multiple delay_call commands in a test function; test_Map.html
5 Realization
72
5.3.2 Integration Tests
After completion of the implementation the initial test plan was adapted to the actually
implemented functions. The final test plan is divided into seven test suites (see Appendix ??,
pg. ?? and following).
The complete test was carried out in seven different browsers, and a test log for each was
compiled. Table ?? illustrates the tested browser version, divided by operating systems
used.
Debian GNU/Linux 3.1
Mac OS 10.4
Windows XP
Firefox 1.5.0.7
Bon Echo 2.0.0.11
Safari 2.0.4
Firefox 2.0.0.2
Opera 9.10
Internet Explorer 7.0
Firefox 2.0.0.3
1
self-compiled version of Firefox 2.0.0.1
Table 5.2: Tested Browser Versions
KDE Konqueror 6 (Version 3.5.5 and 3.3.2) is not supposed to be supported by OpenLayers
- this was also checked as part of the testing process (see also pg. ??). During an attempt
to run the demo the map was not loaded (ie. the map window remained empty). Even after
posting a question on the OpenLayers developer’s mailing list the reason for this could not
be found.
The test run using Internet Explorer (IE) 7 uncovered three problem areas:
1. The following test plan question was always checked with a No:
»Does the status bar of the browser show the completion of the map loading process
(e.g. confirm that it is done)?«
2. Zooming using the keyboard did not work in IE.
3. PNG tile graphics became invisible once they exceeded 32768 pixels during the scaling
process. CPU load also jumped considerably. Sometimes IE did not respond temporarily or it crashed completely.
Item (1) can be neglected, as it does not impair the functional performance of the application.
A search for a solution to this browser-specific problem was not carried out.
Problem (2) also only occured in IE. With the addition of two IE-specific keycodes for the
+ and – key the problem was solved (see KeyboardDefaults.js).
The basic problem of item (3), that tile graphics above 32768 pixels are no longer shown,
was also observed in the three browsers tested in Mac OS X and Firefox in Windows. It
stands to reason that graphics in these browsers are only displayed at maximum 16 bits,
6
http://www.konqueror.org [Last Viewed: May 15, 2007]
5 Realization
73
ie. 1 bit for pre-drawing and 15 for the size number, hence 215 = 32768 px. The abovementioned performance problems observed in IE are serious enough that they warrant an
urgent solution to ensure the reliability of the application.
Since IE does not seem to capture pixels exceeding 215 , the application needs to compensate for this problem. Prior to scaling a tile, OpenLayers now checks in the methods
scaleTileTo(), scaleTilesOfGrid() and scaleZoomOutTile_share() (in Layer.js) whether the
above-mentioned value has been exceeded. If that is the case, no further scaling takes place
and the tiles stay at their most recent tile size. This has no real significance for the user,
since at 32768 pixels the map is already highly pixelated. However, the fact that after a
certain zoom level the map does not continue to adjust in line with the movement on the
zoom slider can be somewhat irritating for the user, with a corresponding negative effect on
Smart Map Browsing.
The implemented integration tests form the concluding part of the implementation and test
phase. They also highlight the importance of test logs for quality assurance purposes, as
shown by the discovery of new problem areas.
5.4 Problems
5.4.1 Performance
The biggest problem with the implementation of the animated zooming feature was and is
the issue of performance, because as more tiles are scaled, the scaling process slows down
accordingly. Because of this issue, the simultaneous scaling of all active overlays was not
considered in the early development stages (see Section ??). Even with a base layer the
zoom process can be noticeably slower when the view area is large as opposed to a smaller
map view of, say, 512 x 512 pixels.
In the search for a solution the following approach for performance optimization was developed: during scaling a change in the position and size of tiles is carried out on the basis of
central CSS classes which are assigned to the tiles line-by-line (column-by-column), rather
than using a CSS-style parameter for each graphic. Accordingly, one CSS class per tile column or line would determine the left or top position of the tile. The tile width and height
would be the same for all classes. For scaling a tile grid of 4 x 4, a modification to 8 CSS
classes would be required, as compared to 16 CSS style characteristics in each tile.
This concept had been implemented on a test basis, but was later abandoned when the
hoped-for improvement in speed did not occur. Detailed measurements were not carried
out.
A second optimization solution was more successful and became a part of the developed
extension: only the tiles that are completely or partially located in the visible area are
5 Realization
74
scaled. All other tiles (ie. outside the visible area) are not included in the scale process (see
setTilesOutsideInvisible; Grid.js). For example: Given a map window of 512 x 512 px and a
tile size of 256 px, Grid.js by default creates a 7 x 6 tile grid. Accordingly, a maximum of
nine tiles can be found in the visible area at the same time. The number of tiles which have
to be scaled can therefore be reduced from 42 to a maximum of nine.
An additional performance problem was discovered during the implementation of the test
plan. Internet Explorer slows down noticeably with tiles of over 32768 pixels, which in some
cases resulted in a crash of the browser. A solution to this problem is described in Section
??.
5.4.2 Layer Types
The desired implementation of the animated zooming features for all layers supported by
OpenLayers (as outlined in the should-have list) could not be fully realized (see Section ??).
The difficulty (and associated effort) with implementing the layer-specific special characteristics were underestimated during the conceptualization phase. As a result, the effort was
limited to the layer types Image, WMS Untiled and Grid (inc. sub layers).
5.4.3 Component Tests
Difficulties were encountered during the creation of the unit test components in which asynchronous code was supposed to be tested. The two characteristic of delay_call() as described
in Section ?? are not documented in [?]. Extensive research and an inquiry over the OpenLayers developer’s mailing list did not yield an answer. The solution was discovered only
towards the end of the implemention. Therefore the component tests were not developed in
immediately parallel with the implemention, as was planned.
6 Conclusion
6.1 Summary of Results
The central focus of this thesis is represented by the following three steps: a current state
analysis of Free web mapping applications, which leads to the definition of the term Smart
Map Browsing, as well as the implementation of a selected Smart Map Browsing feature.
The current state analysis investigated the usability of twelve selected web mapping applications. As expected, Google Maps (the lone proprietary representative) proved to be a
cutting-edge application. The analysis also revealed an impressive performance by OpenLayers
As a general summary it can be said that in terms of usability, the tile-based applications
convince with their no-delay map panning and dynamic tile assembly. Combined with a
zoom bar these applications have an already large lead in terms of usability compared to
conventional web mapping applications.
An innovative and so far novel interactive extension was provided by p.mapper ’s continuous
zooming feature, which shows great potential for the further development of web mapping
applications.
The majority of analyzed applications showed definite weaknesses because of missing zoom
options with mouse wheel, double-click or keyboard commands. In addition, the static zoom
performance seen in many overview maps left a decidedly negative impression with regards
to usability.
Before submission, all analysis results of this thesis were re-checked and updated if required.
This thesis also developed and defined the term Smart Map Browsing. A definition was
developed on the basis of the ISO usability standards. The characteristics of Smart Map
Browsing were derived from the results of the current state analysis; they outline the current state of the technology of Smart Map Browsing. The characteristics serve as guidelines
on how web mapping applications could be conceptualized and developed for a high level
of usability. This includes intuitive, self-explanatory GUI components as well as pan/zoom
that performs to expectations after interacting with these elements. Smart Map Browsing
intensity describes the degree of usability. When a web mapping application displays all of
the listed properties, it is considered a high-grade Smart Map Browsing application. On the
other hand, if the application features fewer of these properties, it has a lower Smart Map
75
6 Conclusion
76
Browsing quality.
The thesis highlighted the most significant features of Smart Map Browsing as well as their
future potential. The result: the performance of (client-side) tiling can be significantly improved by (server-side) tile caching, as shown by the implementation of TileCache. An important factor for zoom depth orientation is the zoom bar. The use of animated zooming
und panning shows great potential, as it creates an entirely new »navigation experience«
for the user. These characteristics along with their potentials are continuously updated and
developed through new technology, and they will further shape the development of Smart
Map Browsing.
The third phase of this thesis consisted of the implementation of the Smart Map Browsing
feature animated zooming into OpenLayers. Summarizing, almost all stated Must-Have
and Should-Have requirements were implemented, with the exception of active overlay scaling
and achieving full support for all layer types. Performance issues were the main problem
encountered during implementation - the next section discusses the resulting open issues.
The developed feature expands the current OpenLayers-API. Through the Build Profile of
OpenLayers it is possible to combine selected API classes into a single JavaScript file. This
file can then be integrated into any web mapping application. As a result, this thesis was
successful in achieving its original objective of finding a universally valid solution.
The implementation results are summarized in eight patches and are currently undergoing
the review process by OpenLayers developers. The patch for the improvement of the panning
keyboard control has already been accepted without modifications and has been released as
part of OpenLayers Version 2.4 RC2 in April 2007. The integration of animated zooming and
panning is planned for Version 2.5 which is scheduled to be released in the fall of 2007.
6.2 Open Issues
A basic problem in the use of tiling in web mapping applications is the WMS server’s ability
to automatically place a scale bar, pre-defined logo, watermark or signature on every requested map. Figure ?? illustrates the potentially unaesthetic tile effects in OpenLayers using
the examples of two WMS services. Maps that are supplemented with externally-generated
and repetitive details divert the user’s attention from the map content and therefore have a
negative effect on Smart Map Browsing.
TileCache offers a technical approach to dealing with display issues such as these: with the
Metatile option the WMS server loads a large tile, which is subsequently provided to the web
mapping application in the form of numerous smaller, subdivided tiles. By default a Metatile
is divided into 5x5 tiles. Taking into account the recommended maximum tile size of 2048px
by WMS servers, the complete display of large maps with only one meta tile would generally
not be possible. Therefore this solution could still result in a recurrence of this undesired
element.
6 Conclusion
77
A second tiling problem is the positioning of labels which extend beyond tile borders. In
Figure ?? (left picture) these labels are simply cut off, which clearly impairs the readability
of the map. A discussion of potential problem solving approaches would go beyond the
confines of this thesis, therefore this issue is merely pointed out.
Figure 6.1: Tiling Problems with Scale Bar, Logos and Labels in WMS services [?] and [?]
Furthermore two open issues are observed in the developed OpenLayers extension animated
zooming:
1. Map scaling can at times result in a significant loss of quality. As the zoom level
increases the tiles display an increasing coarsening of the pixel structure, which can
result in a near illegibility of the map content. This is particularly evident during
zoom-out from a high zoom level, where the ZoomOut tile intially provides barely
usable information. The only zoom-interaction confirmation the user receives is the
pixel movement itself.
A possible solution would be to use several ZoomOut tiles (based on different zoom
levels). As soon as the map exceeds a certain zoom level, an additional ZoomOut tile
could be loaded. However, this alternative requires additional load and processing time
which could negatively impact performance.
6 Conclusion
78
2. Because of the performance problems touched upon earlier, overlay scaling was abandoned - an aspect that has negative effects on Smart Map Browsing. Moreover, compared to animated panning the automatic zoom animation process is still very sluggish.
For purposes of usability, a seamless and quick zoom animation is highly desirable. The
mentioned performance problems show clearly that because of the large processing requirements, scaling processes in browsers are still very limited by current technology.
Ideal animated zooming without noticable delays does not seem to be feasible with current client-hardware. However, given future technological developments this problem
is likely to be solved in the next few years.
6.3 Outlook
This thesis proposes that Smart Map Browsing leads to improved user acceptance. Approaches of the heuristic evalution method were used to prove this thesis by way of a usability analysis. Empirical confirmation was not carried out, as this would have been beyond
the scope of this thesis.
As a result, extensive usability tests using scientific methods are recommended for further
research work, as they serve to substantiate usability improvements in web mapping applications through the hereby defined characteristics of Smart Map Browsing.
There is a need for further research in the implementation of Smart Map Browsing characteristics. Given the current state of technology, the defined characteristics have only limited
value. As the technology develops, additional analysis and definitions will be required.
For the animated zooming feature in OpenLayers the following extensions are conceivable
for the future:
• All layer types are fully animated zooming compatible.
• An »add-up« of several zoom interactions during an automatic zoom animation results
in a recalculation of the maximum zoom level. Using the example of mouse wheel
movement this means that the number of wheel turns would be taken into account.
• To optimize the tile load time, background loading of the tiles for the maximum zoom
level is carried while the automatic zoom animation is still in process. If the maximum
zoom level is changed, the loaded tiles are discarded.
• The ZoomReset globe from the simplified zoom bar is integrated into the center of the
pan navigation panel, enabling ZoomReset in combination with the expanded zoom
bar of the PanZoom bar. Note: The zoom bar is considered fundamental for manual animated zooming and it, rather than the mini zoom bar, should be included in standard
versions of OpenLayers.
6 Conclusion
79
Looking at the discussions on the future of Free web mapping applications, it seems likely
that OpenLayers will one day form the functional core for some map applications – current
discussions revolve around ka-map, Mapbuilder and Mapbender. OpenLayers already offers
an adaptable lite version, which swaps out selected OpenLayers classes into one JavaScript
file (see Section ?? and ??). This would provide for a trouble-free integration into other
applications.
The lite version is a first step towards linking the multitude of Free web mapping projects
and effectively utilizing their specific potentials. The Smart Map Browsing properties of
OpenLayers which were investigated in this thesis could also be used to develop lasting and
effective usability improvements for other web mapping applications.
Bibliography
[Asche u. Herrmann 2003] Asche, Hartmut ; Herrmann, Christian: Web.Mapping 2.
Telekartographie, Geovisualisierung und mobile Geodienste. Heidelberg : Herbert Wichmann Verlag, 2003
[Bernhard u. a. 2005] Bernhard, Lars ; Fitzke, Jens ; Wagner, Roland M.: Geodateninfrastruktur. Grundlagen und Anwendungen. Heidelberg : Herbert Wichmann Verlag,
2005
[Bill u. a. 2002] Bill, Ralf ; Seuß, Robert ; Schilcher, Mattäus: Kommunale GeoInformationssysteme. Basiswissen, Praxisberichte und Trends. Heidelberg : Herbert Wichmann Verlag, 2002
[Dickmann 2001] Dickmann, Frank: Web-Mapping und Web-GIS. Braunschweig : Westermann Schulbuchverlag GmbH, 2001
[Dickmann 2004] Dickmann, Frank: Einsatzmöglichkeiten neuer Informationstechnologien für die Aufbereitung und Vermittlung geographischer Informationen – das Beispiel
kartengestützter Online-Systeme. Göttingen : Verlag Erich Goltze GmbH & Co. KG, 2004
http://webdoc.sub.gwdg.de/diss/habil/2004/dickmann/dickmann.pdf
[Ebinger u. Skupin 2007] Ebinger, Samara ; Skupin, Andre: Comparing Different Forms
of Interactivity in the Visualization of Spatio-Temporal Data. In: Kartographische
Nachrichten (2007), Nr. 2, S. 63–70
[Erstling u. Simonis 2005] Erstling, Reinhard ; Simonis, Ingo: Web Map Service. In:
Geodateninfrastruktur. Grundlagen und Anwendungen [?], S. 108–125
[FIT 2005] FIT, Fraunhofer-Institut für Angewandte Informationstechnik: Willkommen im
Usability Begriffszoo. (2005). http://www.fit-fuer-usability.de/1x1/basics/begriffszoo.html,
Abruf: 15.05.2007
[Fitzke 1999] Fitzke, Jens: GIS im Internet – aus »Das GIS Tutorial«. (1999). http://www.
giub.uni-bonn.de/gistutor/internet/inetgis/welcome.htm
[FSF Europe ] FSF Europe: Was ist Freie Software? http://www.fsfeurope.org/documents/
freesoftware.de.html, Abruf: 15.05.2007
[GDI Bayern ] GDI Bayern: WMS GetCapabilities; Layer: DOP. http://deutschlandviewer.
bayern.de/ogc/getogc.cgi?REQUEST=GetCapabilities, Abruf: 15.05.2007
[GNU-Projekt a] GNU-Projekt: Warum »Freie Software« besser ist als »Open Source«.
http://www.gnu.org/philosophy/free-software-for-freedom.de.html, Abruf: 15.05.2007
80
Bibliography
81
[GNU-Projekt b] GNU-Projekt: Was ist das Copyleft?
copyleft.de.html, Abruf: 15.05.2007
http://www.gnu.org/copyleft/
[GRASS user-map ] GRASS user-map:
WMS GetCapabilities.
http://mapserver.
gdf-hannover.de/cgi-bin/grassuserwms?REQUEST=GetCapabilities, Abruf: 15.05.2007
[Grassmuck 2004] Grassmuck, Volker: Freie Software – Zwischen Privat- und Gemeineigentum. 2., korrigierte Auflage. Bonn : Bundeszentrale für politische Bildung, 2004
[heise open ] heise open: EU-Studie: Open Source ist gut für die Wirtschaft. http://www.
heise.de/open/artikel/83795, Abruf: 15.05.2007
[Joos 2003] Joos, Gerhard: Das Web-Mapping-Testbed des Open-GIS-Konsortiums. In:
W eb.Mapping 2. Telekartographie, Geovisualisierung und mobile Geodienste [?], S. 181–
189
[Klauer 2002] Klauer, R. H.: Potenziale und Techniken eines kommunalen Interneteinsatzes. In: K ommunale Geo-Informationssysteme. Basiswissen, Praxisberichte und Trends
[?], S. 296–297
[Kunze 2006] Kunze, Ralf: SVGWeather – Entwicklung einer SVG Web Mapping Applikation zur Visualisierung von vierdimensionalen Daten am Beispiel von Wettervorhersagedaten. (2006). http://elib.ub.uni-osnabrueck.de/publications/diss/E-Diss603_thesis.pdf ,
Abruf: 15.05.2007
[Langfeld 2006] Langfeld, Dorothee: Entwicklung einer SVG Web Mapping Applikation
zur Visualisierung von Geoinformationen. (2006). http://www.inf.uos.de/prakt/pers/dipl/
dlangfel.pdf , Abruf: 15.05.2007
[MetaCarta ] MetaCarta: TileCache. http://www.tilecache.org, Abruf: 15.05.2007
[Mitchell 2005] Mitchell, Tyler: Web Mapping Illustrated. Sebastopol (USA) : O’Reilly
Media, 2005
[Nielsen 2000] Nielsen, Jakob: Designing Web Usability: The Practice of Simplicity. Indianapolis, USA : New Riders Publishing, 2000
[OGC ] OGC: About OGC. http://www.opengeospatial.org/ogc, Abruf: 15.05.2007
[OGC 2002] OGC: Web Map Service Implementation Specification. (2002). http://portal.
opengeospatial.org/files/?artifact_id=1081&version=1&format=pdf , Abruf: 15.05.2007
[OpenLayers a] OpenLayers: Build Profiles. http://trac.openlayers.org/wiki/Profiles, Abruf:
15.05.2007
[OpenLayers b] OpenLayers: Custom Query – Ticket-System. http://trac.openlayers.org/
query?order=priority, Abruf: 15.05.2007
[OpenLayers c] OpenLayers: How to Contribute to OpenLayers? http://trac.openlayers.org/
wiki/HowToContribute, Abruf: 15.05.2007
[OpenLayers d] OpenLayers:
OSGeo Project Incubation Questionnaire.
http://trac.
openlayers.org/wiki/IncubationQuestionnaire, Abruf: 15.05.2007
[OpenLayers e] OpenLayers: Project Steering Committee. http://trac.openlayers.org/wiki/
SteeringCommittee, Abruf: 15.05.2007
Bibliography
[OpenLayers f] OpenLayers:
BusinessCase, Abruf: 15.05.2007
82
Why OpenLayers?
[OpenLayers g] OpenLayers:
Writing Unit Tests.
WritingUnitTests, Abruf: 15.05.2007
http://trac.openlayers.org/wiki/
http://trac.openlayers.org/wiki/
[OSGeo 2006a] OSGeo: FOSS4G 2006 Webmap BOF. (2006). http://wiki.osgeo.org/index.
php/FOSS4G_2006_Webmap_BOF, Abruf: 15.05.2007
[OSGeo 2006b] OSGeo: OpenLayers/ka-Map Merging BOF Results. (2006). http://lists.
osgeo.org/pipermail/webmap-discuss/2006-September/000118.html, Abruf: 15.05.2007
[Peterson 2003] Peterson, Michael P.: Webmapping at the start of the new Millennium
– state of the art. In: W eb.Mapping 2. Telekartographie, Geovisualisierung und mobile
Geodienste [?], S. 3–17
[Pichler u. Klopfer 2005] Pichler, Günther ; Klopfer, Martin: Spezifikation und Standardisierung – OGC, OGC Europe und ISO. In: Geodateninfrastruktur. Grundlagen und
Anwendungen [?], S. 9–17
[Plümer u. Asche 2004] Plümer, Lutz ; Asche, Hartmut: Geoinformation – Neue Medien
für eine neue Disziplin. Heidelberg : Herbert Wichmann Verlag, 2004
[Rampl ] Rampl, Hansjörg: Begriffsdefinition Usability. http://www.handbuch-usability.de/
begriffsdefinition.html, Abruf: 15.05.2007
[Ramsey 2006] Ramsey, Paul: Mashing up the Enterprise. In: Geospatial Solutions (2006).
http://www.refractions.net/white_papers/mashups, Abruf: 15.05.2007
[Reiter 2004] Reiter, Bernhard: Wandel der IT: Mehr als 20 Jahre Freie Software. In: HMD
– Praxis der Wirtschaftsinformatik (2004), 83–91. http://www.intevation.de/~bernhard/
publications/200408-hmd/200408-wandel_der_it_20j_fs.html, Abruf: 15.05.2007
[Räber u. Jenny 2003] Räber, Stefan ; Jenny, Bernhard: Karten im Netz – ein Plädoyer
für mediengerechte Kartengrafik. In: W eb.Mapping 2. Telekartographie, Geovisualisierung
und mobile Geodienste [?], S. 57–76
[Römeling 2003] Römeling, Nils: Usability im www. Redesign eines Webauftritts mit
Hilfe von Usability Testing. Kapitel 1: Usability & Design. (2003). http://www.
usability-diplomarbeit.de/usability/diplomarbeit/kapitel-usability/, Abruf: 15.05.2007
[Simonis u. Merten 2004] Simonis, Ingo ; Merten, Stephan: Die Geodateninfrastruktur
des Webportals »geoinformation.net«. In: Geoinformation – Neue Medien für eine neue
Disziplin [?], S. 79–88
[Test.AnotherWay ] Test.AnotherWay:
Dokumentation.
TestAnotherWay/doc/doc.html, Abruf: 15.05.2007
http://straytree.com/
[van der Vlugt u. Stanley 2005] Vlugt, Maurits van d. ; Stanley, Ian: Trends in Web
Mapping: It’s all about usability. (2005). http://www.directionsmag.com/article.php?article_
id=1988, Abruf: 15.05.2007
List of Abbreviations
AJAX . . . . . . . . . . .
API . . . . . . . . . . . . .
BSD . . . . . . . . . . . .
CSS . . . . . . . . . . . . .
CVS . . . . . . . . . . . .
DOM . . . . . . . . . . .
FS . . . . . . . . . . . . . .
FSF . . . . . . . . . . . . .
GIF . . . . . . . . . . . . .
GIS . . . . . . . . . . . . .
GPL . . . . . . . . . . . .
HTML . . . . . . . . . .
JPG . . . . . . . . . . . .
LGPL . . . . . . . . . . .
ML . . . . . . . . . . . . .
OGC . . . . . . . . . . . .
OSGeo . . . . . . . . . .
PNG . . . . . . . . . . . .
PSC . . . . . . . . . . . .
SVG . . . . . . . . . . . .
SVN . . . . . . . . . . . .
TMS . . . . . . . . . . . .
WebGIS . . . . . . . . .
WFS . . . . . . . . . . . .
WMS . . . . . . . . . . .
WMS-C . . . . . . . . .
Asynchronous JavaScript and XML
Application Programming Interface
Berkeley Software Distribution
Cascading Style Sheets
Concurrent Versions System
Document Object Model
Free Software
Free Software Foundation
Graphics Interchange Format
Geographic InformationSystem
GNU General Public License
HyperText Markup Language
Joint Photographic Experts Group
GNU Lesser General Public License
Mailinglist
Open Geospatial Consortium
Open Source Geospatial Foundation
Portable Network Graphics
Project Steering Comittee
Scalable Vector Graphics
Subversion
Tile Map Service
Web-based Geographic InformationSystem
Web Feature Service
Web Map Service
Web Map Service-Cached
83
List of Figures
84
List of Tables
85
List of Source Codes
86
Appendices
87
List of Appendices
88
A Current State Analysis
A.1 Free & client-side
Free Web Mapping Applications with 100% JavaScript
89
A Current State Analysis
90
A.1.1 OpenLayers
As of: May 15, 2007
1. General
Name
URL
Home
Documentation
Download
Live Demo
Current version
Last update
License
Developed by
Short Description
OpenLayers
http://www.openlayers.org
http://trac.openlayers.org/wiki/Documentation
http://www.openlayers.org/download
http://openlayers.org/gallery and http://www.openlayers.org/dev/
examples
2.3 (stable)
February 21, 2007
BSD
MetaCarta, USA
OpenLayers is a Free (pure) JavaScript API used to integrate dynamic
maps into any website.
2. System
Architecture
Programming language
Prerequisites
Supported browser
Where applicable, integration with
other software
client-side
JavaScript
Mozilla 1.8; Firefox 1.0+; IE 6.0+; Safari 2.0+; Opera 9.0+; Netscape
X.X
uses prototype and components of Rico
3. Community
Revision Administration
Mailing Lists (URL)
Developer ML
Mails per month1
Total number of active developers2
User ML
Mails per month1
Total number of active users2
Commercial support
SVN (svn checkout http://svn.openlayers.org/trunk/openlayers/)
http://openlayers.org/mailman/listinfo
85
72
197
150
MetaCarta, USA
4. Documentation
For installation/development/operation (suggestions, tutorials, URL)
no installation necessary (API); API reference; Quick Tutorial (good
basic info, http://www.openlayers.org/QuickTutorial)
5. Usability
All analysis is based on demo http:// www.openlayers.org/ dev/ examples/ controls.html
Usability – General Impression
basically conforming to expectations; intuitive; plain GUI & clear; minimizable layer overview and overview map result in a very tidy user
interface; remarkably quick reloading of tiles – easy navigation
Continued on next page
1
2
Average monthly mail volume in investigated time period October 2006 - March 2007 (6 months)
Total number of active developers/users in investigated time period October 2006 - March 2007 (6 months))
A Current State Analysis
Main map
Overview map
Layer overview
Legend
Scale bar
Toolbar
Zoom bar
Pan navigation panel
General zooming
91
all elements/tools are placed on map
can be minimized; dynamic zoom level; section can be moved with
Drag&Drop or mouse click; missing centering of section after panning!;
does not adjust to the style of the main map (displays only base layer)
minimizeable layer display; divided into base layers and overlays;
can be de/activated with radio buttons and check boxes
simple scale indication possible (not included in demo)
not a conventional toolbar; very minimialistic; zoomBox and pan buttons
only; missing zoomOut button irritating at first; active tool not discernible
right away (bad color contrast); tool bar not really necessary
halbtransparent in der Karte integriert
above zoom bar
Zooming/panning with keyboard
switch between pan and zoom mode not necessary; max/min zoom level
only discernible on zoom bar; missing in demo: reset map to default zoom
value (in other examples through ’Worldmap’ in a smaller zoom bar)
yes
yes
yes (also by holding down Shift-key; colorful underlay of pulled-out area)
unhindered smooth panning with Drag&Drop; background reloading results in map movement without any (!) time delay
yes
Tiling
yes
Zooming with double-click
Zooming with mouse wheel
Zooming with zoom box
General panning
6. Other Features
All analysis is based on demo http:// www.openlayers.org/ dev/ examples/ controls.html
Analysis function
Search function
Help function
Print function
-
7. Notes
◦ object-oriented JavaScript library (API)
◦ very easy integration into own website
◦ lite version (bundles selected classes into a js file, therefore integration
with other web mapping applications is possible)
◦ TileCache significantly advanced by OL
◦ Integration of special layers is possible (GoogleMaps, ka-map, Yahoo,
Virtual Earth and many more); Map24 support for development
8. Screenshot
of analyzed demo
A Current State Analysis
92
A.1.2 WMS Mapper
As of: May 15, 2007
1. General
Name
URL
Home
Documentation
Download
Live Demo
Current verion
Last update
License
Developed by
Short Description
WMS Mapper
http://wms-map.sourceforge.net
See Home
See Home
See Home
0.03
k. A.
Academic Free License (AFL), Artistic License
k. A.
WMS Mapper is a lean JavaScript library for the integration of WMS
services, with simple zoom and pan functionalities.
2. System
Architecture
Programming language
Prerequisites
Supported browser
Where applicable, integration with
other software
client-side
JavaScript
k. A.
Prototype
3. Community
Revision Administration
Mailing Lists (URL)
Developer ML
Mails per month1
Total number of active developers2
User ML
Mails per month1
Total number of active users2
commercial support
-
-
k. A.
4. Documentation
For installation/development/application (suggestions, tutorials, URL)
no installation required; no documentation - only brief introductory
example on start page
5. Usability
All analysis is based on demo on start page
Usability – General Impression
plain, only two zoom buttons, intuitive navigation, missing zoom depth
orientation and other interaction possibilities
Continued on next page
1
2
Average monthly mail volume in investigated time period October 2006 - March 2007 (6 months)
Total number of active developers/users in investigated time period October 2006 - March 2007 (6 months))
A Current State Analysis
Main map
Overview map
Layer overview
Legend
Scale bar
Toolbar
Zoom bar
Pan navigation panel
General zooming
93
plain, well integrated into website
not like conventional toolbars; very minimalistic; only ZoomIn and
ZoomOut button; click on button starts zoom process - therefore no
extra button actions required
-
Zooming/panning with keyboard
not required to switch between pan and zoom mode; maz/min zoom
level not discernible; no ability to set map to default zoom value; zooming only with buttons; zooming to a specific location not possible
unhindered smooth panning with Drag&Drop; background loading of
map causes almost simultaneous map movement; with large panning
steps the pre-loaded tiles are not sufficient
-
Tiling
yes
Zooming with double-click
Zooming with mousewheel
Zooming with zoom box
General panning
6. Other Features
All analysis is based on demo on start page
Analysis function
Search function
Help function
Print function
-
7. Notes
◦ JavaScript API
◦ easy to integrate into websites
◦ GetFeatureInfo to follow shortly
8. Screenshot
of analyzed demo
A Current State Analysis
A.2 Free & client-serverside
Free Web Mapping Application with Integrated Server Component
94
A Current State Analysis
95
A.2.1 CartoWeb
As of: May 15, 2007
1. General
Name
URL
Home
Documentation
Download
Live Demo
Current version
Last update
License
Developed by
Short Description
CartoWeb
http://cartoweb.org
http://cartoweb.org/documentation.html
http://cartoweb.org/downloads.html
http://cartoweb.org/demo.html
3.3.0
August 31, 2006
GNU GPL
Camptocamp SA, Switzerland
CartoWeb is a comprehensive web mapping application for creating
specialized or more extensive applications. Use as SOAP Web Service is
also possible.
2. System
Architecture
Programming language
Prerequisites
Supported browser
Where applicable, integration with
other software
client-serverside
PHP 5
◦ Webserver (recommended: Apache)
◦ PHP 5.0.3+
◦ UMN MapServer 4.4+ and PHP/MapScript
◦ PostgreSQL/PostGIS (optional)
compatible with: Mozilla 1.7+, Firefox 1.07+, IE 6+, Safari 1.3.2+
incompatible with Opera, IE 5 (Mac), Konqueror
based on UMN MapServer
3. Community
Revision Administration
Mailing Lists (URL)
Developer ML
Mails per month1
Total number of active developers2
User ML
Mails per months1
Total users per month2
Commercial support
CVS (cvs -d :pserver:[email protected]:/var/lib/cvs/
public co cartoweb3)
http://cartoweb.org/contact.html
16
12
80
86
k. A.
4. Documentation
For installation/development/operation (suggestions, tutorials, URL)
very good and comprehensive (250 pages), user manual und developer
manual (incl. installation instructions); Workshop: GettingStarted +
Materials
5. Usability
All analysis is based on demo: http:// cartoweb.org/ demos/ demoCS.php
Usability – General Impression
seems quite static, conspicuous updating of map, overview map and
legend after each change; ’Loading’ message requires a lot of patience
Continued on next page
1
2
Average monthly mail volume in investigated time period October 2006 - March 2007 (6 months)
Total number of active developers/users in investigated time period October 2006 - March 2007 (6 months))
A Current State Analysis
Main map
Overview map
Layer overview
Legend
Scale bar
Toolbar
Zoom bar
Pan navigation panel
General zooming
96
adjustable map size (via Combobox), current coordinates of control panel
on map edge
fixed zoom level, hence no centering required; sections can only be moved
by clicking
combined with a legend; can be de/activated with check boxes; thematically grouped and collapsible; a lot of information: risk of interleaving;
update button needs to be pressed after change has been made
combined with layer display; collapsible, disadvantage: appears very interleaved, cumbersome to open all legend components with corresponding
loss of orientation, in part not always clear what is layer and what is legend
only
bar below map, additional scale menu field
usual functions, noticeable: drawing tools
on map edge
Zooming/panning with keyboard
max/min zoom level can only be seen on scale Combobox bar, zoom magnifier remains active
yes (also possible by holding down Shift-key; colorful underlay of pulledout area)
unhindered smooth panning with Drag&Drop; also gradually by using navigation arrows
-
Tiling
-
Zooming with double-click
Zooming with mousewheel
Zooming with zoom box
General panning
6. Other Features
All analysis is based on demo: http:// cartoweb.org/ demos/ demoCS.php
Analysis function
Search function
Help function
Print function
distance, area and drawing functions, queries
very good: implemented as pdf export, with formatting settings, title, description, legend position and reference map
7. Notes
-
8. Screenshot
of analyzed demo
A Current State Analysis
97
A.2.2 Chameleon
As of: May 15, 2007
1. General
Name
URL
Home
Documentation
Download
Live Demo
Current version
Last update
License
Developed by
Short Description
Chameleon
http://chameleon.maptools.org
http://chameleon.maptools.org/index.phtml?page=docs.html
http://chameleon.maptools.org/index.phtml?page=downloads.html
http://www.mapsherpa.com/hawaii
2.4.1
September 6, 2006
X11-Style
DM Solutions Group, Canada
Chameleon is a shared, comprehensivly configurable PHP environment
for the development of web mapping applications. It is based on the
OGC standards for web mapping services (WMS) and WMT Viewer
Contexts. Chameleon allows for a quick generation of new applications
by way of prepared widgets.The system can be expanded by several
widgets.
2. System
Architecture
Programming language
Prerequisites
Supported browser
Where applicable, integration with
other software
client-serverside
PHP
◦ PHP 4.3.x+
◦ UMN MapServer 4.0+ and PHP/MapScript
k. A.
basiert auf UMN MapServer
3. Community
Revision Administration
Mailing lists (URL)
Developer ML
Mails per month1
Total number of active developers2
User ML
Mails per month1
Total number of active users2
Commercial support
CVS (http://chameleon.maptools.org/index.phtml?page=cvs.html)
only one ML for users and developers: http://chameleon.maptools.org/
index.phtml?page=mailinglist.html
51
63
DM Solutions Group, Canada
4. Documentation
For installation/development/operation (suggestions, tutorials, URL)
DeveloperGuide, InstallationsGuide, JavaScriptAPI, Widgets Documentation – very comprehensive, with examples
5. Usability
All analysis is based on demo http:// www.mapsherpa.com/ hawaii
Usability – General Impression
mouse cursor does not reflect selected functions – irritating; no feedback
on load time status during updating; limit-less zoom depth is irritating;
pre-defined map areas can be selected; easy-to-see layer display, manual
updating only
Continued on next page
1
2
Average monthly mail volume in investigated time period October 2006 - March 2007 (6 months)
Total number of active developers/users in investigated time period October 2006 - March 2007 (6 months))
A Current State Analysis
Main map
Overview map
Layer overview
Legend
Scale bar
Toolbar
Zoom Bar
Pan Bar
General zooming
98
map size can be set via menu field, pre-defined map sections
fixed zoom level, hence centering is not possible; section can be moved only
by click
can be de/activated with check boxes; thematically grouped; after change
has been made, need to press update button; not collapsible: very long list
requires a lot of scrolling
opens in pop-up window, static map elements only; dynamic map elements
are shown on layer list
Bar is located below the map
well-defined, partly divided with hyphens, adjoining explanations are redundant; buttons: zoomIn/Out, Pan, Reset, Distance function, Update,
Legend, QuickView; noticeable: zoom factor
at map edge
Zooming/panning with keyboard
limitless max/min zoom levels; missing zoom depth orientation; adjustable
zoom factor
yes (with zoom-in tool)
unhindered smooth panning with Drag&Drop; also gradually via navigation arrows
-
Tiling
-
Zooming with double-click
Zooming with mousewheel
Zooming with zoom box
General panning
6. Other Features
All analysis is based on demo http:// www.mapsherpa.com/ hawaii
Analysis function
Search function
Help function
Print function
Distance function
very good: implemented as pdf export, with formatting settings, title, description, legend position and reference map
7. Notes
numerous PlugIns (Widgets) available; easy to program own widgets
8. Screenshot
of analyzed demo
A Current State Analysis
99
A.2.3 iGeoPortal
As of: May 15, 2007
1. General
Name
URL
Home
Documentation
Download
Live Demo
Current version
Last update
License
Developed by
Short Description
deegree iGeoPortal
http://deegree.org
http://deegree.org/downloads/releases/igeoportal_std/
deegree-igeoportal-std_v2pre1_doc.pdf
http://deegree.org/deegree/portal/media-type/html/user/anon/page/
default.psml/js_pane/download
http://geoportal.wuppertal.de
1.2.1 (stable)
September 15, 2005
GNU GPL
lat/lon, Bonn
iGeoPortal is a browser-based client that builds on WMS, WFS and
Proxy Service services; it is primarily used for driving the WMS. iGeoPortal is the client portal component from the degree project.
2. System
Architecture
Programming language
Prerequisites
Supported browser
Where applicable, integration with
other software
client-serverside
PHP
◦ Java 1.5.x
◦ Tomcat 5.5.x
Mozilla/Firefox; IE
-
3. Community
Revision Administration
Mailing Lists (URL)
Developer ML
Mails per month1
Total number of active users2
User ML
Mails per month1
Total number of active users2
Commercial support
SVN (http://wald.intevation.org/projects/deegree/)
iGeoPortal community does not exist - only general degree user and
developer ML:
https://lists.sourceforge.net/lists/listinfo/deegree-users
https://lists.sourceforge.net/lists/listinfo/deegree-devel
49
202
92
106
lat/lon, Bonn
4. Documentation
for installation/development/operation (suggestions, tutorials, URL)
as well as new (v2) and old documentation available in pdf; brief installation instructions only; comprehensive configuration section, URLnur
kurze Installationsanleitung; umfangreicher Konfigurationsteil, URL see
above
5. Usability
All analysis is based on demo http:// geoportal.wuppertal.de
Usability – General Impression
on the whole easy-to-understand and well-arranged, relatively long map
load time, message "Map is updating" requires patience, especially during panning (inacceptable); unlimited zoom depth is irritating.
Continued on next page
1
Average monthly mail volume in investigated time period October 2006 - March 2007 (6 months)
2
Total number of active developers/users in investigated time period October 2006 - March 2007 (6 months))
A Current State Analysis
Main map
Overview map
Layer overview
Legend
Scale bar
Toolbar
Zoom bar
Pan navigation panel
General zooming
Zooming with double-click
Zooming with mousewheel
Zooming with zoom box
General panning
100
many map themes can be selected
fixed zoom level, hence no centering required; section can only be moved
by clicking; does not adjust to style of main map
thematically grouped (with the help of tabs and Combobox; after making changes a manual updating of map is required; layer sequence can be
changed, possible to select a layer
comprehensive; depends on chosen map and theme list; legend, layer and
maps should be displayed together
clear, divided by hyphens; update buttons cumbersome; convenient way of
adding new WMS services, data download for registered usersr
on map edge
Zooming/panning with keyboard
unlimited zoom-in, missing zoom depth orientation
yes (with zoom-In tool)
unhindered smooth panning with Drag&Drop; also gradually using navigation arrows
-
Tiling
-
6. Other Features
All analysis is based on demo http:// geoportal.wuppertal.de
Analysis function
Search function
Help function
Print function
queries (have to choose from theme list)
city district/accomodation searches: 2 Comboboxes, must confirm;street
search: at least three characters, confirm entry, street/house numbers meeting this criteria are shown in combobox, final selection must be confirmed
with extra button – not very user friendly!
comprehensive user help topics can be retrieved from new browser window
for printing current map section with accompanying legend is opened in
browser window
7. Notes
iGeoPortal can be expanded as needed; at this time following module is
available:
map (supports WMS, WMC and own maps), download (data as GML or
Shapefile), gazetteer (supports spatial research), security (integration of
deegree iGeoSecurity is possible), catalogue (access to meta dates through
Catalogue Service)
8. Screenshot
of analyzed demo
A Current State Analysis
101
A.2.4 ka-Map
As of: May 15, 2007
1. General
Name
URL
Home
Documentation
Download
Live Demo
Current version
Last Update
License
Developed by
Short Description
ka-Map
http://ka-map.maptools.org
http://ka-map.ominiverdi.org/wiki/index.php/Main_Page
http://ka-map.maptools.org/index.phtml?page=downloads.html
http://ka-map.ominiverdi.org/wiki/index.php/Links_to_some_
ka-Map_applications
1.0
February 5, 2007
MIT
DM Solutions Group, Canada
Ka-Map intends to provide a JavaScript API for the development of
highly interactive web mapping interfaces.
2. System
Architecture
Programming language
Prerequisites
Supported browser
Where applicable, integration with
other software
client-serverside
JavaScript, PHP
UMN MapServer und PHP/MapScript
Mozilla/Firefox 1.0+; IE 6; Safari; Opera 7+; Netscape 7+; Epiphany
based on UMN MapServer
3. Community
Revision Administration
Mailing Lists (URL)
Developer ML
Mails per month1
Total number of active developers2
User ML
Mails per month1
Total number of active users2
Commercial support
CVS (http://ka-map.maptools.org/index.phtml?page=cvs.html)
http://ka-map.maptools.org/index.phtml?page=mailinglist.html
11
7
96
121
DM Solutions Group, Canada
4. Documentation
for installation/development/operation (Suggestions, tutorials, URL)
comprehensive (good start with map server settings etc., Overlay API,
User guide (!) and developer documentation); installation instruction in
the readme.txt in installation folder
5. Usability
All analysis is based on the current CVS(!) demo: http:// www.ominiverdi.org/ ka-map/ ka-map/ htdocs/
Usability – General Impression
comprehensive toolbar; GUI well laid out; comfortable panning; missing
zoom depth orientation
Continued on next page
1
2
Average monthly mail volume in investigated time period October 2006 - March 2007 (6 months)
Total number of active developers/users in investigated time period October 2006 - March 2007 (6 months))
A Current State Analysis
Main Map
Overview map
Layer overview
Legend
Scale bar
Toolbar
Zoom bar
Pan navigation panel
General Zooming
102
map size dynamically adjusts to size of browser window
fixed zoom level, hence centering is not possible; section can be moved
with Drag&Drop, main map is updated after release
combined with legend; can be deactivated with check boxes; adjustable
layer sequence and transparency; thematically grouped and collapsible; a
lot of information: interleaving danger
combined with layer display, pulled up by a tab
bar is semi-transparent and integrated into map; additionally - scale menu
field
comprehensive; usual functions, noticeable: send-this-view-to-a-friend button
-
Zooming/panning with keyboard
appropriate zoom buttons are deactivated at max-/min levels; total of 5
zooming tools (zoomIn, zoomBox, zoomOut, zoomReset, Scale menu field);
yes
yes (with extra zoom tool; colored underlay of pulled-out area)
unhindered, smooth panning with Drag&Drop; no navigation arrows;
sometimes iritating delays during reloading of tiles
-
Tiling
ja
Zooming with double-click
Zooming with mousewheel
Zooming with zoom box
General panning
6. Other Features
All analysis is based on the current CVS(!) demo: http:// www.ominiverdi.org/ ka-map/ ka-map/ htdocs/
Analysis function and Queries
Search function and country search
Help function
Print function
short, semi-transparent instructions with icons and explanation on top of
the map, well implemented
can be saved in various formats: pdf, png, jpg, gif, geotiff; with legend and
scale
7. Notes
AJAX u. MapServer settings for ka-Map:
http://www.xml.com/lpt/a/1606
8. Screenshot
of analyzed demo
A Current State Analysis
103
A.2.5 Mapbender
As of: May 15, 2007
1. General
Name
URL
Home
Documentation
Download
Live Demo
Current version
Last update
License
Developed by
Short Description
Mapbender
http://www.mapbender.org
see Home
http://www.mapbender.org/index.php/Download_Mapbender
http://www.mapbender.org/index.php/Mapbender_Gallery
2.4.1
March 23, 2007
GNU GPL
WhereGroup, Bonn
Mapbender is a web-based GIS frontend implemented as PHP-based environment for the OGC-WMS/WFS conforming management of display,
maintenance, navigation and queries.
2. System
Architecture
Programming language
Prerequisites
Supported browser
Where applicable, integration with
other software
client-serverside
PHP
◦ Webserver (Apache, MS IIS)
◦ PHP
◦ database (MySQL or PostgreSQL)
Mozilla/Firefox 1.x+, IE 6+
-
3. Community
Revision Administration
Mailing Lists (URL)
Developers ML
Mails per month1
Total number of active developers2
User ML
Mails per month1
Total number of active users2
Commercial support
SVN (http://www.mapbender.org/index.php/SVN)
http://www.mapbender.org/index.php/Mapbender_Mailing_Lists
55
46
107
98
WhereGroup, Bonn
4. Documentation
for installation/development/operation (suggestions, tutorials, URL)
very good installation manual (http://www.mapbender.org/index.php/
Installation_de, german); general info for users; available in Englisch,
German)
5. Usability
All analysis is based on demo http:// www.mainz.de/ mainzextern/ geografischeinformationen/ index.htm
Usability – General impression
quick load time even without AJAX; many functions; missing zoom
depth orientation; layer overview minimizable – easy-to-see
Continued on next page
1
2
Average monthly mail volume in investigated time period October 2006 - March 2007 (6 months)
Total number of active developers/users in investigated time period October 2006 - March 2007 (6 months))
A Current State Analysis
Main map
Overview map
Layer overview
Legend
Scale bar
Toolbar
Zoom bar
Pan navigation panel
General zooming
104
any map size can be set via Drag&Drop
unchanging zoom level, as a result no centering required; section can only
be moved by click, pull out of new area possible
thematically grouped and completely minimizable; layers are collapsible
and can be de/activated with through check boxes
legend button opens another window containing a lot of additional information; disadvantage: cumbersome and convoluted
Bar is integrated into map (no transparency); additional scale menu field
and editable scale text field exist
very extensive; noticeable: determine new centre of picture, show coordinates (activate with click under the map), sign off (automatically after 15
minutes), street search, enter coordinates
on map edge
Zooming/panning with Keyboard
Zoom-In/Out tools remain visually active at max/min level (function is
deactivated); Zoom Reset; Zoom History (previous, next)
yes (with extra zoom box tool)
unhindered smooth panning via Drag&Drop; also gradually using navigation arrows
-
Tiling
-
Zooming with double-click
Zooming with mousewheel
Zooming with zoom box
General panning
6. Other Features
All analysis is based on demo http:// www.mainz.de/ mainzextern/ geografischeinformationen/ index.htm
Analysis function
Search function
Help function
Printing function
Queries, measurement function, coordinates pad
Street search
Operating suggestions page, tool tips
generates HTML; with title, date, scale, description
7. Notes
◦ Geo CMS
◦ Security Management
◦ quick map assembly through PNG-Interlacing
8. Screenshot
of analyzed demo
A Current State Analysis
105
A.2.6 Mapbuilder
As of: May 15, 2007
1. General
Name
URL
Home
Documentation
Download
Live Demo
Current version
Last update
License
Developed by
Short Description
Mapbuilder
http://communitymapbuilder.org
http://communitymapbuilder.org/display/MAP/User+Guide
http://communitymapbuilder.org/display/MAP/Downloads
http://communitymapbuilder.org/display/MAP/Examples
1.0.1
July 19, 2006
GNU LGPL
OSGeo
Mapbuilder is an AJAX, web-based map client for the WMS and transactional WFS (WFS-T) OGC services. The modular design permits the
installation of own widgets.
2. System
Architecture
Programming language
Prerequisites
Supported browser
Where applicable, integration with
other software
client-serverside
JavaScript, XML
Apache/PHP oder Tomcat
Firefox 1.0+, Internet Explorer 6.0+, Mozilla 1.3+, Navigator 6+
Incompatible with: IE 5.5, Safari, Netscape 4
-
3. Community
Revision Adminstration
Mailing Lists (URL)
Developer ML
Mails per month1
Total number of active developers2
Anwender-ML
Mails per month1
Total number of active users2
Commercial support
SVN (http://communitymapbuilder.org/display/MAP/
SVN+Repository)
http://ka-map.maptools.org/index.phtml?page=mailinglist.html
120
47
65
78
Contact through developer ML
4. Documentation
for installation/development/operation (suggestions, tutorials, URL)
well structured user guide, succinctly written; installation: http://
communitymapbuilder.org/display/MAP/Installing+MapBuilder; tutorials and QuickStart see link under (1)
5. Usability
All analysis is based on demo http:// geoservices.cgdi.ca/ mapbuilder/ demo/ Demis/ index.html
Usability – General Impression
well laid out and self-explanatory; noticeable feature: ’Back’ and ’Forward’ buttons; no feedback on load time status during updating,
max/min zoom depth not defined (at sufficiently wide zoom both result
in error messages)
Continued on next page
1
2
Average monthly mail volume in investigated time period October 2006 - March 2007 (6 months)
Total number of active developers/users in investigated time period October 2006 - March 2007 (6 months))
A Current State Analysis
Main map
Overview map
Layer overview
Legend
Scale bar
Toolbar
Zoom bar
Pan navigation panel
General zooming
106
active panel position in degrees, minutes and seconds at map edge
can be de/activated with check boxes (see Time Series Demo http://
geoservices.cgdi.ca/mapbuilder/demo/timeSeries/index.html)
only editable scale text field is available
usual functions, noticeable(1): Zoom History (stores recently retrieved map
sections); noticeable(2): area of interest funktion (exact function unclear
– could not be tested in demo)
-
General panning
Zooming/panning with keyboard
maximum zoom level only recognizeable in scale text field (Value ’0’),
WMS error message with additional zoom-in; minimum zoom level not
defined, map disappears with sufficiently high zoom-out, followed by WMS
error message – Zoom magnifier still active
yes (also possible by pressing Shift-key; colored underlay of pulled-out
area)
unhindered, smooth panning per Drag&Drop; no navigation arrows
-
Tiling
-
Zooming with double-click
Zooming with mousewheel
Zooming with zoom box
6. Other Features
All analysis is based on demo http:// geoservices.cgdi.ca/ mapbuilder/ demo/ Demis/ index.html
Analysis function
Search function
Help function
Print function
’area of interest’ funktion (see toolbar)
-
7. Notes
◦
◦
◦
◦
◦
8. Screenshot
of analyzed demo
uses AJAX
ModelViewController design pattern
Draws maps of WMS, WFS, GeoRSS und Google Maps
supports Web Map Context (WMC) and Open Web Services Context
SVG/VML rendering as of version 1.5
A Current State Analysis
107
A.2.7 MapGuide Open Source
As of: May 15, 2007
1. General
Name
URL
Home
Documentation
Download
Live Demo
Current Version
Last update
License
Developed by
Short Description
MapGuide Open Source
https://mapguide.osgeo.org
https://mapguide.osgeo.org/documentation.html
https://mapguide.osgeo.org/downloads.html
https://mapguide.osgeo.org/livegallery.html
1.1.0
2006-12-09
GNU LGPL
Autodesk, USA; now: OSGeo
MapGuide Open Source is a web mapping platform for the development
and use of spatially-referenced application.
2. System
Architecture
Programming language
Prereqisites
Supported Browser
Where applicable, integration with
other software
client-serverside
PHP, for application development .NET oder Java are also possible
◦ MapGuide Server (Linux or Windows)
◦ Webserver (Apache or MS IIS)
◦ Application Development (PHP 5.0.5+; .NET Framework 2.0 (optional); Java JDK 5.0 and Tomcat Servlet engine version 5.5.12 (optional)
◦ PROJ.4
Mozilla Firefox, IE, Safari
-
3. Community
Revision Administration
Mailing Lists (URL)
Developer ML
Mails per month1
Total number of active developers2
User ML
Mails per month1
Total number of active users2
Commercial support
SVN (https://mapguide.osgeo.org/subversionconfig.html)
dev (http://lists.osgeo.org/mailman/listinfo/mapguide-internals)
user (http://lists.osgeo.org/mailman/listinfo/mapguide-users)
168
42
527
297
Autodesk, USA
4. Documentation
For installation/development/operation (suggestions, tutorials, URL)
extensive documentation and installation manual, GettingStarted manual very good; URL at (1)
5. Usability
All analysis is based on demo http:// data.mapguide.com/ mapguide/ phpviewersample/ ajaxtiledviewersample.
php
Usability – General impression
dynamic zoom bar; well-arranged layout; status bar with coordinates
and scale; mouse cursor does not reflect selected functions – irritating
Continued on next page
1
Average monthly mail volume in investigated time period October 2006 - March 2007 (6 months)
2 Total number of active developers/users in investigated time period October 2006 - March 2007 (6 months))
A Current State Analysis
Main map
Overview map
Layer Overview
Legend
Scale bar
Toolbar
Zoom bar
Pan navigation panel
General zooming
108
map size adjusted dynamically to browser window
combined with legend; can be de/activated through check boxes; thematically divided and collapsible
only scale value shown in status bar
commonly-used functions (ZoomIn/Out, Zoom box, Pan, Queries, Delete
and Print function); noticeable: Zoom menu with history buttons (previous, next) and Reset, as well as extensive Buffer function
ability to freely place on map(!), together with pan navigation
integrated below zoom bar
Zooming/panning with keyboard
good zoom depth orientation with zoom bar; no deactivation of zoom buttons at maximum zoom level
yes (with extra zoom box tool; also possible with held-down Shift-key;
color shading of selected area)
unhindered smooth panning with Drag&Drop; in addition gradually via
navigation arrows of zoom bar
-
Tiling
ja
Zooming with double-click
Zooming with mouse wheel
Zooming per zoom box
General panning
6. Other Features
All analysis is based on demo http:// data.mapguide.com/ mapguide/ phpviewersample/ ajaxtiledviewersample.
php
Analysis function
Search function
Help function
Print function
queries, Delete function, Are function
Address and Owner
optional addition of legends, titles, north arrow; opens as HTML in pop-up;
good implementation
7. Notes
◦ uses own XML data base structure
◦ 2 viewers: AJAX and DWF (vector-based, only for Win, PlugIn required)
◦ commercial-proprietary version: Autodesk MapGuide Enterprise 2007
◦ fitting Authoring Tool MapGuide Studio in MapGuide Web Server Extensions
◦ put under GNU LGPL by Autodesk in November 2005
◦ http://www.heise.de/newsticker/meldung/66808
8. Screenshot
of analyzed demo
A Current State Analysis
109
A.2.8 MappingWidgets
As of: May 15, 2007
1. General
Name
URL
Home
Documentation
Download
Live-Demo
Current version
Last update
License
Developed by
Short Description
MappingWidgets
http://mappingwidgets.sourceforge.net
http://mappingwidgets.sourceforge.net/manual
http://sourceforge.net/project/showfiles.php?group_id=130528
http://mappingwidgets.sourceforge.net/demo/mapserver
0.3.1
March 17, 2006
GNU GPL
k. A.
A map widget (Zoom, Pan, Information etc.) for simple OGC WMS
clients. PHP Smarty expanded with corresponding plugins.
2. System
Architecture
Programming language
Prerequisites
Supported browser
Where applicable, integration with
other software
client-serverside
PHP, JavaScript
◦ Smarty (PHP template framework)
◦ UMN Mapserver and PHP/MapScript (optional)
k. A.
based on UMN MapServer (optional)
3. Community
Revision Administration
Mailing Lists (URL)
Developer ML
Mails per month1
Total number of active developers2
User ML
Mails per month1
Total number of active userss2
Commercial support
SVN (http://sourceforge.net/svn/?group_id=130528)
k. A.
4. Documentation
For installation/development/operation (suggestions, tutorials, URL)
Installation, Usage, Design - very short and brief, missing examples, not
very helpful; URL under (1)
5. Usability
All analysis is based on demo http:// mappingwidgets.sourceforge.net/ demo/ mapserver
Usability – General impression
no feedback on load time status during updating; panning only with
Drag&Drop; limitless max/min zoom depth is irritating; noticeable:
zoom history buttons
Continued on next page
1
2
Average monthly mail volume in investigated time period October 2006 - March 2007 (6 months)
Total number of active developers/users in investigated time period October 2006 - March 2007 (6 months))
A Current State Analysis
Main map
Overview map
Layer overview
Legend
Scale bar
Toolbar
110
Zoom bar
Pan navigation panel
simple; map size cannot be changed
scroll bar, thematically grouped
usual functions (ZoomIn/Out, Pan, Queries, Distance function); noticeable: Zoom History buttons (first, previous, next, last)
-
General zooming
Zooming with double-click
Zooming with mousewheel
Zooming with zoom box
General panning
Zooming/panning with keyboard
infinite max/min zoom depth; missing zoom depth orientation
yes (with ZoomIn tool; colorful underlay of pulled-out area)
unhindered smooth panning with Drag&Drop; no navigation arrows
-
Tiling
-
6. Other Features
All analysis is based on demo http:// mappingwidgets.sourceforge.net/ demo/ mapserver
Analysis function
Search function
Help function
Print function
queries, distance function
-
7. Notes
module for CMS »Drupal« possible
8. Screenshot
of analyzed demo
A Current State Analysis
111
A.2.9 p.mapper
As of: May 15, 2007
1. General
Name
URL
Home
Documentation
Download
Live Demo
Current version
Last update
License
Developed by
Short Description
p.mapper
http://www.pmapper.net
http://www.pmapper.net/documentation.shtml
http://www.pmapper.net/download.shtml
http://www.pmapper.net/demo.shtml
3.0.1 (stable)
December 30, 2006
GNU GPL
Armin Burger
P.mapper is a Free map server template system which is implemented
with PhPMap Script, and offers an attractive user interface
2. System
Architecture
Programming language
Prerequisites
Supported browser
Where applicable, integration with
other software
client-serverside
PHP
UMN MapServer and PHP/MapScript
Mozilla/Firefox 1.x+; IE 5/6; Opera 6.+: Netscape 6.1+
based on UMN MapServer
3. Community
Revision Administration
Mailing Lists (URL)
Developer ML
Mails per month1
Total number of active developers2
User ML
Mails per month1
Total number of active users2
commercial support
SVN (http://www.pmapper.net/download.shtml)
https://lists.sourceforge.net/lists/listinfo/pmapper-users
82
61
u. a. Intevation GmbH, Osnabrück
4. Documentation
for installation/development/operation (suggestions, tutorials, URL)
Quick Install instruction and user manual; URL unter (1)
5. Usability
All analysis is based on demo http:// www.pmapper.net/ demo.shtml (medium)
Usability – General Imperession
long load times, no AJAX supported panning; many functions; fast zoom
action (subjective impression) through continuous zooming effect; demo
only retrievable in pop-up window
Continued on next page
1
2
Average monthly mail volume in investigated time period October 2006 - March 2007 (6 months)
Total number of active developers/users in investigated time period October 2006 - March 2007 (6 months))
A Current State Analysis
Main map
Overview map
Layer overview
Legend
Scale bar
Toolbar
Zoom bar
Pan navigation panel
General zooming
112
map size adjusts to browser window
fixed zoom level, no centering required; section can be moved with
Drag&Drop or mouse click
combined with legend; can be de/activated with check boxes; thematically
grouped and collapsible
combined with layer display
Bar integrated into map; additional editable scale text field also available
comprehensive; noticeable: add location (set marker); download; select
(multiple queries, note combobox menu under map, auto identify (=Infoabfrage)
yes (remarkable: continuous zooming with slider, ie. on-the-fly scaling of
map; enables good zoom depth orientation)
-
General panning
Zooming/panning with keyboard
maximum zoom level ’1:0’ does not make sense; ZoomIn/Out tool remains
active at max/min level; Zoom Reset; Zoom History (previous, next)
yes (as of v3.1)
yes (with ZoomIn tool; also by holding down Shift-key; colorful underlay
of pulled-out area)
unhindered smooth panning with Drag&Drop; no navigation arrows
yes
Tiling
-
Zooming with double-click
Zooming with mousewheel
Zooming with zoom box
6. Other Features
All analysis is based on demo http:// www.pmapper.net/ demo.shtml (medium)
Analysis function
Search function
Help function
Print function
queries, distance measurements, add location
country and city search
HTML and PDF formats possible; with reference map, legend and scale
7. Notes
-
8. Screenshot
of analyzed demo
A Current State Analysis
A.3 Proprietary & client-side
Proprietary Web Mapping Application with 100% JavaScript
113
A Current State Analysis
114
A.3.1 Google Maps
As of: May 15, 2007
1. General
Name
URL
Home
Documentation
Download
Live Demo
Current version
Last update
License
Developed by
Short Description
Google Maps
http://maps.google.de
API: http://www.google.com/apis/maps/documentation/
FAQ: http://www.google.com/apis/maps/faq.html
see Home
2.79 (API)
April 18, 2007
proprietary
Google, USA
GoogleMaps is a JavaScript API for the integration of dynamic maps
into any website.
2. System
Architecture
Programming language
Prerequisites
supported browser
Where applicable, integration with
other software
client-side
JavaScript
Firefox 0.8+, IE 6.0+, Safari 1.2.4+, Netscape 7.1+, Mozilla 1.4+,
Opera 8.02+
not specified
3. Community
Revision Administration
Mailing Lists (URL)
Developer ML
Mails per month1
Total number of active developers2
User ML
Mails per month1
Total number of active users2
Commercial support
GoogleGroups:
http://groups.google.de/group/Google-Maps-DE (german)
http://groups.google.de/group/Google-Maps-API (english)
-3
-3
Google
4. Documentation
For installation/development/operation (suggestions, tutorials, URL)
comprehensive API reference with many practical examples; URL under
(1)
5. Usability
All analysis is based on demo http:// maps.google.de
Usability – General Impression
GUI intuitive, clear and attractive; outstanding pan/zoom properties;
very smooth and easy navigation
Continued on next page
1
Average monthly mail volume in investigated time period October 2006 - March 2007 (6 months)
Total number of active developers/users in investigated time period October 2006 - March 2007 (6 months))
3
Automatic Analysis not possible in Google Groups.
2
A Current State Analysis
Main map
Overview map
Layer overview
Legend
Scale bar
Toolbar
Zoom bar
Pan navigation panel
General zooming
115
almost all components/tools are placed on the map; map size adjusts dynamically to browser window
minimizeable; section can be moved with Drag&Drop or double click; automatic, animated centering of section after panning; adjusts to style of
main map
not a typical layer display; three viewing types (Map, Satellite, Hybrid)
can be selected through a button
Bar integrated into map
not a typical toolbar: Print, e-mail, URL to this page as well as extensive search function, search businesses, get directions; only with google
account: store locations and enter personal, geographically-referenced comments (through My Maps); plain and very clearly structured
integrated into map; incl. zoom-reset button in pan navigation panel
above zoom bar
Zooming/panning with keyboard
switch between pan and zoom mode not required; zoom with zoom bar or
double-click; good zoom depth orientation
yes
yes (good visual effect)
unhindered smooth panning with Drag&Drop; background reloading results in map movement without any (!) time delay
yes
Tiling
yes
Zooming with double-click
Zooming with mousewheel
Zooming with zoom box
General panning
6. Other Features
All analysis is based on the demo http:// maps.google.de
Analysis function
Ssearch function
Help function
Print function
address search (Geocoding), find businesses
very comprehensive
opens as HTML pop-up; print dialog opens automatically; notes can be
added in a special field; satellite maps not printable
7. Notes
◦ proprietary AJAX solution
◦ good API for integration of maps into own website (integration only with
time-consuming key process); commercial use not permitted
◦ started on February 8,2005
◦ changelogs: http://mapki.com/wiki/Changelog
8. Screenshot
of analyzed demo
B Class Diagram
116
Point
Path
Polygon
Feature
MouseWheel
LayerSwitcher
Google
Drag
Handler
OverviewMap
Map
VirtualEarth
events
FixedZoomLevels
EventPane
calculateNewTileSize()
calculateNewZoomlevel()
finishZoomAnimation()
pan()
panSlide()
prepareZoomAnimation()
runZoomAnimation()
setScaleResolution()
zoomIn()
zoomOut()
zoomSlide()
zoomTo()
zoomToExtent()
0..*
Layer
events
Yahoo
cloneBaseLayerDiv()
cloneBaseLayerDiv_share()
getCenterTile()
getLonLatFromViewPort()
getResolution()
getViewPortPxFromLonLat()
scaleTileTo()
scaleTilesOfGrid()
scaleZoomOutTile()
scaleZoomOutTile_share()
setLoadendVisibility()
setTilesOutsideInvisible()
setZoomOutTile()
setZoomOutTile_share()
Canvas
MultiMap
Image
WMS Untiled
cloneBaseLayerDiv()
getCenterTile()
getTileSize()
cloneBaseLayerDiv()
getCenterTile()
getTileSize()
getURL()
scaleZoomOutTile()
setZoomOutTile()
mapDivDblClick()
update()
updateMapToRect()
updateOverview()
updateRectToMap()
Box
Keyboard
MousePosition
DrawFeature
Navigation
0..*
Control
HTTPRequest
Permalink
0..*
MapServer Untiled
Markers
Feature
Marker
Popup
Scale
events
events
0..*
WFS
Tile
Grid
Anchored
Box
0..*
Image
Vector
Vector
cloneBaseLayerDiv()
getCenterTile()
getTileSize()
scaleTilesOfGrid()
scaleZoomOutTile()
spiralTileLoad()
setTilesOutsideInvisible()
setZoomOutTile()
WFS
GML
ZoomToMaxExtent
AnchoredBubble
Text
Boxes
PanZoom
NavToolbar
TMS
WorldWind
MouseDefaults
defaultDblClick()
defaultWheelDown()
defaultWheelUp()
zoomBoxEnd()
Geometry
Elements
KaMap
Panel
GeoRSS
Renderer
MapServer
SelectFeature
WFS
Collection
WMS
Point
Rectangle
EditingToolbar
MouseToolbar
SVG
MultiLineString
VML
MultiPolygon
Polygon
KeyboardDefaults
PanZoomBar
Surface
defaultDblClick()
getURL()
ZoomBox
buttonDown()
defaultKeyPress()
divClick()
moveZoomBar()
zoomBarDown()
zoomBarDrag()
zoomBarUp()
DragPan
MultiPoint
ArgParser
Format
GeoRSS
Events
LonLat
Bounds
Ajax
WKT
Curve
GML
KML
LineString
Util
OpenLayers
TM
easeInOutPan()
easeInOutZoom()
Pixel
Size
Element
Icon
WFS
LinearRing
UML class diagram of OpenLayers 2.4 RC 5 (2007-05-25)
colored = edited classes and functions for animated zooming and panning
C Test Plan
Date:
Test plan version: 1.1
Operating System:
Browser:
Tester:
Test Duration:
Notes:
This test plan can be used to confirm that all functions of the animated zooming & panning
feature OpenLayers work as expected.
Each test suite can be carried out separately, therefore it is not necessary to carry out the
tests in any particular sequence.
For error messages please indicate the version number of this document (1.1) as well as the
number of the failed test.
The OpenLayers sample demo controls.html shown in the index examples will be used for
all tests.
Overview
Test segment completely successful?
Testsuite 1: Zooming with Zoom bar . . . . . . . . . . . . . . . . . . . . . . . . . . . . . . . . . . . . . . . . . . . . yes no
Testsuite 2: Zooming with mouse . . . . . . . . . . . . . . . . . . . . . . . . . . . . . . . . . . . . . . . . . . . . . . . yes no
Testsuite 3: Zooming with keyboard . . . . . . . . . . . . . . . . . . . . . . . . . . . . . . . . . . . . . . . . . . . . yes no
Testsuite
Testsuite
Testsuite
Testsuite
4:
5:
6:
7:
Panning
Panning
Panning
Panning
with Pan bar . . . . . . . . . . . . . . . . . . . . . . . . . . . . . . . . . . . . . . . . . . . . . . yes
with mouse . . . . . . . . . . . . . . . . . . . . . . . . . . . . . . . . . . . . . . . . . . . . . . . . yes
with keyboard . . . . . . . . . . . . . . . . . . . . . . . . . . . . . . . . . . . . . . . . . . . . . yes
using overview map . . . . . . . . . . . . . . . . . . . . . . . . . . . . . . . . . . . . . . . yes
118
no
no
no
no
C Test Plan
119
Test suite C.1: Zooming with Zoombar
Preparation: Load the OpenLayers sample demo controls.html. Open the overview map by clicking
on the blue lower »+« located at the map edge.
C.1.1 Click the »+« button located at the upper edge of the zoom bar. Does zooming into the main
map take place? . . . . . . . . . . . . . . . . . . . . . . . . . . . . . . . . . . . . . . . . . . . . . . . . . . . . . . . . . . . . . . . . . .yes no
Is the zoom level increased by exactly one level? . . . . . . . . . . . . . . . . . . . . . . . . . . . . . . . . . . yes no
Is the zoom-in process animated? . . . . . . . . . . . . . . . . . . . . . . . . . . . . . . . . . . . . . . . . . . . . . . . . yes no
During zoom-in, does the slider move up simultaneously with the zoom-in process? yes no
Does the red rectangle in the overview map move simultaneously and centered along with the
section of the main map? . . . . . . . . . . . . . . . . . . . . . . . . . . . . . . . . . . . . . . . . . . . . . . . . . . . . . . . . .yes no
Is the scaled main map updated with (successively) newly-drawn tiles? . . . . . . . . . . . yes no
Does the status bar of the browser show the completion of the map loading process (ex. confirmation done)? . . . . . . . . . . . . . . . . . . . . . . . . . . . . . . . . . . . . . . . . . . . . . . . . . . . . . . . . . . . . . . . . . yes no
C.1.2 Click the »–« button located at the lower edge of the zoom bar. Does zooming out of the
main map take place? . . . . . . . . . . . . . . . . . . . . . . . . . . . . . . . . . . . . . . . . . . . . . . . . . . . . . . . . . . . . yes no
Is the zoom level decreased by exactly one level? . . . . . . . . . . . . . . . . . . . . . . . . . . . . . . . . . yes no
Is the zoom-out process animated? . . . . . . . . . . . . . . . . . . . . . . . . . . . . . . . . . . . . . . . . . . . . . . . yes no
During zoom-out, does the slider move down simultaneously with the zoom-out
process? . . . . . . . . . . . . . . . . . . . . . . . . . . . . . . . . . . . . . . . . . . . . . . . . . . . . . . . . . . . . . . . . . . . . . . . . . yes no
Does the red rectangle in the overview map move simultaneously and centered along with the
section of the main map? . . . . . . . . . . . . . . . . . . . . . . . . . . . . . . . . . . . . . . . . . . . . . . . . . . . . . . . . .yes no
During the zoom animation, is the visible area around the shrinking original map supplemented with new map information?. . . . . . . . . . . . . . . . . . . . . . . . . . . . . . . . . . . . . . . . . . . . . . .yes no
Is the scaled main map updated with (successively) newly-drawn tiles? . . . . . . . . . . . yes no
Does the status bar of the browser show the completion of the map loading process (ex. confirmation done)? . . . . . . . . . . . . . . . . . . . . . . . . . . . . . . . . . . . . . . . . . . . . . . . . . . . . . . . . . . . . . . . . . yes no
C.1.3 On the zoom bar, click on a point near the highest zoom level (directly under »+« button)
on the zoom bar. Is the main map zoomed in to the maximum zoom-in level? . . . . yes no
During the zoom-in process, does the zoom slider move simultaneously to the highest (ie.most
upper) level? . . . . . . . . . . . . . . . . . . . . . . . . . . . . . . . . . . . . . . . . . . . . . . . . . . . . . . . . . . . . . . . . . . . . . yes no
Does the status bar of the browser show the completion of the map loading process (ex. confirmation done)? . . . . . . . . . . . . . . . . . . . . . . . . . . . . . . . . . . . . . . . . . . . . . . . . . . . . . . . . . . . . . . . . . yes no
C.1.4 Click the »+« button located at the upper edge of the zoom bar. Do the main map, zoom
slider and status bar remain unchanged? . . . . . . . . . . . . . . . . . . . . . . . . . . . . . . . . . . . . . . . . . yes no
C.1.5 Click on a point near the lower limit of the zoom bar (directly above the »–« button). Is the
main map zoomed out to the maximum zoom-out level? . . . . . . . . . . . . . . . . . . . . . . . . . . yes no
During the zoom-out process, does the zoom slider move simultaneously to the lowest
level? . . . . . . . . . . . . . . . . . . . . . . . . . . . . . . . . . . . . . . . . . . . . . . . . . . . . . . . . . . . . . . . . . . . . . . . . . . . . yes no
Does the status bar of the browser show the completion of the map loading process (ex. confirmation done)? . . . . . . . . . . . . . . . . . . . . . . . . . . . . . . . . . . . . . . . . . . . . . . . . . . . . . . . . . . . . . . . . . yes no
C Test Plan
120
C.1.6 Click the »–« buttonlocated on the lower edge of the zoom bar. Doe the main map, zoom
slider and status bar remain unchanged? . . . . . . . . . . . . . . . . . . . . . . . . . . . . . . . . . . . . . . . . . yes no
C.1.7 Click the slider and, pressing down on the left mouse key, move it slowly to the upper end of
the zoom bar. Release the mouse key in the most upper zoom level area. Is the main map
zoomed in by moving the slider? . . . . . . . . . . . . . . . . . . . . . . . . . . . . . . . . . . . . . . . . . . . . . . . . . yes no
Is the overview map zoomed in by moving the slider? . . . . . . . . . . . . . . . . . . . . . . . . . . . . .yes no
Does the red rectangle in the overview map move simultaneously and centered along with the
section of the main map? . . . . . . . . . . . . . . . . . . . . . . . . . . . . . . . . . . . . . . . . . . . . . . . . . . . . . . . . .yes no
Is the scaled main map updated with (successively) newly-drawn tiles upon releasing the mouse
key? . . . . . . . . . . . . . . . . . . . . . . . . . . . . . . . . . . . . . . . . . . . . . . . . . . . . . . . . . . . . . . . . . . . . . . . . . . . . . yes no
Does the status bar of the browser show the completion of the map loading process (ex. confirmation done)? . . . . . . . . . . . . . . . . . . . . . . . . . . . . . . . . . . . . . . . . . . . . . . . . . . . . . . . . . . . . . . . . . yes no
C.1.8 Click the slider and, pressing down on the left mouse key, move it slowly to the lower end of
the zoom bar. Release the mouse key in the lowest zoom level area. Is the main map zoomed
out by moving the slider? . . . . . . . . . . . . . . . . . . . . . . . . . . . . . . . . . . . . . . . . . . . . . . . . . . . . . . . . yes no
Is the overview map zoomed out by moving the slider? . . . . . . . . . . . . . . . . . . . . . . . . . . . yes no
Does the red rectangle in the overview map move simultaneously and centered along with the
section of the main map? . . . . . . . . . . . . . . . . . . . . . . . . . . . . . . . . . . . . . . . . . . . . . . . . . . . . . . . . .yes no
During the zoom animation, is the visible area around the shrinking original map supplemented with new map information? . . . . . . . . . . . . . . . . . . . . . . . . . . . . . . . . . . . . . . . . . . . . . . yes no
Does the status bar of the browser show the completion of the map loading process (ex. confirmation done)? . . . . . . . . . . . . . . . . . . . . . . . . . . . . . . . . . . . . . . . . . . . . . . . . . . . . . . . . . . . . . . . . . yes no
C.1.9 Click the slider and, pressing down on the left mouse key, move it slowly first to the upper
and then to the lower end of the zoom bar. Release the mouse key in the lowest zoom level
area. Is the main map first zoom in and then zoomved out by moving the slider? .yes no
Is the overview map first zoom in and then zoomved out by moving the slider? . . . yes no
Does the red rectangle in the overview map move simultaneously and centered along with the
section of the main map? . . . . . . . . . . . . . . . . . . . . . . . . . . . . . . . . . . . . . . . . . . . . . . . . . . . . . . . . .yes no
Do the main map and slider stop at zoom level 0 when the mouse key is released? yes no
C.1.10 Double-click the »+« button located at the upper end of the zoom bar. Is the zoom level
increased by exactly one level? . . . . . . . . . . . . . . . . . . . . . . . . . . . . . . . . . . . . . . . . . . . . . . . . . . . yes no
C.1.11 First click the »+« button. Then double-click the »–« button located at the lower end of the
zoom bar. Examine only the effects of the double-click action. Is the zoom level decreased by
exactly one level? . . . . . . . . . . . . . . . . . . . . . . . . . . . . . . . . . . . . . . . . . . . . . . . . . . . . . . . . . . . . . . . . yes no
Test suite C.2: Zooming with Mouse
Preparation: Load the OpenLayers sample demo controls.html. Open the overview map by clicking
on the blue lower »+« located at the map edge.
C Test Plan
121
C.2.1 Double-click anywhere in the main map. Is the main map centred to the position where the
double-click occured? . . . . . . . . . . . . . . . . . . . . . . . . . . . . . . . . . . . . . . . . . . . . . . . . . . . . . . . . . . . . yes no
Does zooming into the main map take place? . . . . . . . . . . . . . . . . . . . . . . . . . . . . . . . . . . . . . yes no
Is the zoom level increased by exactly one level? . . . . . . . . . . . . . . . . . . . . . . . . . . . . . . . . . . yes no
Is the pan-zoomIn process animated? . . . . . . . . . . . . . . . . . . . . . . . . . . . . . . . . . . . . . . . . . . . . .yes no
Does the zoom slider move up by one zoom level simultaneously with the Pan-ZoomIn
process? . . . . . . . . . . . . . . . . . . . . . . . . . . . . . . . . . . . . . . . . . . . . . . . . . . . . . . . . . . . . . . . . . . . . . . . . . yes no
Does the red rectangle in the overview map move simultaneously and centered along with the
section of the main map? . . . . . . . . . . . . . . . . . . . . . . . . . . . . . . . . . . . . . . . . . . . . . . . . . . . . . . . . .yes no
Is the scaled main map updated with (successively) newly-drawn tiles? . . . . . . . . . . . yes no
Does the status bar of the browser show the completion of the map loading process (ex. confirmation done)? . . . . . . . . . . . . . . . . . . . . . . . . . . . . . . . . . . . . . . . . . . . . . . . . . . . . . . . . . . . . . . . . . yes no
C.2.2 Move the mouse cursor to any point on the main map. Then roll the mousewheel up by one
turn (away from the body). Does zooming into the main map take place? . . . . . . . . yes no
After the zoom process, is the geographic location under the mouse cursor in the same position
on the main map as before the zoom process? . . . . . . . . . . . . . . . . . . . . . . . . . . . . . . . . . . . . yes no
Is the zoom level increased by exactly one level? . . . . . . . . . . . . . . . . . . . . . . . . . . . . . . . . . . yes no
Is the Pan-ZoomIn process animated? . . . . . . . . . . . . . . . . . . . . . . . . . . . . . . . . . . . . . . . . . . . . yes no
Does the zoom slider move up by one zoom level simultaneously with the Pan-ZoomIn
process? . . . . . . . . . . . . . . . . . . . . . . . . . . . . . . . . . . . . . . . . . . . . . . . . . . . . . . . . . . . . . . . . . . . . . . . . . yes no
Does the red rectangle in the overview map move simultaneously and centered along with the
section of the main map? . . . . . . . . . . . . . . . . . . . . . . . . . . . . . . . . . . . . . . . . . . . . . . . . . . . . . . . . .yes no
Is the scaled main map updated with (successively) newly-drawn tiles? . . . . . . . . . . . yes no
Does the status bar of the browser show the completion of the map loading process (ex. confirmation done)? . . . . . . . . . . . . . . . . . . . . . . . . . . . . . . . . . . . . . . . . . . . . . . . . . . . . . . . . . . . . . . . . . yes no
C.2.3 Move the mouse cursor to any point on the main map. Then roll the mousewheel down by
one turn (towards the body). Does zooming out of the main map take place? . . . . yes no
After the zoom process, is the geographic location under the mouse cursor in the same position
on the main map as before the zoom process? . . . . . . . . . . . . . . . . . . . . . . . . . . . . . . . . . . . . yes no
Is the zoom level decreased by exactly one level? . . . . . . . . . . . . . . . . . . . . . . . . . . . . . . . . . yes no
Is the Pan-ZoomIn process animated? . . . . . . . . . . . . . . . . . . . . . . . . . . . . . . . . . . . . . . . . . . . . yes no
Does the zoom slider move down by one zoom level simultaneously with the Pan-ZoomIn
process? . . . . . . . . . . . . . . . . . . . . . . . . . . . . . . . . . . . . . . . . . . . . . . . . . . . . . . . . . . . . . . . . . . . . . . . . . yes no
Does the red rectangle in the overview map move simultaneously and centered along with the
section of the main map? . . . . . . . . . . . . . . . . . . . . . . . . . . . . . . . . . . . . . . . . . . . . . . . . . . . . . . . . .yes no
During the zoom animation, is the visible area around the shrinking original map supplemented with new map information? . . . . . . . . . . . . . . . . . . . . . . . . . . . . . . . . . . . . . . . . . . . . . . yes no
Is the scaled main map updated with (successively) newly-drawn tiles? . . . . . . . . . . . yes no
Does the status bar of the browser show the completion of the map loading process (ex. confirmation done)? . . . . . . . . . . . . . . . . . . . . . . . . . . . . . . . . . . . . . . . . . . . . . . . . . . . . . . . . . . . . . . . . . yes no
C.2.4 Move the mouse cursor to any point in the main map. Then roll the mousewheel up by several
turns (away from the body). Is the zoom level increased by exactly one level? . . . .yes no
C.2.5 Move the mouse cursor to any point in the main map. Then roll the mousewheel down by
C Test Plan
122
several turns (towards the body) . Is the zoom level decreased by exactly one level? yes no
C.2.6 Using the mouse and holding down the Shift-key, delineate a map area which comprises at
maximum 1/4 of the main map. Is the map zoomed-in to the approximate area? . yes no
Is the Pan-ZoomIn process animated? . . . . . . . . . . . . . . . . . . . . . . . . . . . . . . . . . . . . . . . . . . . . yes no
Does the zoom slider move up by one zoom level simultaneously with the Pan-ZoomIn
process? . . . . . . . . . . . . . . . . . . . . . . . . . . . . . . . . . . . . . . . . . . . . . . . . . . . . . . . . . . . . . . . . . . . . . . . . . yes no
Does the red rectangle in the overview map move simultaneously and centered along with the
section of the main map? . . . . . . . . . . . . . . . . . . . . . . . . . . . . . . . . . . . . . . . . . . . . . . . . . . . . . . . . .yes no
Is the scaled main map updated with (successively) newly-drawn tiles? . . . . . . . . . . . yes no
Does the status bar of the browser show the completion of the map loading process (ex. confirmation done)? . . . . . . . . . . . . . . . . . . . . . . . . . . . . . . . . . . . . . . . . . . . . . . . . . . . . . . . . . . . . . . . . . yes no
C.2.7 Using the mouse and holding down the Shift-key, click on any point in the main map Is the
main map centered to the (geographic) position where the mouse click occured? . . yes no
Does zooming in of the main map take place? . . . . . . . . . . . . . . . . . . . . . . . . . . . . . . . . . . . . yes no
Is the zoom level increased by exactly one level? . . . . . . . . . . . . . . . . . . . . . . . . . . . . . . . . . . yes no
Is the Pan-ZoomIn process animated . . . . . . . . . . . . . . . . . . . . . . . . . . . . . . . . . . . . . . . . . . . . . yes no
Does the zoom slider move up by one zoom level simultaneously with the Pan-ZoomIn
process? . . . . . . . . . . . . . . . . . . . . . . . . . . . . . . . . . . . . . . . . . . . . . . . . . . . . . . . . . . . . . . . . . . . . . . . . . yes no
Does the red rectangle in the overview map move simultaneously and centered along with the
section of the main map? . . . . . . . . . . . . . . . . . . . . . . . . . . . . . . . . . . . . . . . . . . . . . . . . . . . . . . . . .yes no
Is the scaled main map updated with (successively) newly-drawn tiles? . . . . . . . . . . . yes no
Does the status bar of the browser show the completion of the map loading process (ex. confirmation done)? . . . . . . . . . . . . . . . . . . . . . . . . . . . . . . . . . . . . . . . . . . . . . . . . . . . . . . . . . . . . . . . . . yes no
Test suite C.3: Zooming with Keyboard
Preparation: Load the OpenLayers sample demo controls.html. Open the overview map by clicking
on the blue lower »+« located at the map edge.
C.3.1 Press the »+« key. Does zooming into the main map take place? . . . . . . . . . . . . . . . . yes no
Is the zoom level increased by exactly one level? . . . . . . . . . . . . . . . . . . . . . . . . . . . . . . . . . . yes no
Is the ZoomIn process animated? . . . . . . . . . . . . . . . . . . . . . . . . . . . . . . . . . . . . . . . . . . . . . . . . . yes no
Does the zoom slider move up by one zoom level simultaneously with the ZoomIn
process? . . . . . . . . . . . . . . . . . . . . . . . . . . . . . . . . . . . . . . . . . . . . . . . . . . . . . . . . . . . . . . . . . . . . . . . . . yes no
Does the red rectangle in the overview map move simultaneously and centered along with the
section of the main map? . . . . . . . . . . . . . . . . . . . . . . . . . . . . . . . . . . . . . . . . . . . . . . . . . . . . . . . . .yes no
Is the scaled main map updated with (successively) newly-drawn tiles? . . . . . . . . . . . yes no
Does the status bar of the browser show the completion of the map loading process (ex. confirmation done)? . . . . . . . . . . . . . . . . . . . . . . . . . . . . . . . . . . . . . . . . . . . . . . . . . . . . . . . . . . . . . . . . . yes no
C.3.2 Press the »–« key. Does zooming out of the main map take place? . . . . . . . . . . . . . . . yes no
Is the zoom level decreased by exactly one level? . . . . . . . . . . . . . . . . . . . . . . . . . . . . . . . . . yes no
C Test Plan
123
Is the ZoomOut process animated? . . . . . . . . . . . . . . . . . . . . . . . . . . . . . . . . . . . . . . . . . . . . . . . yes no
Does the zoom slider move down by one zoom level simultaneously with the ZoomOut
process? . . . . . . . . . . . . . . . . . . . . . . . . . . . . . . . . . . . . . . . . . . . . . . . . . . . . . . . . . . . . . . . . . . . . . . . . . yes no
During the zoom animation, is the visible area around the shrinking original map supplemented with new map information? . . . . . . . . . . . . . . . . . . . . . . . . . . . . . . . . . . . . . . . . . . . . . . yes no
Is the scaled main map updated with (successively) newly-drawn tiles? . . . . . . . . . . . yes no
Does the status bar of the browser show the completion of the map loading process (ex. confirmation done)? . . . . . . . . . . . . . . . . . . . . . . . . . . . . . . . . . . . . . . . . . . . . . . . . . . . . . . . . . . . . . . . . . yes no
C.3.3 Press the »+« key twice (quickly). Is the zoom level increased by exactly one level? yes no
C.3.4 Press the »–« key twice (quickly). Is the zoom level decreased by exactly one level? yes no
Test suite C.4: Panning with Pan Bar
Preparation: Load the OpenLayers sample demo controls.html. Open the overview map by clicking
on the blue lower »+« located at the map edge.
C.4.1 Click on →. Does the section of the main map move east? . . . . . . . . . . . . . . . . . . . . . . . yes no
Is the panning process animated? . . . . . . . . . . . . . . . . . . . . . . . . . . . . . . . . . . . . . . . . . . . . . . . . yes no
Along with changes to the main map, is the section in the overview map adjusted simultaneously? . . . . . . . . . . . . . . . . . . . . . . . . . . . . . . . . . . . . . . . . . . . . . . . . . . . . . . . . . . . . . . . . . . . . . . . . . . . yes no
C.4.2 Click on ↓. Does the section of the main map move south? . . . . . . . . . . . . . . . . . . . . . . .yes no
Is the panning process animated? . . . . . . . . . . . . . . . . . . . . . . . . . . . . . . . . . . . . . . . . . . . . . . . . yes no
Along with changes to the main map, is the section in the overview map adjusted simultaneously? . . . . . . . . . . . . . . . . . . . . . . . . . . . . . . . . . . . . . . . . . . . . . . . . . . . . . . . . . . . . . . . . . . . . . . . . . . . yes no
C.4.3 Click on ←. Does the section of the main map move west? . . . . . . . . . . . . . . . . . . . . . . yes no
Is the panning process animated? . . . . . . . . . . . . . . . . . . . . . . . . . . . . . . . . . . . . . . . . . . . . . . . . yes no
Along with changes to the main map, is the section in the overview map adjusted simultaneously? . . . . . . . . . . . . . . . . . . . . . . . . . . . . . . . . . . . . . . . . . . . . . . . . . . . . . . . . . . . . . . . . . . . . . . . . . . . yes no
C.4.4 Click on ↑. Does the section of the main map move north? . . . . . . . . . . . . . . . . . . . . . . .yes no
Is the panning process animated? . . . . . . . . . . . . . . . . . . . . . . . . . . . . . . . . . . . . . . . . . . . . . . . . yes no
Along with changes to the main map, is the section in the overview map adjusted simultaneously? . . . . . . . . . . . . . . . . . . . . . . . . . . . . . . . . . . . . . . . . . . . . . . . . . . . . . . . . . . . . . . . . . . . . . . . . . . . yes no
C Test Plan
124
Test suite C.5: Panning with Mouse
Preparation: Load the OpenLayers sample demo controls.html. Open the overview map by clicking
on the blue lower »+« located at the map edge.
C.5.1 Click on the middle of the main map and move the map to any position within the main map
(holding down the mouse key). Release the mouse key. During this movement, does the main
map always move in the direction of the current mouse position? . . . . . . . . . . . . . . . . . yes no
Along with changes to the main map, is the section in the overview map adjusted simultaneously? . . . . . . . . . . . . . . . . . . . . . . . . . . . . . . . . . . . . . . . . . . . . . . . . . . . . . . . . . . . . . . . . . . . . . . . . . . . yes no
After the mouse key is released, do the main and overview map remain at the position where
the key was released? . . . . . . . . . . . . . . . . . . . . . . . . . . . . . . . . . . . . . . . . . . . . . . . . . . . . . . . . . . . . yes no
Test suite C.6: Panning with Keyboard
Preparation: Load the OpenLayers sample demo controls.html. Open the overview map by clicking
on the blue lower »+« located at the map edge.
C.6.1 Press the → key. Does the section of the main map move east? . . . . . . . . . . . . . . . . . . yes no
Is the panning process animated? . . . . . . . . . . . . . . . . . . . . . . . . . . . . . . . . . . . . . . . . . . . . . . . . yes no
Along with changes to the main map, is the section in the overview map adjusted simultaneously? . . . . . . . . . . . . . . . . . . . . . . . . . . . . . . . . . . . . . . . . . . . . . . . . . . . . . . . . . . . . . . . . . . . . . . . . . . . yes no
C.6.2 Press the ↓ key. Does the section of the main map move south? . . . . . . . . . . . . . . . . . . yes no
Is the panning process animated? . . . . . . . . . . . . . . . . . . . . . . . . . . . . . . . . . . . . . . . . . . . . . . . . yes no
Along with changes to the main map, is the section in the overview map adjusted simultaneously? . . . . . . . . . . . . . . . . . . . . . . . . . . . . . . . . . . . . . . . . . . . . . . . . . . . . . . . . . . . . . . . . . . . . . . . . . . . yes no
C.6.3 Press the ← key. Does the section of the main map move west? . . . . . . . . . . . . . . . . . .yes no
Is the panning process animated? . . . . . . . . . . . . . . . . . . . . . . . . . . . . . . . . . . . . . . . . . . . . . . . . yes no
Along with changes to the main map, is the section in the overview map adjusted simultaneously? . . . . . . . . . . . . . . . . . . . . . . . . . . . . . . . . . . . . . . . . . . . . . . . . . . . . . . . . . . . . . . . . . . . . . . . . . . . yes no
C.6.4 Press the ↑ key. Does the section of the main map move north? . . . . . . . . . . . . . . . . . . yes no
Is the panning process animated? . . . . . . . . . . . . . . . . . . . . . . . . . . . . . . . . . . . . . . . . . . . . . . . . yes no
Along with changes to the main map, is the section in the overview map adjusted simultaneously? . . . . . . . . . . . . . . . . . . . . . . . . . . . . . . . . . . . . . . . . . . . . . . . . . . . . . . . . . . . . . . . . . . . . . . . . . . . yes no
C.6.5 Press the »+« key, wait until the main map updated and press the »+« key again. Then press
the frzHome key. Examine only the effect of the »Home« key. Does the section of the main
map move west by approx. 75% of map width? . . . . . . . . . . . . . . . . . . . . . . . . . . . . . . . . . . . yes no
Is the panning process animated? . . . . . . . . . . . . . . . . . . . . . . . . . . . . . . . . . . . . . . . . . . . . . . . . yes no
C Test Plan
125
Along with changes to the main map, is the section in the overview map adjusted simultaneously? . . . . . . . . . . . . . . . . . . . . . . . . . . . . . . . . . . . . . . . . . . . . . . . . . . . . . . . . . . . . . . . . . . . . . . . . . . . yes no
C.6.6 Press the »End« key. Does the section of the main map move east by approx. 75% of map
width? . . . . . . . . . . . . . . . . . . . . . . . . . . . . . . . . . . . . . . . . . . . . . . . . . . . . . . . . . . . . . . . . . . . . . . . . . . . yes no
Is the panning process animated? . . . . . . . . . . . . . . . . . . . . . . . . . . . . . . . . . . . . . . . . . . . . . . . . yes no
Along with changes to the main map, is the section in the overview map adjusted simultaneously? . . . . . . . . . . . . . . . . . . . . . . . . . . . . . . . . . . . . . . . . . . . . . . . . . . . . . . . . . . . . . . . . . . . . . . . . . . . yes no
C.6.7 Press the »Bild ↑« key. Does the section of the main map move north by approx. 75% of map
width? . . . . . . . . . . . . . . . . . . . . . . . . . . . . . . . . . . . . . . . . . . . . . . . . . . . . . . . . . . . . . . . . . . . . . . . . . . . yes no
Is the panning process animated? . . . . . . . . . . . . . . . . . . . . . . . . . . . . . . . . . . . . . . . . . . . . . . . . yes no
Along with changes to the main map, is the section in the overview map adjusted simultaneously? . . . . . . . . . . . . . . . . . . . . . . . . . . . . . . . . . . . . . . . . . . . . . . . . . . . . . . . . . . . . . . . . . . . . . . . . . . . yes no
C.6.8 Press the »Bild ↓« key. Does the section of the main map move south by approx. 75% of map
width? . . . . . . . . . . . . . . . . . . . . . . . . . . . . . . . . . . . . . . . . . . . . . . . . . . . . . . . . . . . . . . . . . . . . . . . . . . . yes no
Is the panning process animated? . . . . . . . . . . . . . . . . . . . . . . . . . . . . . . . . . . . . . . . . . . . . . . . . yes no
Along with changes to the main map, is the section in the overview map adjusted simultaneously? . . . . . . . . . . . . . . . . . . . . . . . . . . . . . . . . . . . . . . . . . . . . . . . . . . . . . . . . . . . . . . . . . . . . . . . . . . . yes no
Test suite C.7: Panning using Overview Map
Preparation: Load the OpenLayers sample demo controls.html. Open the overview map by clicking
on the blue lower »+« located at the map edge.
C.7.1 Press the »+« key and wait until the main map is updated, then press the »+« key again.
Subsequently double-click anywhere on the overview map but outside of the red rectangle.
Examine only the effect of the double-click. Does the red rectangle move (by animation) to
the (geographic) position where the double-click
occured? . . . . . . . . . . . . . . . . . . . . . . . . . . . . . . . . . . . . . . . . . . . . . . . . . . . . . . . . . . . . . . . . . . . . . . . . . yes no
Is the overview map centered to the (geographic) position where the double-click occured?
yes no
Does the main map move simultaneously with the red rectangle, with animation? .yes no
C.7.2 Click on a point within the red rectangle in the overview map, and move the section to any
location on the overview map (holding down the mouse key). Release the mouse key.
Does the red rectangle move (by animation) to the (geographic) position where the mouse key
was released? . . . . . . . . . . . . . . . . . . . . . . . . . . . . . . . . . . . . . . . . . . . . . . . . . . . . . . . . . . . . . . . . . . . . yes no
Is the overview map centered to the (geographic) position where the mouse key was
released? . . . . . . . . . . . . . . . . . . . . . . . . . . . . . . . . . . . . . . . . . . . . . . . . . . . . . . . . . . . . . . . . . . . . . . . . . yes no
Does the main map move simultaneously with the red rectangle, with animation? .yes no
D Creative Commons License
Commons Deed
Attribution-ShareAlike 2.0 Germany
You are free:
to copy, distribute and transmit the work
to adapt the work
Under the following conditions:
Attribution. You must give the original author credit.
Share Alike. If you alter, transform, or build upon this work, you may distribute the resulting
work only under a license identical to this one.
• For any reuse or distribution, you must make clear to others the license terms of this work.
• Any of the above conditions can be waived if you get permission from the copyright holder.
Nothing in this license impairs or restricts the author’s moral rights.
The Commons Deed is a summary of the licensing agreement in commonly used language. To view
the full licensing agreement, visit
http://creativecommons.org/licenses/by-sa/2.0/de
or mail to Creative Commons, 543 Howard Street, 5th Floor, San Francisco, California, 94105,
USA.
126
E Affidavit
I hereby confirm that I prepared this thesis independently, by exclusive reliance on the
literature and tools indicated therein.
This thesis has not been submitted to any other examination authoriy in its current or an
altered form, and it has not been published.
Osnabrück, June 1, 2007
(Emanuel Schütze)
127
F CD-ROM
The full content of the CD-ROM is available at http://www.smartmapbrowsing.org/download.html.
128


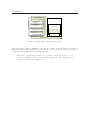


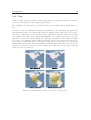

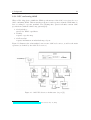


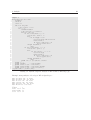


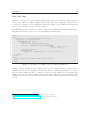


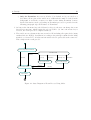
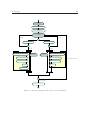


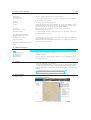


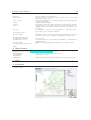


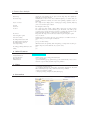

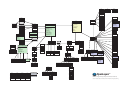


![ホームページアドレス [ http://a-rikujou.kuronowish.com/ ]](http://vs1.manualzilla.com/store/data/006624305_2-1c29ae868e2049c12c3ae532360f5161-150x150.png)