1
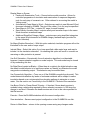
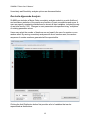
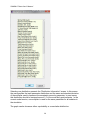
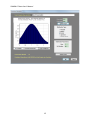
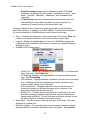
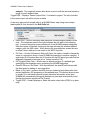
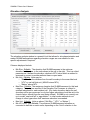
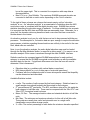
SLAMM 6.2 beta, User’s Manual
December 2012
PO Box 315
Waitsfield, VT 05673
(802)-496-3476
SLAMM 6.2 beta, User’s Manual
Contents
Acknowledgements..................................................................................................................... 1
Introduction ................................................................................................................................ 1
Opening Screen ........................................................................................................................... 2
Starting a New Project ................................................................................................................ 3
Expanded opening screen ........................................................................................................... 4
SLAMM File Setup ....................................................................................................................... 5
Edit Sites and Sub-sites ............................................................................................................... 7
SLAMM Execution Screen ......................................................................................................... 10
Run Sensitivity Analysis ........................................................................................................ 17
Set Map Attributes .................................................................................................................... 18
Elevation Analysis ..................................................................................................................... 22
3D Graphing .............................................................................................................................. 24
Profile Tool ................................................................................................................................ 27
Freshwater Flow Parameters .................................................................................................... 28
Salinity Analysis ......................................................................................................................... 29
Salinity Rules ............................................................................................................................. 30
SLAMM 6.2 beta User’s Manual
Acknowledgements
This document is maintained Warren Pinnacle Consulting, Inc. (Jonathan Clough, Amy
Polaczyk, and Marco Propato) and has undergone revision to include updates funded
by the United States Fish and Wildlife Service. The original version of this document
was prepared by Jonathan Clough and Evan Larson for Roger Fuller, a Landscape
Ecologist with The Nature Conservancy in Mount Vernon, WA. Many thanks for his help
in recognizing the need for such a document and assisting with the document
production.
Introduction
SLAMM 6 was a significant step forward with regards to graphical model interface.
Many features that had been hidden within the source code have been brought forward
into the graphical user interface (GUI) allowing for additional flexibility when operating
the model. The interface has also increased in complexity. SLAMM 6.2 has built on this
functionality by:
•
•
•
Increasing the degree of model flexibility accessible though the GUI
Addition of uncertainty and sensitivity modules
Conversion of the program to a 64-bit platform (A 32-bit version is also available)
This document is intended to help the user navigate the SLAMM 6.2 interface.
Please use the SLAMM-Forum to ask SLAMM interface questions as well as other
technical questions about the SLAMM Model. It is our goal for the forum to serve as a
knowledgebase for model users.
1
SLAMM 6.2 beta User’s Manual
Opening Screen
Figure 1: SLAMM 6.2 opening screen.
After opening the SLAMM 6 executable the user is presented with several options
(Figure 1):
•
Load Simulation – Loads existing SLAMM 6 projects.
•
Save Simulation -- Saves current project in SLAMM 6 binary format or text
format (see below)
•
Save As – Used to save the project under a different name or file-type.
•
New Simulation -- Starts a new SLAMM 6.2 project. Make sure to set up the
file structure in File Setup before Executing.
A SLAMM6 file is a binary file that contains all site parameters, file names and
directories, color choices, input and output site locations, model parameters, scenarios
chosen, and execution options. In other words all project data is saved here with the
exception of the required ASCII raster maps.
The project can also be saved into a text file format. Choose “Save As” and then
change the file-type to “*.txt”. Each line of the saved text file will labeled to clarify the
2
SLAMM 6.2 beta User’s Manual
format of the file. A complete technical specification for this file-type is not available at
this time but questions can be answered by examining the open source code or asking
questions on the SLAMM Forum.
An additional feature available within the text file format is the allowance of batch-mode
runs. To run the simulation automatically and then terminate the application on
completion the last line of the text file must be changed to "ExecuteImmediately: True".
If the text file is passed to the SLAMM executable as a parameter, the model will
execute and terminate. If, when loading a text file, SLAMM finds a line missing or
something out-of-place it will produce an error message describing exactly what the
problem is and on which line of the text file it occurred.
The file menu presents the user with the options noted above, as well as a list of
recently opened SLAMM 6 project files.
The help menu provides access to this Users Manual file as well as the “About”
SLAMM window. The “About” window displays the mode’s build number and also
provides buttons to link to the source code and information about SLAMM’s License.
SLAMM is open-source software and is licensed under the Common Public License
(CPL).
Starting a New Project
To start a project from scratch, click New Simulation. The next steps are to locate the
required site data layers, entering the site parameters and modifying the map attributes.
First, locate the data layers by clicking File Setup.
3
SLAMM 6.2 beta User’s Manual
Expanded opening screen
Figure 2: Expanded opening screen
Once a project is loaded the user is presented with a variety of options (Figure 2):
Execute (Alt-E)– Leads to the Simulation Execution screen.
File Setup (Alt-S)– Specify file locations and memory management options.
Leads to the File Setup screen.
• Site Parameters – Specify dates, accretion rates, etc. for each site and sub-site.
Leads to the Site Parameter screen.
• Elev. Statistics – This allows the user to examine elevation statistics and the
SLAMM conceptual elevation model for the given site without going through the
“Set Map Attributes” button. Until the statistical analysis has been run for the first
time, it is not possible to run an “elevation analysis” unless the user goes through
the “Set Map Attributes” interface. Leads to the Elevation Analysis screen.
• Set Map Attributes (Alt-M) – Set up maps of attributes and also examine initial
condition maps. Project maps are loaded prior to display of this screen. Input
sub-sites, output sites, and freshwater flow locations may be specified here.
Leads to the Map Attributes screen.
• For sites with specified freshwater flows there is an option to run a Salinity
Analysis and calibrate Freshwater Flow Parameters.
•
•
4
SLAMM 6.2 beta User’s Manual
SLAMM File Setup
This window allows the user to add ASCII raster GIS files to a project. All raster files
must have identical dimensions, projections, and locations.
•
•
•
•
DEM File (elevation) – Links the DEM GIS layer to the project. Required to run a
simulation. Units are meters above the vertical datum (usually NAVD88).
SLAMM Categories (NWI) – Links the wetland categories GIS layer to the
project. Required to run a simulation. Integers corresponding with SLAMM
categories. See the Technical Documentation for a complete list.
SLOPE File – Links the slope GIS layer to the project. Required to run a
simulation. Units are degrees.
Dike File – Links the dike/levee GIS layer to the project. Two types of dike files
may be used: a “classic” dike raster in which Cells marked with zero have no dike
but cells with integer values above zero are assumed to be protected by dikes or
levees until the land behind the dikes are 2 m below man seal level, and a dike
5
SLAMM 6.2 beta User’s Manual
location raster which specifies dike heights. See the Technical Documentation for
further information on these options.
In addition, Dike layers may be variable by year. To load a new dike file on a
particular year in which the model produces output, add another dike layer to the
project directory with the four digit year following the dike layer name. (For
example Base_dike.txt, Base_dike2025.txt, and Base_dike2050.txt.)
•
•
•
•
Pct. Impervious File – Links the percent impervious GIS layer to the project.
Units are integers from 0 to 100% impervious.
Raster Output Sites File – Optional. A “Raster Output Site” file is an integerbased raster file in which each cell is uniquely identified as being “in” or “out” of a
set of output summaries. This allows for all cells in a particular polygon (city or
county boundaries, for example) to be included in a set of maps and tables of
output. Cells outside of the raster layer should be identified with zeros. Multiple
raster output sites may be specified in a single input raster using sequentially
increasing integers (“1” for the first site, “2” for the second, etc.)
VDATUM File – Links an optional spatial representation of VDATUM elevation
corrections to the project. Raster contains conversions from the vertical datum
input to mean tide level as required by the model. If this raster is specified the
site or sub-site based “MTL minus NAVD88” correction factor is not utilized
(except for “no-data” regions within the raster file).
Uplift, Subsidence File – Links an optional spatially variable uplift/subsidence GIS
layer to the project. Allows land movement to be specified where data permits in
units of cm/year.
“Re-check Files’ Validity” – Verifies that the files are in a valid format with all the same
dimensions. Located below each file name are values NRows and NCols. The user will
be notified if the dimensions a GIS layer varies from the DEM dimensions (the
benchmark) or other error occurs.
Base Output File Name – Specifies the location to save CSV output files and GIS
outputs. CSV outputs will be the base output file name with CSV appended. GIS
outputs will include the site or sub-site name, the year, and the ascii file extension.
With 64-bit SLAMM, memory management is now less important than in the 32-bit
version. However, it may nonetheless be useful to track only a subset of cells for large
sites to save memory. The user has the ability to select which cells are analyzed during
the simulation. Once the cell tracking selection is made, pressing the Count button
reveals the number of cells that will be tracked and the corresponding amount of
memory that these cells will occupy.
•
•
Track All Cells – Tracks every cell in the GIS layers.
Do Not Track “Blank” – Tracks every cell except for cells that have “blank” NWI
value.
6
SLAMM 6.2 beta User’s Manual
•
Do not Track High Elevations and Open Water – Tracks every cell except those
with open water and those that are 8 meters and above (relative to MTL).
SLAMM memory management has improved in that available memory is no longer
required to be contiguous to be used by the software. This results in far fewer “out of
memory” errors. However, the 32-bit version of the software remains limited by its
memory manager (4GB is the upper-limit for memory utilization).
Edit Sites and Sub-sites
7
SLAMM 6.2 beta User’s Manual
Site parameters can be applied to an entire raster map. Alternatively, polygonal subsites can be created for areas within the raster that may contain unique parameters.
These parameters include
•
•
•
•
•
•
•
•
•
•
•
•
•
Description – Name of site or sub-site.
NWI Photo Date – Year that the National Wetland Inventory photo was taken.
This represents the starting date for the simulation.
DEM Date – Year of the flight or survey for the elevation data.
Direction Offshore – Direction of water from the shoreline. Multiple directions can
be parameterized using sub-sites. This is often used by the model to get a sense
of context for a particular cell (e.g. ‘is a cell adjacent to the open ocean?’ which
determines whether inundated dry land converts to ocean beach or marsh
wetlands.) This is also used for the elevation pre-processor, if relevant.
Historic Trend – The historic rate of sea level rise in mm/year. Used to estimate
subsidence or uplift unless a raster file of land movement is specified.
MTL minus NAVD88 – The elevation correction based on the mean tide level.
Variations of this correction across the site can be represented with sub-sites.
This is not used if a “VDATUM Raster” is specified in which case this correction
is made on a cell-by-cell basis.
GT Great Diurnal Tide Range – Equivalent to the difference between MHHW and
MLLW.
Salt Elevation – The elevation at which dry land and fresh water wetlands begin.
Often defined as the elevation that is inundated by salt water less than every 30
days.
Marsh/Swamp/Tidal Flat Erosion – Horizontal erosion rates for each land type.
Marsh/Swamp/Mangrove Accretion – Values of vertical accretion for each land
type. This may be overridden by the additional accretion models if specified, as
discussed below.
Beach Sedimentation Rate. Vertical accretion for tidal flats and beaches.
Frequency Overwash – Large storm frequency. Zero indicates no storms.
Use Elevation Pre-processor – Turns the elevation pre-processor on or off. The
elevation pre-processor is used for low-quality elevation data and assigns
wetland elevations on the basis of the wetland type, the direction offshore, and
the tide range for the site.
Overwash Parameters may also be specified to fine-tune the effects of large storms on
a site or sub-site basis.
•
•
•
Max Width Overwash (meters) –Determines the horizontal width that SLAMM
assumes is a barrier island or spit of land subject to overwash in the event of a
large storm.
Beach to Ocean Overwash (meters) – How much beach is horizontally
converted to open ocean in the event of a large storm.
Dryland to Beach Overwash – How much does the dry land to beach interface
migrate in the event of overwash.
8
SLAMM 6.2 beta User’s Manual
•
•
Estuary to Beach Overwash – How much of the open water behind the barrier
island is converted to beach in the event of overwash.
Marsh and Mangrove Percent Loss – What percentage of marsh and mangrove
is lost due to sand transport in the event of overwash.
Accretion Parameters. As specified in the Technical Documentation an alternative
accretion model is now incorporated in the model that allows for feedbacks between cell
elevation (as a surrogate for frequency of inundation), salinity, and distance to channel
and the rate of accretion for a given cell. Separate models can be specified for
“regularly flooded marsh,” “irregularly flooded marsh,” “tidal flats,” and “tidal-fresh
marsh.” For more information on these models see the Technical Documentation.
Also, the user may benefit from working with the “SLAMM6_Accretion” Excel file that is
included in the model’s installation directory. For each wetland type the following
optional accretion parameters may be specified:
•
•
•
•
•
•
•
•
•
•
Use Model (Boolean)—defines whether the variable accretion model is utilized or
whether constant accretion rates by wetland class are utilized.
Max Accretion Rate (mm/year)—the maximum accretion rate that can be
assigned by the model as a function of elevation.
Min Accretion Rate (mm/year)—the minimum accretion rate that can be
assigned.
Accretion Rate Coefficients, a (cubic), b (square), and c (linear), unitless. Define
the shape of the relationship between accretion and elevation.
Distance Effect Maximum (meters). Beyond this distance proximity to channel
has no additional effect
Minimum Distance Effect (unitless). Set to 1.0 if no relationship between
distance and accretion is desired.
Salinity Turbidity Maximum (ppt). Intermediate salinity level in which maximum
accretion occurs
Turbidity Maximum Zone (ppt). range of salinity over which there is some salinity
effect
“S” Non Turbidity Maximum (unitless). Accretion limitation factor in region where
there is no salinity effect.
Notes. A text string to document chosen model.
9
SLAMM 6.2 beta User’s Manual
SLAMM Execution Screen
SLR Scenarios to Run
• Scenarios and Estimates– A list of IPCC sea level rise scenarios to choose from.
See Technical Documentation for more detail. Each scenario that is selected
may be run for min, mean, or maximum within a single run.
• Fixed Rise by 2100 – A list of 3 heights of sea level reached by 2100. 1 meter of
eustatic SLR, 1.5 meters, or 2 meters of eustatic SLR by 2100. These scenarios
are generated by scaling up Scenario A1B-Maximum from the IPCC simulations.
See Technical Documentation for more detail.
• Custom SLR in meters by 2100. A user may specify a SLR by 2100. Year-byyear changes are estimated by scaling up (or down) Scenario A1B-Maximum
from the IPCC simulations.
10
SLAMM 6.2 beta User’s Manual
Protection Scenarios to Run
• Don’t Protect – All land is potentially vulnerable to SLR.
• Protect Developed Dry Land – All land is potentially vulnerable to SLR except
developed dry land which is not allowed to change.
• Protect All Dry Land – No dry land is vulnerable to inundation from SLR.
Run Model for NWI Photo Date (T0) – Includes the time step for the NWI date in the
model simulation. This tool can assist in model calibration by ensuring that the model is
accurately able to represent current conditions.
Time step (years) – indicates the number of years between model solutions (and output
of tables and maps). The first time step is variable so that the model can then step
through the specified time-steps size and end in the year 2100.
Last Year of Simulation – the end of the simulation. Currently capped at 2100 as nearly
all available estimates of SLR end on this date.
Run Model for Specific Years—the user may enter a time-series of years that the model
will then run through. The entry format is a list of years separated by commas. This is
very useful for hindcasting, for example, or if the user has a reason that outputs on
specific years is desirable. (Years run prior to 1990 will be subject to the “historical
SLR” specified and years run after 1990 will be subject to the SLR scenario selected for
the given model run.)
Data to Save
• Save Tabular Data Only – Saves tabular results from model runs, but not ASCII
raster outputs.
• Save Output for GIS – Saves both tabular results and the raster outputs from
model runs.
• GIS File Options – Provides options to list specific years for GIS output. New to
SLAMM 6, Rasters of Elevations (relative to MTL) and Salinity may be output.
.
11
SLAMM 6.2 beta User’s Manual
Display Maps on Screen
• Pause with Examination Tools – Pauses before model execution. Allows for
controlled progression of simulation and examination of maps and diagnostic
tools for each step of a scenario run. Often referred to as running the model in
“debug mode.”
• Automatically Paste Maps to Word – Outputs map results to new Microsoft Word
document created by SLAMM. The size of the raster (1x to 4x) may be specified.
• Save Maps to GIF Files – outputs GIF maps for each timestep
• Save Salinity Accretion Maps –outputs salinity and accretion maps to the same
Word document as wetland maps
• Additional Simplified Category Maps – outputs maps using simplified categories
to the same Word document as SLAMM category wetland maps (provided for
Ducks Unlimited)
No Maps (Quicker Execution) – With this option selected, simulation progress will not be
illustrated for the user and no maps output.
Include Dikes – Select this option if you have specified a dike raster layer and want to
include it in the simulation execution. Un-checking this option will result in a model run
assuming no dike protection is present.
Use Soil Saturation—Occasionally, the soil saturation algorithm is not desirable
because it causes streaks to appear on model outputs. This sub-model may be turned
off by unchecking this box.
No-Data Elevs Loaded as Blanks – When there is no-data in the digital elevation map
the default model behavior is to load these values as “blanks” as otherwise the model
may produce misleading output. This behavior may be modified here.
Use Connectivity Algorithm —Turns on or off the SLAMM connectivity sub-model. This
model determines whether dry lands or freshwater wetlands will be subject to saline
inundation based on an uninterrupted low-elevation pathway to estuarine or ocean
water. See the section on Connectivity in the SLAMM 6.2 Technical Documentation.
Use Bruun Rule for “Ocean Beach” Erosion – if checked, Ocean beach erosion is
modeled using a relationship reported by Bruun whereby recession is 100 times the
change in sea level. Otherwise the beach erosion rate is set to the value specified for
tidal flat erosion.
Execute – Runs the SLAMM simulation with the current configuration.
Save simulation – Saves current project configuration to the SLAMM6 file on disk.
Return to Main Menu – returns to the opening screen saving any changes made.
12
SLAMM 6.2 beta User’s Manual
Uncertainty and Sensitivity analysis options are discussed below.
Run Latin-Hypercube Analysis
SLAMM now includes a Monte-Carlo uncertainty analysis module to provide likelihood
and confidence statistics of the results as a function of input uncertainties and errors. A
user may specify uncertainty distributions for almost all input variables, included the rate
of sea level rise by 2100. Changes in most parameters are specified using "multipliers"
of existing parameter values.
Users may select the number of iterations run and specify the use of a random or nonrandom seed. By running uncertainty analyses with a non-random seed, the random
sequence of random numbers generated will be reproducible.
Clicking the Add Distribution button first provides a list of variables that can be
represented as distributions.
13
SLAMM 6.2 beta User’s Manual
Selecting one distribution presents the “Distribution Information” screen. In this screen
the user specifies the input parameter distribution and the mean and standard deviation
of the multiplier used to represent the uncertainty around a parameter. In most cases,
this distribution should be centered around 1.0 or the most-likely point estimate. In the
current model version, one multiplier is used for the same parameter for all subsites in
the simulation.
The graph can be shown as either a probability or a cumulative distribution.
14
SLAMM 6.2 beta User’s Manual
15
SLAMM 6.2 beta User’s Manual
Uncertainty in the elevation layer is represented using a spatially-autocorrelated map.
Adding spatial autocorrelation to the elevation errors accounts for likely spatial
clustering of measurement error (Hunter and Goodchild 1997).
An example of a spatially autocorrelated map is drawn in a red-to-blue gradient using
the “Spatial A.C.” parameter selected. You may mouse over the map to see the vertical
error estimate in a given location. The “Spatial A.C.” parameter varies from zero (no
correlation) up to 0.25 (perfect correlation). A value of 0.25 is not possible as the entire
map cannot have perfect correlation, but values approaching 0.25 (e.g. 0.2495) will
result in strong spatial autocorrelation. When the model is run iteratively as part of an
uncertainty analysis, a similar map will be derived randomly for each iteration and
added to the DEM (or NAVD88 correction) map specified.
Hunter, G. J., and Goodchild, M. F. (1997). “Modeling the uncertainty of slope and
aspect estimates derived from spatial databases.” Geographical Analysis, 29(1),
35–49.
16
SLAMM 6.2 beta User’s Manual
Run Sensitivity Analysis
SLAMM 6.2 includes a built-in sensitivity analysis module, which may be used to
examine the sensitivity of multiple model outputs to multiple model input parameters.
The user first selects which model parameters to vary and specifies the percentage by
which to vary them. When executed, the model iteratively steps through each of the
parameters and varies them by a specified percent in the positive and negative direction
and saves model results in an Excel file.
17
SLAMM 6.2 beta User’s Manual
Set Map Attributes
This window includes many tools to define and examine model inputs and outputs and
is now organized in a tabbed ribbon format.
On the Edit Input or Output Subsites tab, the following options are available:
•
•
•
•
Input Sites – Input sites are polygonal areas used to modify model parameters
in a specific region.
o First Add an input site, then give it an identifying name.
o Click define boundary to define the location of the sub-site. Each click
on the map represents another point in the polygon. Double clicking or
right-mouse-button clicking will close the polygon.
o Show sub-site parameters – Enables user to change sub-site parameters
(ie. Dates, accretion, erosion, etc.). See sub-site parameters.
Output Sites – Output sites are used to create Word maps, raster, and tabular
results for a specific location within the study area.
o Click define boundary to draw the rectangular output-site. Clicking once
will define one corner of the rectangle. After moving the mouse, clicking
again will place the rectangle on the map.
Fresh Flows – Fresh-water flows may be defined that are required for the
salinity sub-model.
o First add a freshwater flow then define a boundary over which this freshwater flow has influence.
o Next, define the pathway of the river including the modeled origin of the
river and the mouth of the river (where it empties into the estuary and a
semi-circular flow pattern away from the mouth of the river is assumed to
start). Multiple line segments may be specified to define this pathway,
starting up river and moving downward towards the mouth of the river.
o Fresh water flow parameters may then be edited.
If the user wishes to define a freshwater-influenced area only, but not to run the
salinity model, select the “F.W. Extent only” checkbox. In this case, the path of
the river (origin/mouth) does not need to be defined. The salinity model will not
be executed for this portion of the map, but an alternative flow chart of habitat
switching will be utilized as discussed in the Technical Documentation.
18
SLAMM 6.2 beta User’s Manual
•
•
Zoom – Changes the dimensions of the output map on the screen. Note: this
change is not saved and reflected in the Word document output maps.
Show lines/Show All – Shows either the lines of the currently-selected object
only, or all of the objects with the currently selected object highlighted in yellow.
The user has access to elevation tools, 3D mapping, and profile tools on the Analysis
Tools tab:
•
Map type drop-down – SLAMM can display several types of maps.
o The default SLAMM map is a land-category map;
o An elevation map may be displayed (with a color gradient ranging
from -2.0 meters to 7.0 meters)
o If the optional salinity model is included, while running the model in
debug mode (“pause with examination tools”), once the salinity model
has been initialized, a salinity map may be displayed with color
gradients ranging from 0 to 30 ppt.
o The vertical accretion rate for various wetlands may also be
displayed with a color gradient ranging from 0 to 10 mm/year.
o Estimated subsidence rates in m/year
o MTL_NAVD88 correction can be viewed for QA/QC
o Cumulative Marsh and Beach Erosion while running the model in
debug mode
19
SLAMM 6.2 beta User’s Manual
o Simplified category maps may be displayed in which all SLAMM
categories are grouped into the “upland,” “freshwater non-tidal,” “open
water,” “low tidal,” “saltmarsh,” “transitional,” and “freshwater tidal”
categories.
o A Connectivity map may be derived which shows which cells have
clear pathways to open water and which low lying areas are not
connected to a saline source at the current time step.
Deriving a legend for any of these map types will provide useful information
about their meaning. In addition, see the SLAMM 6.2 Technical Documentation
for more information on SLAMM modules used to derive these maps.
•
•
•
•
•
Zoom – Changes the dimensions of the output map on the screen. Note: this
change is not saved or reflected in the Word document output maps.
Legend – Displays an editable legend of colors for SLAMM land categories.
Legends are also available for the accretion, connectivity, simplified category,
and salinity maps.
SLAMM tool drop-down menu
o Profile Tool – Displays a 2-dimensional cross section of a 1-Demensional
slice of the map. See Profile Tool.
o 3D Graphing –Displays a 3D representation of the area selected in the
map. See 3D Graphing.
o Cell Attributes – Displays attributes of whatever cell the cursor is hovering
over. Attributes include cell categories, elevations, accretion rates,
maximum fetch, salinity, slope, and uplift.
o Sub-site Attributes – Displays attributes of the sub-site the cursor is
currently hovering over including the name and a summary of the
parameters associated with that sub-site..
o Salinity Info -- Displays salinity information for a cell such as the river
kilometer, distance to channel, retention time, and the predicted salt
wedge height at MHHW. The first time-step must have occurred so that
the salinity model is initialized to see these outputs.
Show Dikes – Visually shows or hides the dike layer on the map. Dikes are
displayed in a yellow color.
Elevation Analysis – For areas that are not pre-processed, elevation analysis
displays statistics of elevation distribution across land types. See elevation
20
SLAMM 6.2 beta User’s Manual
analysis. This important screen also allows a user to edit the assumed elevation
range for each wetland class.
Toggle ROS – Displays “Raster Output Sites,” if included in project. The cells included
in the raster output site will be shown in white.
A user may also perform simple edits to a SLAMM Raster map using some simple
drawing and fill tools located in the Edit Cells tab:
•
•
•
•
•
•
Draw Cells – Used to manually draw particular SLAMM wetland classes on the
map. The dropdown menu to the right indicates the cell width of the drawing
pen. A second dropdown menu contains all of the SLAMM wetland categories.
After this option is checked, clicking on the map will draw the selected wetland
category onto the NWI raster. When leaving the map attributes screen the user
is asked if these edits are to be saved to the ASCII input file.
Fill Cells – Like the fill feature in Microsoft Paint, this option is used to change the
value of a contiguous chunk of one SLAMM land category to another category. If
eight-sided fill is checked then the fill function will also fill same-type cells that are
diagonally attached to the area (a.k.a. “bishop’s position” fill).
Fill Polygon Within Cells – Allows users to draw a polygon of a wetland type
specified by the dropdown menu containing the SLAMM categories.
Draw/Fill Dikes or “No Dikes”– With this selected, the draw/fill cell features edit
the dike raster by adding or removing dikes.
Blank to Dry Land – because the NWI does not code dry land, these cells often
remain blank after GIS processing of the wetland layer. This button allows a user
to quickly fill in the blank cells that contain elevation information as dry land.
SLAMM will automatically distinguish between dry land and developed dry land
through the percent impervious file (if used).
Toggle ROS – Visually displays or hides the raster output sites (ROS) for a given
map.
21
SLAMM 6.2 beta User’s Manual
Elevation Analysis
The elevation analysis window is a powerful tool that allows for site characterization and
makes SLAMM assumptions regarding elevation ranges are now editable for sitespecific adjustments if required.
Columns displayed include:
•
•
•
•
•
Min Elev.: Editable. The elevation that SLAMM assumes is the minimum
elevation for this class, in the units shown in the cell to the right. This is a critical
parameter as it defines the elevation, relative to MTL, below which a wetland is
assumed to convert to another wetland class or open water.
Min Unit: Editable. Units may be
o “Salt Elev.” or the distance from the salt boundary to the mean tide level
o “HTU” or one half-tide unit, (MHHW minus MTL).
o “Meters” above MTL.
Max Elev.: Editable. The maximum elevation that SLAMM assumes for this land
category. This only has an effect if the Elevation Pre Processor is utilized to
estimate elevations for each wetland cell. (Dry lands elevations below the salt
boundary will be pre-processed so dry land upper elevations should be set to the
lowest contour interval from the map being utilized.) SLAMM is not currently set
up to model “sea level fall” or aggradation. In other words wetlands do not
change to other types when their maximum elevation is exceeded.
Max Unit: Editable. Units as above (“Salt Elev.,” “HTU,” or “Meters.”)
Min HTU or m: Non Editable: The minimum SLAMM-assumed elevation as
converted to half-tide or metric units, depending on the “Units” selection in the
22
SLAMM 6.2 beta User’s Manual
•
box at the upper right. This is converted for comparison with map data as
discussed below.
Max HTU or m: Non Editable: The maximum SLAMM-assumed elevation as
converted to half-tide or metric units, depending on the “Units” selection.
To the right of these columns are columns that remain empty until an “elevation
analysis” is run. An “elevation analysis” is an examination of statistics when the NWI
cover-class raster is combined with the digital elevation map. SLAMM then returns
statistics describing the elevation range of wetlands. For these statistics to be accurate
it is important that the NWI date and DEM date are reasonably close. Otherwise, for a
given cell, the elevation data may describe a land cover class that has converted to
another class in the interim.
An elevation analysis is only run for cells that are not set to be processed with the preprocessor. The assumption is, if elevation data are poor enough to require the elevation
pre-processor, statistics regarding those elevations are unlikely to be useful to the user.
Also, diked cells are excluded.
Note, to run the elevation analysis, the entire digital elevation map must be loaded
through the Set Map Attributes button (or execute in debug mode.) You cannot run an
elevation analysis if this screen is accessed through the main SLAMM interface.
Statistics can then be compared against SLAMM assumptions for each wetland
category to ensure that the SLAMM conceptual model matches up with the available
elevation data for the site. If significant differences exist then the user will need to
determine if this is because of
•
•
•
Elevation data (e.g. problems with vertical datum corrections)
NWI data problems (e.g. out-of-date map or horizontal inaccuracy)
Problems with the conceptual model for some site-specific reason that hopefully
can be determined and described.
Available Statistics include:
•
•
•
•
•
n cells: The number of cells covered by that land category. Statistics based on
small sample sizes should probably be discounted to some degree.
5th percentile and 95th percentile: The 90% confidence interval for this particular
land category in half-tide units. These can be compared with the “Min HTU” and
“Max HTU” conceptual model columns.
Mean, St. Dev.: The average elevation value and standard deviation in half tide
units.
Min, Max: The minimum and maximum elevation for this cell in half-tide units.
These data are usually less useful as horizontal error in a single cell’s
classification can produce strange results.
% < Min: The current percentage of cells below the minimum elevation specified.
23
SLAMM 6.2 beta User’s Manual
Note: Double clicking on any column header will sort the entire table in ascending or
descending order.
The Units dropdown box at the top of the window allows a user to convert the elevation
analysis into units of “half-tide units” or HTU or meters. Using meters is usually more
useful for microtidal systems. The Zero dropdown box at the top of the window allows a
user to convert the vertical datum used for the elevation analysis.
Using the buttons at the bottom of this screen a user can export these data to SLAMM
or examine histograms of frequency vs. elevation for selected wetland types, as shown
below.
3D Graphing
This feature of SLAMM 6 has been completely retooled from previous versions. Users
can still view and navigate a selection of land but, as with the profile tool, each node is
now passed a land-cover value as well as an elevation value. OpenGL rendering is
used to produce useful maps that really help a user to understand the relationship
between elevation, slope, and cover class.
To use this feature, the user’s computer and graphics card must be capable of
rendering OpenGL images (the vast majority of modern computers are…) Otherwise the
software will exit with an error message. (Graceful error trapping is not yet possible
given the open-source OpenGL toolbox that we are currently working with.)
To use, select the 3D graphing tool from the drop-down box and then draw a rectangle
on the SLAMM map.
24
SLAMM 6.2 beta User’s Manual
With the area selected, a new window appears.
25
SLAMM 6.2 beta User’s Manual
3D Features:
• Navigation – The up arrow keys zooms in and the down arrow zooms out. The
left and right arrow keys slide the vantage point to the left and right. Changes to
camera orientation can be made by pressing the left mouse button and moving
the mouse.
• Toggle Wireframe – Provides a 3D view in wireframe mode as opposed to
opaque polygons. This view is usually better for revealing elevation distinctions.
• Tide range slider – Draws water at the salt boundary, mean higher high water,
mean tide level, or mean lower low water. This can be used to examine the
elevations of tides against land-cover classifications.
• Z-axis Resize – Magnifies elevation values. This is particularly useful when
viewing areas with low vertical relief.
• Speed – Changes the navigation speed.
26
SLAMM 6.2 beta User’s Manual
Profile Tool
This feature enables the user to view either a vertical or horizontal “slice” of a segment
of land.
Cell elevations are presented in meters above mean tide level, and each cell color
corresponds to its NWI value in the SLAMM raster. Clicking on a cell in the profile
window will reveal its elevation.
27
SLAMM 6.2 beta User’s Manual
Freshwater Flow Parameters
For each freshwater flow specified, a characterization of river flow, salinity, and other
physical characteristics must be entered.
Within areas that have defined freshwater flows, swamp can be predicted to convert to
tidal swamp on the basis of elevation. This is the purpose of the “Tidal Swamp Max
Elev.” parameter. When swamp falls below this elevation it will become tidal swamp.
Fresh water salinity may also be specified though it often is assumed to be 0 ppt.
A time-varying turbidity factor may be specified. If the turbidity factor is not utilized or is
set to 1.0 then accretion inputs are not modified. Otherwise calculated accretion rates
are multiplied by the specified turbidity factor within this area of freshwater influence.
28
SLAMM 6.2 beta User’s Manual
This experimental factor may be used to investigate potential impacts of changes in
turbidity on wetland fate.
A time-varying freshwater flow may be specified which affects salinity calculations.
Additionally the slope of the salt wedge may be specified. This is a calibration
parameter which affects the depth at which fresh water and salt water meet. The depth
of the salt-wedge is back-calculated from the farthest extent of fresh water influence as
a function of river-mile and the tide range.
The origin of the salt wedge may also be specified as a function of “river km” calculated
with kilometers increasing when moving from the defined origin to the mouth of the river.
If this parameter is not specified, the origin is set to the most oceanic defined extent of
fresh water influence. The calculated river km for each defined estuary may be viewed
using the following procedure:
•
•
•
•
Execute the model, select “pause with examination tools.”
Select the “next step” button until the salinity initial condition has been calculated.
Select the salinity tools from the analysis tools and hover the mouse over a
portion of the map.
The RiverKM for the cell is now displayed along with other descriptive statistics
describing the geometry of the salt wedge.
Salinity Analysis
Similar to an elevation analysis, a Salinity Analysis displays statistics about predicted
salinities as a function of land-cover type.
29
SLAMM 6.2 beta User’s Manual
The salinity matrix is not editable and includes the 5th and 95th percentile and mean
salinities for a given wetland type at low tide (MLLW), mean tide (MTL) and high tide
(MHHW), and the salt elevation, usually defined as the 30-day flood tide (30D).
Like the elevation analysis, a graphic histogram of salinities by land-cover may be
produced. This is quite useful for understanding the relationship between salinities and
wetland types. These relationships can then be used to specify a set of Salinity Rules
that affect model behavior.
Salinity Rules
The salinity model provides for disambiguation between wetland types when their
elevation ranges overlap. In this case, salinity may be used to define when one
30
SLAMM 6.2 beta User’s Manual
category is predicted to change to the next. The user may define as many salinity rules
as may be useful for their particular model run.
In the example below, tidal swamp is predicted to convert to tidal-fresh marsh when the
salinity exceeds 5 ppt at flood tide.
The model will first make any changes in wetland classes as a function of elevation and
tidal range and will then make changes on the basis of salinity, if warranted.
31