1
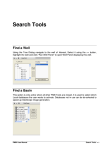
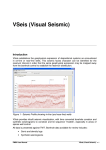
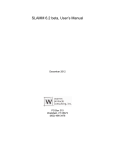
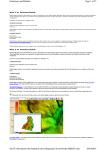
Well Panel
Introduction
Individual wells can be selected for review as they are presented on each of the
environmental facies distribution maps or selected from the database. Each borehole
can be studied in isolation, or in context with other wells as a multi-well correlation
panel. Borehole data can be viewed in measured depth, or against millions of years
(Ma), or as a single well burial reconstruction or well correlation burial reconstruction
through the use of rock type specific porosity loss curves.
WellPanel operates such that every depth reference point, whether it is a lithology
break, a wireline log data point or a stratigraphic top or base pick is assigned both an
MD value and an Ma (age) value. This is to facilitate the construction of some of the
displays possible in WellPanel that are not evident in other routine borehole viewers or
well databases.
In particular the age referencing of these data enable the burial history, Wheeler and
profile reconstruction views. In order to reconcile some of this detail it is important to
consider the paleo bathymetric changes through time, which are derived from the
depositional facies interpreted from the borehole evidence. Borehole models are
themselves tested through spatial environmental facies distribution mapping which is
constrained by the seismic facies evidence. Thus the borehole models presented are
studied in context with all the available evidence and in a truly integrated fashion.
Features and Functionality
The following screen will be displayed on launching Well Panel with a default suite of
columns (These can be changed in the “Options” menu [10])
FMB User Manual
Well Panel • 1
Figure 1 - Well Panel Display and Options
1.
Wells and Well Group list (for X-sections).
2.
Toggle Wells/Well Group list on/off with this selector bar.
3.
Create a new well group for correlation. Opens New Well Group Wizard.
4.
Edit an existing well group. Opens Edit Well Group Wizard.
5.
Delete a well group. N.B. the wells themselves are not deleted – only the well
group list.
6.
Line function: For displaying correlation lines. Options are for floating line tied to
the mouse pointer (Correlation ruler), or fixed lines on selected stratigraphic
boundaries (such as stages, sequences etc.).
7.
Select and activate links: This pointer will select/activate links such as Maps etc. It
is also used for picking/altering tops.
8.
Reset the display: Either display the whole well or the active interval. The active
interval is set in “Options”.
9.
Reload the well from the database.
10. Open the Options dialog for changing
The following options can be changed:
the
display
of
the
data.
a)
Visible columns. Add or remove columns displayed, and alter the display
properties of the visible columns.
b)
Active interval. Select the Top and Base sequence for your display (or use
Top & Base to display entire well / well X-section).
FMB User Manual
Well Panel • 2
c)
Schemes: Select the Timescale, Chrono-stratigraphy, Litho-stratigraphy and
Sequence stratigraphy schemes (an alternative sequence stratigraphic
scheme for comparison purposes can also be selected). Also select the Burial
Sequence level, Sea level curve, and Sub basin.
d)
Desktop: Change colour scheme, units, and other display parameters.
e)
Wireline Logs: Select the display parameters of the logs displayed.
f)
Lithology and cement keys: Define the display parameters of lithology and
cements.
11. Sea Level: Use this function to change the sea level curve used and to add further
sea level curves (*.sl).
12. Print: Print the current screen to your default printer, or to a PDF writer if you have
one installed.
Tabs
Please note: Well Tab and Burial History Tabs pertain to the last single well opened.
Animation, Depth View, and Age View Tabs pertain to the last X-Section opened (or to
the Demo_Section, if the user has not created additional X-Section/s).
•
Stratigraphy: Provides a reference stratigraphic scheme for the sub-basin. The
appropriate sub-basin for the well/s you are working with needs to be selected from
Options > Schemes. Selecting a map from the map column will open this map in
GeoScope. The sub-basins which have lithostratigraphic schemes defined in the
FMB2 are listed in Appendix I.
•
Depth View: Displays the default X-Section in depth view mode.
•
Age View: Displays the default X-Section in age view mode against the basin
stratigraphic scheme. (See Section on Age View below for further detail).
•
Animation: Displays a burial history animation for the current X-Section. The size of
the animation steps (million years) can be selected in the list box.
•
Well: Displays the default well panel
•
Burial History: Displays the burial history graphic for the current well. (See Section
on Burial History below for further detail).
•
Well Data: A spreadsheet style display of the complete suite of data for the current
well. Select the data type using the list box. The following are available:
- Chrono- Litho- Sequence- Stratigraphy
- Lithology, Cement, Modifiers
- Environments, Facies, Bathymetry
- Wireline logs
- Core and casing details
Note: the export function copies the data viewed to the clipboard. It can then be
imported into Excel or an alternative application.
FMB User Manual
Well Panel • 3
•
Stratigraphic Data. Displays basin level stratigraphic data in a spreadsheet format.
Note: the export function copies the data viewed to the clipboard. It can then be
imported into Excel or an alternative application.
•
Graphic. This tab is auto-selected when the user selects a graphic such as a
depositional environment block diagram from Well Panel.
All interpreted well data can be reviewed within Well Panel. We encourage clients to
export the well data for use in their mainstream interpretation tools. (The Export
functionality of the FMB is detailed in the Query Tool user guide). WellPanel presents
the following value added data items for all wells:
Stratigraphic Picks
Chrono-, litho- and sequence stratigraphy. The stratigraphy is normalized to use
consistent nomenclature across regions. The sequence stratigraphic record is
complete to include eroded and condensed sequences referenced in the database
at the depth of the associated unconformity or condensed surface. In the case of
eroded packages, no estimate is provided for the amount or nature of the missing
section. Sequence stratigraphic interpretation (using tectono-eustatic sea level
changes as a guide) is the prime age control for the FMB. Chronostratigraphy is
then based on the sequence stratigraphy, with further stage breakdown based on
biostratigraphy. Lithostratigraphy from completion logs is rationalized and unified to
reflect the regional rather than the local structural picture.
Petrophysical Logs
GR, DT, NPHI, RHOB, DRHO, CAL, ILD, SP
This is the default suite of petrophysical curves provided with each FMB. They are
considered to be the essential ‘geological’ logs routinely used for well correlation
exercises and for depositional systems modeling. The digital data is prepared
(depth matched, spliced and corrected) by our in-house petrophysical team who
compile the data in accordance with a stated HQLD (High Quality Log Data)
standard.
Rock Type
Lithology, Cements and Modifers. There are three components of the borehole wall
rock type that are interpreted from a sedimentological perspective. Data available
for review during this exercise include cuttings descriptions, mud logs,
conventional core descriptions, sidewall core descriptions, typically a
lithostratigraphic framework and the wirleline log suite referenced above. The
Lithology is a continual zonation of the drilled succession to classify the subsurface
according to primary rock type, such as sandstone or siltstone. The cement
zonation is an intermittent zonation throughout the borehole section to recognize
discrete intervals of the subsurface that are heavily indurated through extensive
cementation. The final occurrence that is recorded is that of accessory minerals
and modifiers we are able to recognize from cuttings descriptions. These are
included where they are considered to be indicative of an environment of
deposition, or may affect the typical petrophysical log response otherwise
anticipated over the interval.
FMB User Manual
Well Panel • 4
Main Environment of Deposition (GDE)
This is a continual zonation of each borehole from TD to (typically) Top Eocene to
record the changes to the environment of deposition as indicated by the rock type
character of any succession, and the position at the time of deposition on the paleo
alluvial plain, shelf, slope or basin. The FMB classification scheme for Main
Environments of deposition is presented in Appendix II.
Depositional Facies Association (DFA)
This is a continual zonation of each borehole from TD to (typically) Top Eocene to
record the changes to depositional mechanism responsible for depositing any
succession in the context of the established Main Environment. The FMB
classification scheme for Depositional Facies Associations is presented in
Appendix III. The GDE and DFA reflect/respond to accommodation space,
sediment type and supply and local topography and have obvious numerically
linked implications for paleobathymetry. An important part of the model is validation
of this environmental history using geohistory models and seismic data,
accomplished using inbuilt tools described below.
Palaeobathymetric Ranges
Keyed to the Depositional Facies Association we recognize from modern
analogues that depositional mechanisms operate within observable bathymetric
ranges. We apply these ranges to the facies associations interpreted for the
preserved section to establish a record of the likely bathymetric range for the
accommodation space in the basin.
Core and Casing
Well Panel also presents Cored Interval and Casing Point details for each well as
recorded in the FMS database. This represents one of the core features of FMB2
as it provides access to the primary data licensed by clients, namely the
interpreted well data. Core images are currently being processed and will be
available for review via Offsite Online (Well Audit), in due course.
Launching Well Panel from GeoScope
To select a well/s from the GeoScope map first make the Penetrating Well theme the
active layer by highlighting this theme (see Map Themes panel), then use a left mouse
click or click>hold>drag for a group selection. In the case of the latter method all the
wells that fall within the area you have selected are shown in a select list. Choose from
this list by a double click on the desired well or use the list to create a new well crosssection.
On opening Well Panel from a map the display should present the equivalent
stratigraphic interval in the borehole to that of the map displayed in GeoScope. To view
a more extensive section of the well adjust the stratigraphic interval of interest by using
selecting Active Interval tab in the Options dialog.
Launching Well Panel from the Tool Palette will present the well and stratigraphic
interval of interest as displayed in the last user session.
FMB User Manual
Well Panel • 5
Well Panel can also be launched from the “Find a Well”, and “Find a Stratigraphic Pick”
Tools (as described in the “Search Tools” User Manual).
Creating a Cross-Section
Select your wells (use a maximum of 10) from GeoScope (as described above, see also
GeoScope manual) or directly from the Well list. For the latter method open the Well
Group Wizard, assign your well group a unique name, select the desired wells, modify
the well order, then save your group by selecting “Finish”.
Figure 2 - 5-Well X-Section (Depth View)
Within the Options > Active Interval, the user can select whether the wells should be
displayed from a common hanging layer, or independently from the top of each well. The
wells can also be displayed with equal or independet scaling.
Age-View
Integration of time (Ma) into the data model allows instant representation of the
interpretation as a geohistory reconstruction (van Hinte, 1976). When paleowaterdepth
implications of the facies model are included, structural and tectonic events that are not
apparent in a burial depth diagram become immediately obvious as shown in Figure 3,
below. Tectonic events are clearly resolvable as dislocations on the TD subsidence path
in the geohistory plot. Paleowaterdepth is dynamically interpolated into the
paleowaterdepth constraints (boxes) provided by the depositional environment
interpretation.
FMB User Manual
Well Panel • 6
Figure 3 Geohistory diagram with and without (burial history) paleowaterdepth using
FMB2's WellPanel.
Burial History
Such considerations also apply to simplistic reconstruction of a borehole cross-section in
geologic time. Oil and gas migration pathway models are very sensitive to
paleowaterdepth in the sense that it alters the paleostructural configuration. In Figure 4,
up dip migration at base Tertiary is realised only with paleowaterdepth taken into the
model. The upper figure shows a reconstruction without paleowaterdepth. The figure at
bottom left has waterdepth included, dramatically changing the paleostructural
interpretation at base Tertiary level.
FMB User Manual
Well Panel • 7
Figure 4 - Palinspastic reconstructions at 3 Ma for the cross-section in Figure 2,
extracted from geohistory models for each well.
A linked age interpretation allows the transformation of all borehole data into a geologic
time domain. This is accomplished on the fly, allowing rapid production of pseudoWheeler diagrams of wellbore cross-sections, as shown below, Figure 5 . Model
calibration through a '
pseudo Wheeler'diagram thus enhances a review of depositional
episodes and tectonic/eustatic gaps, allowing identification of correlations not otherwise
obvious. The relevance of the sealevel curve now becomes apparent.
FMB User Manual
Well Panel • 8
Figure 5 - Pseudo-Wheeler Diagram, and detail.
Using Well Panel as an Interpretation Tool
(At present this only applies to TGS Geological Products and Services Personnel. Any
data changes made by clients will be lost when the client next updates their FMB).
To make a well editable it first has to be “locked” by clicking the Padlock icon (
)with
the left mouse button. This prevents other users attempting to edit the well
simultaneously. If you close Well Panel or select a different well, this well will be
unlocked. Turn on The Correlation Ruler/Lines function (see above) to assist in
identifying the various zone boundaries.
Once locked the user can edit the following data types:
•
Chronostratigraphy
•
Lithostratigraphy
•
Lithology (and Cements and Modifiers)
•
Environments and Facies
•
Sequence Stratigraphy
The normal workflow for interpretation is:
1. Lithology (normally imported from AceLith)
2. Sequence Stratigraphy
3. Environments and Facies
4. Lithostratigraphy
5. Chronostratigraphy
A. To add a new zone:
FMB User Manual
Well Panel • 9
1. Right mouse click in the appropriate place on the relevant column to display the
Add/Edit/Delete dialog
Figure 6 - Add/Edit/Delete Zone Dialog
2. Check the “Insert New Zone” box.
3. Select whether the zone is to be added above or below the current zone.
4. The dialog will display the zones that are available for insertion at this point. If the
required zone is displayed here, select “OK”, if not select “All Options” to reveal a
full list of all zones that are selectable. Caution should be exercised when using
this option to ensure the user is selecting a valid zone for the position. For
sequence stratigraphy, if the sequence to be inserted is a ranged (hyphenated)
sequence, this can be inserted by checking the “Base Seq X Ord” (where X is the
Order number), and selecting the Base sequence from the list displayed.
5. Click OK
B. To delete a zone:
1. Right mouse click in the appropriate place on the relevant column to display the
Add/Edit/Delete dialog.
2. Select Delete
3. Select whether the deleted zone is to be left blank, or if the top of the underlying
zone should be moved up, or if the base of the overlying zone should be moved
down to close the gap.
4. Click OK
C. To change the name of a zone:
1. Right mouse click in the appropriate place on the relevant column to display the
Add/Edit/Delete dialog.
2. Select Change Name
3. Select the new zone name.
4. Click OK
D. To move a zone boundary:
1. Left click and drag the relevant boundary up or down.
FMB User Manual
Well Panel • 10
2. The move zone boundary dialog will be displayed
Figure 7 - Move zone boundary dialog
3. In the “Move” window select whether you want to move both of the adjoining
zones or just one of them
4. The depth to which you dragged the boundary will be displayed in the “To”
window. You can type a new depth here, or select whether the boundary should
be moved to align with another existing boundary depth using the “Snap to”
function.
5. Click OK
Note: For all editing/adding/deleting operations, remember to select “Save” from the
main Toolbar periodically.
FMB User Manual
Well Panel • 11