1
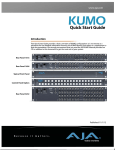
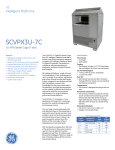
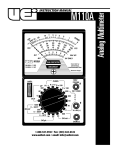
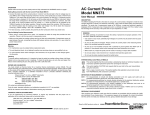
Installation and
Operation Manual
53 St-Germain Ouest, Rimouski, Quebec, Canada, G5L 4B4
Tel: 418-727-5753, Fax: 418-725-3554,
[email protected], www.opdaq.com
Table of Contents
1.
System Overview .................................................................................................. 1
3.
Scope of Delivery .................................................................................................. 3
4.
Options ................................................................................................................................. 4
4.1 GPS ........................................................................................................................ 4
4.2 Analog Sensors .................................................................................................... 4
4.3 Torquetrak Revolution Channel ........................................................................ 5
4.4 Power Meter ........................................................................................................ 5
4.5 Expansion Module ............................................................................................... 5
5.
Software Installation Procedure ........................................................................ 6
5.1 System Requirements ......................................................................................... 6
5.2 Installation ........................................................................................................... 6
6.
Hardware Installation Procedure...................................................................... 8
7.
FieldTest Software Operations ......................................................................... 11
7.1 Setup ................................................................................................................... 12
7.2 Timed Acquisition ............................................................................................. 13
7.3 High Frequency Acquisition ............................................................................. 15
7.4 Analysis .............................................................................................................. 16
7.4.1
Load ........................................................................................................... 17
7.4.2
Export ........................................................................................................ 17
7.4.3
Report ........................................................................................................ 18
8.
Graphical Tools .................................................................................................. 19
8.1 Graph Palette ..................................................................................................... 19
8.2 Scale Adjustment ............................................................................................... 20
9.
Technical Support .............................................................................................. 21
1.
System Overview
The FieldTest System is built to work in conjunction with Binsfeld Engineering’s
Torquetrak 10K and Torquetrak Revolution measurement instruments. The acquisition
module is capable of monitoring up to four engines for continuous or temporary
measurement.
The FieldTest is a specialized data acquisition system specifically designed for
processing, recording, displaying and analysing torque and RPM. Other than torque and
RPM, the acquisition module can also integrate a series of other instruments (optional)
using analog input (4-20 mA) for example: pressure, temperature, humidity and wind
speed. For maritime use and sea trial, an RS-232 GPS connexion (optional) is also
available.
1
© OpDAQ Systems 2011
The following figure presents different FieldTest configuration possibilities.
2
© OpDAQ Systems 2011
3.
Scope of Delivery
Acquisition Module
The Acquisition Module is the center part of the FieldTest System. It converts the signal
received from the torque meter and the RPM Pick-up sensors. As an option, the
Acquisition Module can also integrate up to four Analog Sensors, an Electrical Power
Meter, and a GPS signal.
USB Cable
The USB Cable is used to transfer information from the Acquisition Module to the
computer where the FieldTest Software has been installed to display data on a graph.
RPM Pickup Cable
A 30 foot RPM Pickup Cable is included with the FieldTest. One end of the cable (pickup)
has to be mounted on the adjustable Magnetic Base (included in the package). The
other end needs to be plugged into the Acquisition Module.
Magnetic base
The Magnetic Base is used to fix the RPM Pickup and then placed close to the shaft for
RPM measurement.
Magnets
A set of powerful Magnets are part of the package. Magnets are placed on the rotating
shaft so the Magnetic Pickup sensors can read the shaft speed.
12 VDC Splitter
The 12 VDC Splitter is used to power the Binsfeld RX10K receiver and the FieldTest
Acquisition Module. One branch of the 12 VDC Splitter is to be plugged into the
Torquetrak RX10K Receiver. The second branch has to be plugged into the FieldTest
Acquisition Module. The other end of the Splitter is used to receive power using a 110220VAC/12VDC wall plug transformer from the Binsfeld system.
Serial Cable
The 6ft Grey Serial Cable is used to transfer signals from the Torquetrak RX10K Receiver
to the FieldTest Acquisition Module.
3
© OpDAQ Systems 2011
FieldTest Software
The FieldTest Software has to be installed on a PC / Laptop (not included) running on
Windows XP or Windows 7. The software allows a simple and straight forward data
display from the Torquetrak series and all other instruments that have been integrated
to the Acquisition Module.
Op-Torq FieldTest Installation and Operational Manual
The Op-Torq FieldTest Installation and operational manual only provides information
about the Acquisition Module and the analysis software. For information concerning
Torquetrak 10K and Torquetrak Revolution please refer to their respective Binsfeld
Engineering User Manuals.
4. Options
4.1
GPS
For Transportation application, The FieldTest System allows GPS connection in order to
get speed over ground or ship speed. With the GPS option, a GPS receiver is included
with the system.
4.2
Analog Sensors
In order to record environmental factors or other needed information during the
monitoring process, a series of analog instruments can be integrated into the FieldTest
such as: relative humidity, temperature, anemometer and pressure. For integration into
the Acquisition Module, the selected instruments must communicate using a 4-20mA
signal.
NOTE: Choosing Analog Sensor options only provides communication channel
integration into the Acquisition Module and does not include the instruments.
4
© OpDAQ Systems 2011
4.3
Torquetrak Revolution Channel
The FieldTest Acquisition Module can also integrate a Torquetrak Revolution instrument
in order to monitor torque, power and RPM over a long period of time. Long term
acquisition is not possible with torque meter TT10K because it is battery operated.
NOTE: When ordering FieldTest with Torquetrak Revolution channel(s), scope of delivery
does not include: RPM Pickup Cable, Magnetic base, Magnets or serial cable.
4.4
Power Meter
In order to integrate electrical power and power factor monitoring, a Power Meter
channel can also be integrated into the Acquisition Module. With the current option, the
power meter is included with the system.
NOTE: For more information and specification on the Power meter please see the online
PDF brochure link.
http://www.powermeterstore.com/crm_uploads/acuvim-ii-series-brochure_1.pdf
4.5
Expansion Module
The Expansion Module consists of a second Acquisition Module in order to monitor
more than two engine(s) / genset(s) to a maximum of four. It allows the integration of
two extra Torque meters and RPM Pickup.
5
© OpDAQ Systems 2011
5.
Software Installation Procedure
The current section specifies computer requirements and the installation procedure of
the FieldTest Software.
5.1
System Requirements
The FieldTest Software must be installed on a PC or Laptop that uses a Microsoft
Windows operating system (Windows XP or Windows 7). This software is optimized for
1024 x 768 screen resolution.
5.2
Installation
Insert the FieldTest Software CD into the disc drive of the PC or Laptop.
a) Run the setup.exe program from the FieldTest installer folder on the disc. The
following window will appear:
NOTE: At any time during installation you can press CANCEL and the system will remove
all currently installed files of the software and stop the installation.
6
© OpDAQ Systems 2011
b) Once the Initialization is completed, the following destination directory window will
appear; keep the default folder or choose the destination folder and click NEXT.
c) The following license agreement window will appear, to continue the setup; it is
required to ACCEPT the terms.
d) Once the Licence Agreement is accepted, the Start Installation window will appear;
click NEXT to begin the installation on the computer.
e) Once the installation is completed, click FINISH. The software is now ready to run on
the computer. A shortcut has been created in the Start Menu.
7
© OpDAQ Systems 2011
6.
Hardware Installation Procedure
After successfully completing the FieldTest Software and driver installation, you can
begin the hardware installation as follows.
NOTE: When ordering FieldTest with the Torquetrak Revolution channel, skip
installation procedure steps B, C, D, E and F
A. Install the torque meter as explained in Binsfeld User’s Guide provided with the
instruments.
NOTE: Do not power up the instruments at this point.
B. According to the following table, install Magnet(s) on the shaft(s) for RPM
measurement. Secure the Magnets on the shaft using fibre tape supplied with the
torque meter instrument.
Recommended numbers of magnets in function of RPM and shaft diameter
shaft diameter
Maximum RPM
0 - 1000
1000 - 2000
2000 - 4000
Under 6''
(< 152 mm)
2
1
1
Over 6''
(> 152 mm)
4
2
1
NOTE: The Magnets have to be equally spaced to ensure the reliability of the
measurement.
8
© OpDAQ Systems 2011
C. Install the RPM Pickup on the Magnetic Base. See the diagram below for reference.
D. Position the Magnetic Base, with the RPM Pickup on it, in line with the Magnet(s)
perpendicularly to the shaft, as shown in diagram below. The gap between the
inductive pick up and the permanent Magnet(s) needs to be around 0.75 inches (19
mm).
E. Connect the RPM Pickup into the Acquisition Module.
F. Connect the Serial Cable between the Torquetrak RX10K Receiver and the
Acquisition Module.
G. Connect one of the four branches of the 12VDC Splitter into the Torquetrak RX10K.
Connect one of the three remaining branches of the 12VDC Splitter into the
Acquisition Module.
H. Connect the wall plug transformer from the Binsfeld system into the other end of
the 12VDC Splitter.
NOTE: Do not power up the instruments at this point.
I. Connect the USB Cable from the Acquisition Module to the PC / Laptop.
J. Start the FieldTest Software on the computer. See chapter 5 for the Software
installation procedure.
9
© OpDAQ Systems 2011
K. Power up the instrument(s).
NOTE: If the instrument(s) is powered up prior to connecting the USB cable from the
Acquisition Module to the PC / Laptop, Windows may detect it as a serial mouse. In
this event, unplug the USB Cable from the USB port on the PC / Laptop. Power off
the instruments and plug the USB Cable to the USB port. Wait five seconds then,
power the torque meter back up. If the instruments are not detected automatically
by the FieldTest Software, refer to chapter 7.1.2 COMMUNICATION STATUS.
L. Setup the FieldTest Software according to the instrument configuration and
calibration, see chapter 7.1 SETUP.
10
© OpDAQ Systems 2011
7.
FieldTest Software Operations
Before starting the FieldTest Software, make sure that your USB Cable is connected to
the Acquisition Module and the PC / Laptop. Correct signal communication results in
USB orange LED on the Acquisition Module.
When starting the FieldTest Software, the SETUP screen below will appear. This screen is
used to setup the system and adjust calibration. To navigate between the FieldTest
Software main screens which are: SETUP, TIMED ACQUISITION, FREQUENCY
ACQUISITION and ANALYSIS, use the access button located in the upper window.
On the SETUP screen, the STATUS box shows the status of all selected instruments. This
is a valuable indicator to diagnose connection or calibration problems.
Another way to ensure the communication is working properly between the instruments
and the Acquisition Module is by noticing LED light on the Acquisition Module. Green
LEDs mean the Acquisition Module has received data from the instruments. As for RPM
signals, RPM Input LEDs will blink if the Acquisition Module receives pulses from the
RPM sensors.
If the FieldTest Software auto-recognized the instrument but no data was received
verify:
-the serial connection between the Acquisition Module and the TT10k and GPS.
-that the correct signal is connected between the Acquisition Module and the
Torquetrak Revolution and Analog Inputs.
11
© OpDAQ Systems 2011
7.1
Setup
On the left side of the SETUP screen, the INSTRUMENT SETUP box shows the readings of
all auto-recognized instruments. The INSTRUMENT SETUP box allows the user to choose
and configure all instruments independently. By pressing SETTINGS on the right of the
check marked instrument, the STATUS box at the center of the screen will be replace by
CALIBRATION, see next diagram. From the CALIBRATION box enter values according to
the instrument manufacturer’s instructions. When you are done, you must press the
ACCEPT or CANCEL icon to validate calibration. To ensure proper measurement follow
up calibration values will be shown in the data files header.
NOTE: Highlighted instruments in the INSTRUMENT SETUP box are not programmed for
application.
On the right side of the screen, enter the target name and folder where you want to
save acquisition files on your computer. The file names are incremented every
acquisition to prevent overwriting of acquisition files.
NOTE: The following characters are not supported in the file names:
.:?|/\<>*“
12
© OpDAQ Systems 2011
7.2
Timed Acquisition
The TIMED ACQUISITION screen is used for data acquisition up to 20 samples per
second.
The screen is divided into two parts, the right part is the control panel and the left part
is the graph display. See the next diagram for reference.
Start / Stop Data Acquisition
The START / STOP buttons are used to begin and end data acquisition.
Clear
The CLEAR button is used to clear the graph display from all previously recorded files.
Time Delay
The TIME DELAY box is used to set-up the sampling rate. A 0.05 SECOND value “20Hz” is
the default value from the TIMED ACQUISITION mode which means that data acquisition
will be performed 20 times per second. To reduce the sampling, as an example, to 5
acquisitions per second instead of 0.05, enter 0.20.
13
© OpDAQ Systems 2011
Samples on Graph
The SAMPLE ON GRAPH box allows the user to adjust the number of data points plotted
on the graph display. As an example, having 1000 samples on graph with a 0.05 time
delay, the graph display will shown 50 seconds of recorded data
NOTE: After entering a new value in this field, the user must hit ENTER on the keyboard
in order to activate the modification.
Use same Y scale
In the TIMED ACQUISITION screen with the Dual Torquetrak configuration, the user can
check the USE SAME Y SCALE box to set both scales together.
Save data
If the SAVE DATA box is checked, data will be logged and saved into a file every time the
START button is pushed. If the box is not checked, the data is only displayed on the
graph displays without creating any recorded files.
New daily file
The NEW DAILY FILE button is used when the acquisition is performed over a long period
of time. By checking this box, the FieldTest will create a new daily file at midnight every
day.
The PLOT
PLOT selection menu is used to select the data to be shown on the graph display. The
number of menus is adjusted according to the number of output channels from the
Acquisition Module.
READINGS
The READINGS box displays the recorded values in real time. All check marked
instruments in the SETUP screen are shown in this table.
NOTE: If the shaft rotation is stopped suddenly, the RPM value may remain at its last
value for 10 seconds.
14
© OpDAQ Systems 2011
7.3
High Frequency Acquisition
The High FREQUENCY ACQUISITION screen is particularly designed to be used for
torsional vibration analysis.
Changer image avec un Start au
lieu de Record et un signe de
play. Devrait-il y avoir un titre
au tableau en bas à droite
Start / Stop data acquisition
The START / STOP buttons are used to begin and end data acquisition.
Clear
The CLEAR button is used to clear the graph display from all previously recorded files.
Save data
If the SAVE DATA box is checked, data will be logged and saved into a file every time the
START button is pushed. If the box is not checked, the data is only displayed on the
graph displays without creating any recorded files.
Samples
The SAMPLES box sets up the number of samples logged per second. (2400 being the
default value) The sampling rate is fixed at 2 400 per second. Increasing this number
over 2400 increases the duration, but keeps the same sampling rate. The maximum
number of samples is fixed at 24 000 which represents 10 seconds of data at 2400
samples per second.
15
© OpDAQ Systems 2011
Continuous
When the CONTINUOUS box is checked, high frequency acquisition will run
continuously. The graph display will update in intervals depending on the number of
samples. Each acquisition has the same duration. For example, by checking
CONTINUOUS with samples at 4800, the FieldTest Software will update the graph
display every two seconds until the STOP button is pushed.
Measurement
The MEASUREMENT box allows the user to display the Torque FFT spectrum in dB RMS
or torque RMS values. The peaks are the frequencies where the torque component
vibrations occur. dB RMS is referenced to 1kNm.
PLOT
The PLOT selection menu is used to select the data to be shown on the graph display.
The number of menus is adjusted according to the number of output channels from the
acquisition module.
READINGS
The READINGS box displays the average value per period of time from 1 to 10 seconds
depending on the number of SAMPLES (from 2 400 to 24 000). All check marked
instruments in the in the SETUP screen are shown in this table.
7.4
Analysis
The ANALYSIS screen allows the user to load and export data that was previously saved,
see the next diagram.
16
© OpDAQ Systems 2011
7.4.1 Load
To display saved data, from the ANALYSIS screen, use the LOAD button. A window will prompt
the user to select the data acquisition file. After clicking OK, the selected saved data will be
displayed on the graph. You can use the Graph palette to zoom on the graph. For more
information concerning the graph palette, refer to chapter 8.
7.4.2 Export
The user can export data files to .xls format. The exported files can be opened directly
using MS Excel software for further analysis. To proceed, the user needs to locate the
file locations on the computer and open them using MS Excel. File locations were
previously allocated on the SETUP screen from the DATA FOLDER PATH box.
The user can also export a graph image to a clipboard to get it pasted in software such
as MS Word or to an image file. To get graph display copied to clipboard, follow these
steps:
Right click on the graph displays
In the right click menu, choose EXPORT SIMPLIFIED IMAGE…
A window will then appear, the user can choose the image format (Bitmap,
Encapsulated Postscript or Enhanced Metafile)
Choose EXPORT TO CLIPBOARD or SAVE TO FILE.
-If EXPORT TO CLIPBOARD is selected, the user can paste the image into
software such as MS Word.
-If SAVE TO FILE is selected, an image file will be created.
17
© OpDAQ Systems 2011
7.4.3 Report
The REPORT button allows the user to produce a PDF report containing graphical
analysis, comments and reference pictures in a standard and easy to share format. To
produce a PDF report, click REPORT and the following screen will appear. This window
allows the user to enter specific information to be included in the report. By checking
the SET AS DEFAULT box, report information will be saved for the next report.
After completing the fields, click GENERATE REPORT. The user will be prompted to select
a target file name and then the PDF report will open in a separate window
18
© OpDAQ Systems 2011
8.
Graphical Tools
8.1
Graph Palette
The graph palette located on the lower right side of every graph is used to zoom or pan
graph data.
Graph
Palette
1
2
3
Graph palette elements description
1. Annotation Movement Tool Used to move and select graph annotations
2. Zooming Tool—Zooms in and out of the display
3. Panning Tool—Picks up the plot and moves it around on the display
19
© OpDAQ Systems 2011
Zooming Tool Operation
B
A
C
E
F
D
Press the zooming tool button and select one of the following zooming options:
A) Zoom to Rectangle—With this option, click a point on the display you want to be
the corner of the zoom area and drag the tool until the rectangle covers the
zoom area.
B) X-zoom—Use this option to zoom in on an area of the graph along the x-axis.
C) Y-zoom—Use this option to zoom in on an area of the graph along the y-axis.
D) Zoom to Fit—Use this option to autoscale all x- and y-scales on the graph to
return to the original display
E) Zoom In about Point—With this option, click a point you want to zoom in on.
Press and hold the <Shift> key to switch between Zoom In about Point and Zoom
Out about Point.
F) Zoom Out about Point—With this option, click a point you want to zoom out
from.
8.2
Scale Adjustment
The X and Y scales of the Graph displays are adjustable manually or automatically. The
default setting is in Autoscale mode, which means that the scale is continuously
adjusting itself to optimize the resolution.
To readjust the scale to specific minimum and maximum values. This can be done
following these steps:
Right click on the scale, and unselect the AUTOSCALE function in the menu.
Double left click on the minimum or maximum value of the scale.
Modify it to the desired value.
Press Enter, then the scale readjusts with the user selected value.
20
© OpDAQ Systems 2011
9.
Technical Support
For technical support please contact OpDAQ Systems Inc.:
Phone: +1-418-727-5753
Email: [email protected]
21
© OpDAQ Systems 2011