1
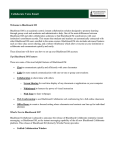
ACE USER MANUAL ACE Development Team ANALOG DEVICES, INC. Contents 1 Introduction .................................................................................................................................... 3 2 Getting Started with ACE ................................................................................................................ 3 3 2.1 Installation Instructions .......................................................................................................... 3 2.2 Quick Start............................................................................................................................... 5 2.3 Showing Multiple Views .......................................................................................................... 6 Understanding the User Interface .................................................................................................. 6 3.1 Application Toolbar ................................................................................................................. 7 3.1.1 File Options ..................................................................................................................... 7 3.1.2 View Options ................................................................................................................... 7 3.1.3 Help Options ................................................................................................................... 7 3.2 Status Bar ................................................................................................................................ 7 3.3 Navigation ............................................................................................................................... 8 3.4 Start View ................................................................................................................................ 8 3.4.1 Attached Hardware Section ............................................................................................ 9 3.4.2 Explore Local Plug-ins Section ......................................................................................... 9 3.4.3 More Information Button ............................................................................................... 9 3.4.4 Sessions ........................................................................................................................... 9 3.4.5 Navigation from the Start View .................................................................................... 10 3.5 System View .......................................................................................................................... 10 3.5.1 Acquiring and Releasing Hardware ............................................................................... 10 3.5.2 Subsystem Connection State ........................................................................................ 11 3.5.3 Navigating from the System View ................................................................................. 11 3.6 Board View ............................................................................................................................ 11 3.6.1 Component Types ......................................................................................................... 12 3.6.2 Component Styles ......................................................................................................... 12 3.6.3 View Toolbar ................................................................................................................. 12 3.6.4 Initialization Wizard ...................................................................................................... 12 3.6.5 Navigating from the Board View ................................................................................... 14 3.7 Chip View .............................................................................................................................. 14 3.7.1 Block Types.................................................................................................................... 15 3.7.2 Component Styles ......................................................................................................... 15 3.7.3 Configuration ................................................................................................................ 16 3.7.4 View Toolbar ................................................................................................................. 16 3.7.5 Navigation from the Chip View ..................................................................................... 16 ACE DEVELOPMENT TEAM 1 3.8 3.8.1 Display Types................................................................................................................. 17 3.8.2 Component Styles ......................................................................................................... 17 3.8.3 Configuration ................................................................................................................ 18 3.8.4 View Toolbar ................................................................................................................. 18 3.8.5 Viewing Bit Fields inside Registers ................................................................................ 18 3.8.6 Changing between Registers and Bit Fields .................................................................. 19 3.8.7 Filtering the Display Content ........................................................................................ 19 3.8.8 Searching for a Bit Field ................................................................................................ 19 3.8.9 Paging ............................................................................................................................ 19 3.9 4 Memory Map View ............................................................................................................... 17 Tool Views ............................................................................................................................. 20 3.9.1 Macro Tool .................................................................................................................... 20 3.9.2 Register Debugger ......................................................................................................... 22 3.9.3 Events ............................................................................................................................ 22 Communicating with Attached Hardware .................................................................................... 23 4.1 Acquiring and Releasing Hardware ....................................................................................... 23 4.2 Initialization Wizards............................................................................................................. 23 4.3 View Toolbars........................................................................................................................ 23 4.4 Register Debugger................................................................................................................. 24 5 ACE Support .................................................................................................................................. 24 6 Terms Explained ............................................................................................................................ 24 ACE DEVELOPMENT TEAM 2 1 Introduction ADI’s “Analysis, Control, Evaluation” (ACE) is a desktop software application which allows the evaluation and control of multiple evaluation systems, from across ADI’s portfolio. The application consists of a common framework and individual component specific plug-ins. This guide details: Getting Started with ACE Understanding the User Interface (UI) Communicating with Attached Hardware This will allow the user’s evaluation of ADI components to begin in the timeliest manner. 2 Getting Started with ACE 2.1 Installation Instructions The latest instance of ACE is available from http://wiki.analog.com/resources/tools-software/ace. For the best performance, download the installer program (to a local hard drive before running the installer, ACEInstall _xx.xx.xx.xx.exe, where xx.xx.xx.xx is the version number. The ACE Setup Wizard is used to step through the installation process. Step 1: Close all open instances of ACE before clicking “Next” to proceed, Figure 2.1 Figure 2.1: ACE Setup Wizard Step 1 ACE DEVELOPMENT TEAM 3 Step 2: Choose the features of ACE you wish to install, Figure 2.2. It is recommended that all features be selected since ACE cannot be run without the required prerequisites; prerequisites will only be installed if the latest version is not found locally. Click “Next” to proceed to the next step in the wizard. Figure 2.2: ACE Setup Wizard Step 2 Step 3: By default ACE will install to the location path C:\Program Files(x86)\Analog Devices\ACE. To change the install location, modify the path of the destination folder in the wizard. Click “Install” to start the installation. Figure 2.3: ACE Setup Wizard Step 3 ACE DEVELOPMENT TEAM 4 Step 4: Installation is run, Figure 2.4. Click “Next” when the installation is complete. Figure 2.4: ACE Setup Wizard Step 4 Step 5: ACE is now installed, Figure 2.5. Click “Finish” to exit the wizard. Figure 2.5: ACE Setup Wizard Step 5 2.2 Quick Start ACE is designed to allow you to evaluate hardware in a manner reflecting the associated hardware. ACE’s hierarchy begins with a view of a system a container for all of the available components, both attached hardware and local plug-ins, which can be addressed by the program. This system is made up of one or more sub-systems. Each sub-system is a representation of the physical boards that make up the sub-system. This can be a single board or multi board setup depending on the hardware. Once a system has been created its UI configuration settings can be saved off as a session to allow its reuse. A session is automatically generated when a system is created. In order to quickly setup a session and begin evaluation complete the following steps: 1. Double-click on the relevant plugin on the Start View. ACE DEVELOPMENT TEAM 5 2. If available, configure the board from the Initialization Wizard on the Board View. 3. Navigate to the Chip View of the desired component. 4. Open the relate Memory Map View. The Chip and Memory Map views are designed to provide details about the makeup of the component and allow their control. 2.3 Showing Multiple Views The location of tabs can be moved from their default locations which allow two views to be shown side-by-side. This is particularly useful as it simplifies the coordinate use of the Chip View and Memory Map View. The process for moving tabs to display side-by-side is as follows: 1. Grab the tab header of the tab you wish to move. 2. Drag the tab so that location arrows become visible. 3. Drag the tab to the arrow associated with the new location for the tab and release the mouse. For example to place a view to the right of the other tabs, drag the selected tab over the right arrow in the centre of the other tab and release the mouse, Figure 2.6. Tabs can also be undocked from the main application window by dragging a tab and releasing it where you wish it to open and not on an arrow. Figure 2.6: Moving Tabs 3 Understanding the User Interface The user interface (UI) of ACE is based on a hierarchy of views which mirrors the evaluation setup from the system level to the register level, see Figure 3.1. It is designed to educate the user in the functional ACE DEVELOPMENT TEAM 6 operation of the component and allow the user to access the system at a level of abstraction with which they are comfortable. This section will outline the key features and functions of each view. Figure 3.1 Software Hierarchy 3.1 Application Toolbar The application toolbar, Figure 3.2, contains operations and settings which are independent of the views being displayed. The operations available are grouped in the following categories: File View Help Figure 3.2: Application Toolbar 3.1.1 File Options The file menu contains the options for creating, opening, closing and saving sessions. 3.1.2 View Options The view menu provides options for navigating back to the Start and System Views. It also contains the options for opening the Tool Views (3.9). 3.1.3 Help Options The help menu provides an about pop-up which contains details about ACE. 3.2 Status Bar The Status Bar at the bottom of the application indicates whether it is possible to communicate with the target hardware or not in terms of the following states: Unavailable – The hardware is not acquired by ACE. Unknown - Communication with the hardware is not reliable, it is not setup or the state cannot be determined by the software. ACE DEVELOPMENT TEAM 7 Uninitialized - The hardware is in its default power on state and has not been configured or setup. Good - The hardware communication is good, it has been setup and various parameters are as expected. It also provides a notification in the event of a reset or release of the hardware or completion of the following commands: Reset Sequence - The target hardware has been returned to its default/minimum state where communication is possible. Poll Status - The communication between the hardware and software was checked and if good, the status is checked. Setup - Changes the state of the target hardware from Uninitialized to Good. 3.3 Navigation Navigation through the UI is designed to mimic stepping down through the hardware hierarchy, as outlined in Figure 3.1. This can be done from within the main view or from the navigation breadcrumbs, Figure 3.3. Double-Clicking on the element you wish to step into allows navigation down from the Start View to the System View, the Board View and finally the Chip View, while the navigation from the Chip View to the Memory Map View is completed through a button located in the bottom right-hand corner of the view, section 3.7.5. Clicking on the arrow next to a step in the Navigation Breadcrumbs will show the list of available next steps from that view. From here it is possible to navigate to the next level down in the hierarchy or any previous levels of the hierarchy for any component. Navigation Breadcrumbs Figure 3.3: Navigation Breadcrumbs 3.4 Start View When the application opens you will be presented with the Start View, Figure 3.4. This view allows you to set up a system to be used in a session. A system can be made up of a single or multiple subsystems and can be a mixture of attached hardware and unattached local plug-ins. ACE DEVELOPMENT TEAM 8 Recent Sessions Section Attached Hardware Section Add Subsystems Button Explore Local Plug-ins Section More Information Button Navigate to Default Page Option Figure 3.4 Start View 3.4.1 Attached Hardware Section The attached hardware section displays all subsystems which are physically attached to the PC through the USB and for which there are plug-ins. The identify hardware button can be used to identify the detected hardware, generally by flashing an LED on the board. This allows the user to verify which piece of evaluation hardware they are connecting to. By double clicking a subsystem in this section it will be added to the system and ACE will try to automatically acquire this hardware. 3.4.2 Explore Local Plug-ins Section The explore local plug-ins section contains a list of subsystems for plug-ins which are installed on your local machine, whether or not there is hardware attached. This allows you to preview ADI components without having the associated hardware attached. 3.4.3 More Information Button On both the attached hardware subsystems and the local subsystems the more information button can be used to reveal information about the subsystem. This information is provided by the plug-in designer to increase user understanding of the evaluation hardware. 3.4.4 Sessions Sessions are used to save and reopen the user’s work inside the application. Opening a session will restore the system that was created when the session was saved and the state of the views opened. They also store macros that were created or used when the session was saved. Previous sessions can be opened and new sessions created from left-hand pane of the Start View, Figure 3.4. Recently opened sessions can be viewed and opened from the recent sessions’ section. Only one session can be open at a time. ACE DEVELOPMENT TEAM 9 3.4.5 Navigation from the Start View The add subsystems button, Figure 3.4 , adds all selected subsystems local or attached to the system and navigates to the next level of the hierarchy the System View. Alternatively a single subsystem can be added by double-clicking on the desired subsystem. By default adding a subsystem using the double-click method will add the subsystem to the system and bring you to the default view as set in the plug-in. This can be changed by unselecting the navigate to default page option at which point the double-click method will bring you to the System View. 3.5 System View The System View, Figure 3.5, shows the subsystems that have been added by the user to in the system. From here subsystems can be linked to real hardware through the acquire/release hardware menu or removed from the system by clicking the remove button. Remove Button USB Connectivity Button Acquire/Release Hardware Menu Figure 3.5 System View 3.5.1 Acquiring and Releasing Hardware Hardware subsystems, both attached and local can be acquire/release through the acquire/release hardware menu, Figure 3.6 , which can be accessed by pressing the USB connectivity button. Compatible Subsystems List Operate Without Hardware Option Use Selected Hardware/ Continue Without Hardware Button Figure 3.6: System View - Acquire/Release Hardware Menu ACE DEVELOPMENT TEAM 10 The compatible subsystems list contains a list of available hardware which can be acquired by a subsystem. This list is comprised of both attached hardware and local plug-ins. To acquire a subsystem select it from the compatible subsystems list and select the use selected hardware button. To release the acquired subsystem select the operate without hardware option and then click the continue without hardware button. 3.5.2 Subsystem Connection State The USB icon on the USB connectivity button indicates the connection state of the subsystem. The color of the USB icon will changed based on the current state of the connection, with the following states being represented: Acquired - Subsystem is connected to a controller. Released - Subsystem is not connected to a controller. Error - The Controller is not responding as expected, Hardware may need reset. Warning - An Operation on the Subsystem did not succeed, or behave as expected, but the Controller is still available and responding. 3.5.3 Navigating from the System View Double-clicking on a particular board transfers focus to the associated Board View for that board; alternatively double-clicking on a subsystem in this view will transfer focus to the Subsystem View. 3.6 Board View The Board View, Figure 3.7, shows all the ADI components located on a particular evaluation board plus the board connectors at their approximate locations. View Toolbar Figure 3.7 Board View ACE DEVELOPMENT TEAM 11 3.6.1 Component Types The component classifications are: Primary (Configurable) – The principal component for evaluation on the board. Secondary (Configurable) – A lesser component on the board which can be explored and configured. Secondary (Non-configurable) – A lesser component on the board which is present for informational purposed but cannot be configured. 3.6.2 Component Styles The color styles and sizes representing the different components are: The primary component to be evaluated on the board. A secondary component on the board which is configurable. A secondary component on the board which is not configurable but is included to give a complete picture of the board being evaluated. 3.6.3 View Toolbar The view toolbar provides the following operations that affect all components on the board: Reset Device – Reverts all components to their default state. Poll Device – If enabled causes the continuous polling of the device for state changes. Auto Apply – If enabled causes continuous applying of changes made by the operator to the device. Please note that not all of these functions are available for all components. 3.6.4 Initialization Wizard Some boards contain an initialization wizard, Figure 3.8, to configure components. The wizard initialization setup process collects and applies the initial startup conditions for the board and all board components. ACE DEVELOPMENT TEAM 12 Initialization Wizard Summary Button Restore Software Defaults Button Apply Button Figure 3.8 Board View with Initialization Wizard 3.6.4.1 Types of Initialization Wizards There are three types of wizards Only one setup step – In this type of wizard all initialization is done at once with all settings being applied when the apply button is pressed. Multiple steps (no order enforced) – The wizard is broken down into multiple steps. Each step sets a specific component. In this type of wizard, the order in which steps are configured is not significant, so the user can jump between sections by clicking and expanding the section they are interested in. The board will not be configured until the apply button is pressed. Multiple steps (order enforced) - The wizard is broken down into multiple steps, with each step setting up a specific component of the device. In this case, previous selections impact the options for subsequent stages and all steps must be carried out in a defined order. After a step is configured, the next button is used to move to the next step in the process. Previous steps can be accessed by selecting the previous button or by clicking and expanding the desired step. Once a user navigates to a previous step, all subsequent steps must be completed again. 3.6.4.2 Initialization Wizard Buttons The restore software defaults button will set all software values to their default states. This does not affect the hardware state. For wizards with a required defined order, a restore automatically brings the user back to the first section and requires all steps to be repeated before a configuration can be applied. The apply button at the bottom of the wizard writes the configuration to the component. The summary button opens a summary of your configuration. This summary can be viewed at any time. ACE DEVELOPMENT TEAM 13 Once the component has been configured, the summary is displayed where the wizard was previously displayed, Figure 3.9, to allow you to easily review your settings. The modify button under the configuration allows you to reopen the wizard and change the settings. Modify Button Figure 3.9 Board View with Initialization Wizard after Configuration 3.6.5 Navigating from the Board View Double-clicking a configurable component will bring the user to the device view for the selected component. 3.7 Chip View The Chip View, Figure 3.10, is an interactive block diagram for the component. It provides an insight into the functional operation of the component, and allows the user to configure high level features of the component in an intuitive manner. ACE DEVELOPMENT TEAM 14 Selector View Toolbar Proceed to Memory Map Button Figure 3.10 Chip View 3.7.1 Block Types The diagram block classifications are: Configurable – A block which is configurable by clicking on it. Depending upon the block and the associated component, clicking can enable/disable the block, allow inline editing of a single value, or present a popup for configuring multiple values. Non-configurable – A block which has no settings that can be edited from the Chip View. They are included in the diagram to depict signal flow, or to help with understanding the component. Power down/ disabled – A block which has been disabled, either because of enabled bits or because it is powered down. The tooltip will indicate whether it can be enabled and/or powered up with a click, others can be enabled from the Memory Map View. Error - A block which is in an error condition. Either one of the block’s properties is causing the error, or associated block(s) are causing this block to receive signals that are invalid. Open the Events Tool View to see more details about the error(s). 3.7.2 Component Styles A configurable block. A non-configurable block. A power-downed or disabled block. A block in an error state. ACE DEVELOPMENT TEAM 15 3.7.3 Configuration The configuration of settings for the component is done by clicking on configurable blocks, which can be identified by their gradient backgrounds and a hand cursor. Changing value(s) on block(s) will update the associated register values, and the changes will be reflected in other views like the Memory Map View. Note that these changes will only apply to software unless auto apply is enabled for the board or until an Apply action is selected. In many cases, when there are multiple instances of similar blocks that are functionally grouped, the diagram is simplified to show one group at a time. A selector is used to choose which group of blocks to show, and the group of blocks is indicated by a dark background. The user can click the selector to choose a particular group, or click the up and down arrows to choose the next or previous group. 3.7.4 View Toolbar Unless the auto apply has been enabled in the Board View, section 3.6.3, values changed in the Chip View will affect the software values in the Chip and Memory Map views only, they will not affect the hardware state. The following view toolbar buttons can be used to update both the hardware and software values: Apply Changes – Applies all of the register changes made in the software to the hardware. Read All – Reads the register values from the hardware and updates the software values. Reset Device – Resets hardware to its default state. This command does not affect the software values. Diff – Shows registers that are different on the hardware when you navigate to the Memory Map View. Software Defaults – Updates the software to display the software specified default values. This command does not affect the hardware. 3.7.5 Navigation from the Chip View The proceed to memory map button in the bottom-right corner will open the Memory Map View for the device when clicked. ACE DEVELOPMENT TEAM 16 3.8 Memory Map View The Memory Map View shows all registers and bit fields that make up the component. View Toolbar Expand/Collapse All Buttons Hex Data Column Binary Data Column Select View Pane Filter Pane View Search Pane Figure 3.11 Memory Map View – Registers Visible 3.8.1 Display Types The data contained in the memory map of the component can be viewed in the following ways: Registers View – Displays all registers in the component, Figure 3.11. These registers can be expanded to show the bit fields within. Bit Fields View – Displays all bit fields in the component, Figure 3.12. Figure 3.12 Memory Map View - Bit Fields Visible 3.8.2 Component Styles When the value of a register or bit field is changed so that the value in the software doesn’t match the expected value in the hardware the register or bit field will be highlighted by the text being bolded. ACE DEVELOPMENT TEAM 17 The colors of the bits indicate the access type of the bit: A bit with a “Write Read” access type which can be written to and read from where the software value matches the expected hardware value. A bit with a “Read Only” access type which can only be read from. A bit which does not exist in the bit field. A bit with a “Write Read” access type which can be written to and read from where the software value differs from the expected hardware value. 3.8.3 Configuration The Register view, Figure 3.11, allows you to configure registers at a bit level. The value can be changed either by changing the hexadecimal value in the hex data column or by clicking on individual bits in the binary data column. Registers can be expanded to show the bit fields that make them up and these bit fields can also be controlled by toggling the bits. The Bit Fields view, Figure 3.12, allows bit field values to be modified by changing a control’s value. Changing the value of a control will modify the bit field value to that which the control selection represents. The hex data column displays the hexadecimal value of the bit field’s control state. 3.8.4 View Toolbar Unless the auto apply has been enabled in the Board View, section 3.6.3, values changed in the Memory Map View will affect the software values in the Memory Map and Chip views only, they will not affect the hardware state. The following view toolbar buttons can be used to update both the hardware and software values: Apply Changes – Applies all changes made in the software to the hardware. Apply Selected – Applies current software value of the selected register to the hardware. This option is only available when the registers are displayed. Read All – Reads the register values from the hardware and updates the software to these values. Read Selected – Reads the selected register’s value from the hardware and updates the software to this value. This option is only available when the registers are displayed. Reset Device – Resets hardware to its default state. This command does not affect the software values. Diff – Shows registers that are different on the hardware. Software Defaults – Updates the software to display the software specified default values. This command does not affect the hardware. Please note that changes made in this view will be duplicated in the Chip View. 3.8.5 Viewing Bit Fields inside Registers Registers can be expanded, to view the bit fields that composes it, by clicking on the expand (“+”) button beside the register you wish to expand. Likewise expanded registers can be collapsed by clicking the collapse (“-“) button beside expanded registers. The expand button and collapse button in the column header can be used to expand or collapse all registers. ACE DEVELOPMENT TEAM 18 3.8.6 Changing between Registers and Bit Fields You can switch between viewing registers, Figure 3.11, and bit fields, Figure 3.12, by changing the selection in the select view pane on the left-hand side of the view. 3.8.7 Filtering the Display Content Both of these views can be filtered based on functional groups and register maps from the filter view pane. These filters will be maintained when switching between the register and bit field views. 3.8.8 Searching for a Bit Field The search section allows you to search for particular bit fields based on the name or address. Clicking on the desired result will highlight it in the main grid. 3.8.9 Paging Paging or local channeling is available on components which are made up of multiple channels that need to be configured separately, Figure 3.13 (register view), Figure 3.14 (bit fields view). Page Selector Section Copy Button Figure 3.13Memory Map View - Paging with Registers Visible Figure 3.14 Memory Map View - Paging with Bit Fields Visible 3.8.9.1 Selecting a Page The different page groups are displayed in the page selector selection at the top of the view. Each group has an associated drop-down menu where you can select which page in a page group is the currently selected page. The selected pages value is the value visible in the register or bit fields grid. When the selected page group is changed the software will update to show the values for the newly selected page. When the registers are visible and expanded the page group associated with a bit field is displayed beside the name of that bit field, Figure 3.13. If the bit fields view is selected the page group associated with the bit field will be displayed in the page group column, Figure 3.14. 3.8.9.2 Duplicating Pages across a Page Group The copy button under each page group in the page selector group allows values to be copied from one page in a page group to others in the same group. To perform this select the page you wish to ACE DEVELOPMENT TEAM 19 copy the value from in the drop down menu and then check the boxes of the pages you want to copy the values to. Clicking the copy button will perform the change while clicking close or outside of the copy pop-up will close the pop-up without performing the copy. 3.9 Tool Views The Tool Views are a collection of views that add additional functionality to the main views outlined above. These views can be opened from the view menu item on the application toolbar, section 3.1, and open outside of the main view tabs. Tool Views that are opened when the application is closed will reopen when the application starts up again. 3.9.1 Macro Tool The Macro Tool View, Figure 3.15, allows commands to be recorded and played back. Macros can be created to configure a component, to share a series of steps with other users or to perform common tasks multiple times to reduce human error. Macros List Macros View Figure 3.15 Macro Tool View Commands List The Macro Tool toolbar can be used to open, record, save, close and delete Marcos. When in recording mode the commands list will automatically populate when a recordable transaction is selected. By default the list command is populated with the top level command, for example apply settings, this can be extended to show sub-commands by selecting the record sub-commands option prior to activating the record. When sub-commands are recorded the Commands list is expanded to contain the sub-commands that occur when the transaction is trigger, for example all registers updated as part of the apply settings transaction are listed. Sub-commands are donated by a “>” symbol for each level of the tree. If there is a macro currently opened and the record button is selected a popup will open giving the options to either record a new macro or to append the recording onto the currently open one. If record a new macro is selected a new macro will be created and added to the macros list. This macro will automatically become the current macro and the transactions will be recorded as component of this new macro. This will have no effect on any other open macros which will still be available in the macros list. If the append option is selected the next transaction recorded will be added to the command list of the current opened macro. There is no checking to ensure that the new command can be completed following on from the previous step, for example there is no check to ensure that the view open is the same between the two commands. When the stop recording button is pressed no further transactions will be recorded and the macro view will open in the main application view area, ACE DEVELOPMENT TEAM 20 Figure 3.15. From here the macro commands can be played, modified and deleted. Right-clicking on any command in the grid will open a context menu. From there the order in which the commands are executed can be altered by promoting and demoting individual commands. It also allows for individual steps to be deleted, while all commands in the macro can be deleted by selecting the clear all button in the view toolbar. From this view the way in which steps are played can also be edited. Steps can skipped by selected the checkbox for that command in the skip column. Similarly you can insert a break after a particular command by selecting the checkbox in its break column. When a break is added the macro will run all commands up to and including the selected command before waiting for the user’s input to continue. Alternatively a delay can be added to a command so that the macro pauses but does not stop after a command is executed. A delay can be added through the commands context menu for periods ranging from 10 milliseconds to 10 seconds. The context column allows the subsystem which the commands are being executed on to be set based on the list of compatible subsystems in the drop-down menu. This step may need to be carried out if the current session differs from the session when the Macro was recorded. ACE DEVELOPMENT TEAM 21 3.9.2 Register Debugger The Register Debugger, Figure 3.16, is used to perform raw register writes to and reads from the component. Address Drop-Down Menu Write Data Textbox Write Button Read Data Textbox Read Button History Grid Clear Button Repeat Button Figure 3.16: Register Debugger Tool View The address drop-down menu is populated with a list of all registers in the component. Changing the selected address will change the register that is written to or read from when the write button or read button is pressed. When the write button is pressed the hexadecimal value in the write data textbox will be written to the selected register and this action added to the history grid. Similarly when the read button is pressed the selected register is read from and its value populates the read data textbox. It is important to note that since this view preforms raw writes, there is no write verification step, so the value on the hardware after the write may not match the value that was written. The history grid shows previous writes and reads preformed from in this view. These writes and reads can be repeated by selecting the step to be repeated and selecting the repeat button. All previous actions can be removed from the history grid using the clear button. 3.9.3 Events The Events Tool View contains a list of error, warning and information messages generated within the application software, Figure 3.17. Figure 3.17: Events Tool View Messages are divided into the following sections: Level – Severity of the message. Source – Generator of the message. Name – Property in the source generating the message. ACE DEVELOPMENT TEAM 22 Type – Category of the message. All messages are categorised as one of the follows: o Unspecified – Informational message. o ValueRequired – Value is invalid and must be supplied. o ValueInvalid – The value is invalid. o ValueOutOfRange – Value supplied is not within acceptable range. o ConverterNotAvailable – An attempt was made to convert the value to the required type, but no converter exists. o ValueTypeInvalid – The type of the value is incorrect, no attempt at conversion/coercion was made. o UnknownProperty – No property was found with the specified name/binding. o Coerced – The value was coerced to the nearest valid value, implies the value supplied was invalid. o FileNotFound – The value as a file path was not found in the file system. Description – Details about why the message is occurring. 4 Communicating with Attached Hardware 4.1 Acquiring and Releasing Hardware When a subsystem is added to the system ACE automatically tries to acquire the associated hardware. After this point hardware can be acquired or released through the acquire/release menu in the System View which can be access by clicking on the USB connectivity button, see section 3.5.1 for more information. 4.2 Initialization Wizards Where available initialization wizards provide a setup process which collects and applies the initial startup conditions for a board and all its components. Once the software inputs are complete pressing the apply button will perform all necessary writes and reads in order to put the hardware into the defined state, see section 3.6.4 for more information. 4.3 View Toolbars The view toolbars in each of the Board, Chip and Memory Map views provide controls for communicating with hardware. Each view toolbar contains a selection of the following communication options: Reset Device – Reverts all components to their default state. Poll Device – If enabled causes the continuous polling of the device for state changes. Auto Apply – If enabled causes continuous applying of changes made by the operator to the device. Apply Changes – Applies all changes made in the software to the hardware. Apply Selected – Applies current software value of the selected register to the hardware. Read All – Reads the register values from the hardware and updates the software to these values. Read Selected – Reads the selected registers value from the hardware and updates the software to this value. Reset Device – Resets hardware to its default state. For more view specific information see sections 3.6.3 (Board View), 3.7.4 (Chip View) and 3.8.4 (Memory Map View). ACE DEVELOPMENT TEAM 23 4.4 Register Debugger The Register Debugger is a tool view which allows the performance of raw register reads and writes, see 3.9.2 for more information. 5 ACE Support For support please contact [email protected]. Any feedback, positive or negative, is also very welcome and appreciated. 6 Terms Explained An alphabetically indexed list of terms used: Acquire – Connect to an attached board. Board - A physical piece of hardware used to evaluate or demonstrate chips and circuits. Command – An action performed by the user on/through the software. Component – A board in a subsystem, or a part or chip on a board. Controller – A component on a board that is used to send commands or data to or receive responses or data from a board or chip under evaluation. Macro – Recorded keystrokes and mouse activity can be saved as a macro (script) and run again. Page – A channel that can be figured as part of a Page Group. Page Group – A group of channels. Paging – Also known as Local Channelling, is when a part is made up of multiple channels which all need to be configured separately, in the same register map address space of a chip. Plug-in – The product specific application element. Release – Disconnect from an attached board. Session – A collection of settings for the configuration of the User Interface. Subsystem – A unit that represents a container for components grouped together under a system. It represents a group of physically connected boards. Minimally, a subsystem will consist of a single component. System – A unit that represents a container for all of the current components that can be addressed by the program. One system at a time is allowed expression within a session. Minimally, a system will consist of a single subsystem. A system does not have to reflect only hardware currently connected to the computer Toolbar – A container for action buttons. ACE DEVELOPMENT TEAM 24