1
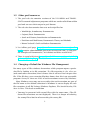
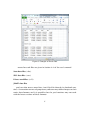
Computers and Econometrics - Preliminaries
John C. Frain.
May 31, 2011
1
Downloading and installing gretl (GNU Regression
and Econometric Timeseries Library)
1.1
Obtaining gretl
Quoting from http://gretl.sourceforge.net/ gretl is a cross-platform
software package for econometric analysis, written in the C programming language. It is free, open-source software. You may redistribute it and/or modify
it under the terms of the GNU General Public License (GPL) as published by
the Free Software Foundation. A windows version may be downloaded by selection gretl for Windows on the list on the left hand side of the home page.
There are two versions of the install program available gretl-1.9.5.exe and
gretl_install.exe. The first of these is the latest “stable” version. The second is the latest development snapshot whic may contain some updates and
bug fixes but may have some new bugs. I use the second version and update
occasionally. I keep the previous version in case i need to revert but this has
not proven necessary. A user’s guide and a reference manual are contained
in the download or may be downloaded separately from the web-site.
1.2
Installing gretl
Installation is simple. Double click on the downloaded file and follow the
instructions. You may accept the suggested defaults.
1
1.3
Other gretl resources
1. The gretl web site contains versions of the X12-ARIMA and TRAMOSEATS seasonal adjustment programs which are can be called from within
gretl and can save their output in gretl format
2. The web site also contains data sets and script files for
• Wooldridge, Introductory Econometrics
• Gujarati, Basic Econometrics
• Stock and Watson, Introduction to Econometrics
• Davidson and MacKinnon, Econometric Theory and Methods
• Marno Verbeek’s Guide to Modern Econometrics
3. Lee Adkins gretl page, http://www.learneconometrics.com/gretl.
html contains a downloadable guid to the use of gretl with ? (Using gretl
for Principles of Econometrics, 3rd edition) and other useful links.
4. There is a gretl wiki site at http://gretlwiki.econ.univpm.it/wiki/
index.php/Main_Page. This also contains some useful links
1.4
Changing a Default for Windows File Management
For many types of files windows determines which program opens a particular file by looking at its file extension. If a file extension is .xls, .xlsx .csv
(and some other extensions) then it knows that it will use Excel to open that
file. If the file has a .exe extension Windows knows that this is an executable
program. On my PC there are 100’s of such extensions reserved by Windows.
Many Windows users may not even realise that such extension are part of
the file name as the default behaviour in Windows is not to display all such
file extensions in all file listings (Windows Explorer, File Search Results, File
Save As Lists. This leads to confusion
• You may be presented with several files with the same name. (The different file extensions are not displayed). There is a danger of selecting
the wrong file to load or of overwriting the wrong file.
2
• Some windows programs (e.g. Internet Explorer have a habit of adding
an known extension to a downloaded file which has an unknown extension. Thus data.gwt will become data.gwt.htm or data.gwt.txt or
something similar. The file will continue to appear in all default Windows file lists as data.gwt and you may have problems opening it.
• At one time some Malicious email attachments had names filename.
txt.exe. These appeared in Windows as filename.txt and a person
might be tempted to open one thinking that it was just a simple test file.
The cure is relatively simple.
Open Windows Explorer.
Select |Tools(
Alt+T)|Folder Options| and in the list make sure that the box hide extensions
for known file types is not ticked. (If it is ticked click on it to remove the tick).
Then click on the button apply to folders. The description here is for Windows
7 but a similar adjustment is appropriate in both VISTA and XP.
2
Using Gretl
There are basically about 3 ways to use gretl
1. Using the programs graphical user interface (GUI) – This is similar to
many Windows programs where you use the mouse and mouse clicks to
select various actions from drop-down menus. As you will see most of
the menus are self explanatory. For the moment to start the GUI just
double click on the gretl icon that the install program that the installed
on your desktop.
2. Using gretl scripts – All these menu items can be completed by issuing commands in the gretl programming (script) language. These commands can be saved to a file and the set of instructions in a file can be
rerun from the file.1
1
In some organisations the internal audit function (or management may insist that a
record of econometric analysis be kept to aid replication. Unless the work is of a very
simple nature this is the only way to ensure that an analysis can be replicated.
3
3. Combining GUI and scripting – If you run Gretl from the GUI it has the
facility to save the menu choices and options you take as a script file.
You may then use and possible expand and amend that script file as a
basis for further analysis
In the beginning we will be using the GUI and as we get more accustomed
to the analysis we shall look at scripting. Sessions on specific topics will
probably use other packages such as STATA (see section 3 below. While the
detailed use of the packages may differ the general methodology will be similar. When you start the GUI the window in Figure 1 is displayed.
Figure 1: Gretl Start Window
In working through any econometric project I recommend that one set up a
specific directory or subdirectory for that project (C:\Users\frainj\gretl\
introduction). I can specify that directory as working directory using the
|File|Working Directory| menu item as in Figure 2. In that directory I have an
4
Figure 2: Gretl Working Directory
Excel file denmark .xls which is illustrated in Figure 3.
The data set is a rectangle with observations in rows and series in columns.
Missing data can be represented by blank cells, by NA or several other options. (See users’ guide). The data are imported from Excel using the Menu
items |File|Open Data|Import|Excel| and selecting the relevant file. Gretl will
try to determine various features of the file and will ask you to confirm these
features. (It generally does this well). In the current case it determines that
the data are time series and labels the observations with the correct dates.
The data are now entered on the Gretl Workplace. Gretl can import data from
a large number of other programs
Plain text (ASCII) files – These can be brought in using gretlâĂŹs |File|Open
Data| Import ASCII. . . | menu item, or the import script command. For
details on what gretl expects of such files, see Section 4.4. of the users’
guide.
Comma-Separated Values (CSV) files – These can be imported using gretlâĂŹs
|File|Open Data|Import CSV. . . menu item, or the import script command.
See also Section 4.4.
Spreadsheets: MS Excel, Gnumeric and Open Document (ODS) – These are also
brought in using gretlâĂŹs |File|Open Data|Import| menu. The require5
Figure 3: Sample of Excel data
ments for such files are given in Section 4.4. of the user’s manual
Stata data files (.dta).
SPSS data files (.sav).
Eviews workfiles (.wf1)
JMulTi data files
gretl can also access some Rats 4 and GiveWin through its databank routines. On occasion owners of proprietary software may make changes to their
native data formats and it is possible that the gretl routines may not work
with the latest versions of these formats.
6
Gretl has its own mative data format and it is possible to save all or a
selection of our data in this format with the menu item |File|Save Data|. It can
then be loaded directly from the |File| Open Data|User File| menu item.
Figure 4: Sample of Excel data
Examining the menu items shows the variety of work that can be completed in gretl. The following graph (Figure 5 and its annotations were produced in two steps.
1. A basic graph containing the two series was produced using the menu
item |View|Graph selected Variables|Time Series Plot| and choosing the
two variables to be plotted. This does not produce a very informative
graph.
2. Rright clicking on the graph brings up a context box. Select the edit item
to bring up a tabbed options box. First select the lines tab and change
7
the axis for line 2 LYR to right axis. Next select the main, x-axis, y1-axis
and y2-axis to add various other labels to the graph. Note that various
other options are available. There is no problem trying these to see how
you get on.
You can use the options in the context box to save the graph in various formats.
Plot Title
12.1
12.05
6.1
LRM (left)
LRY (right)
6.05
12
11.95
left-axis name
11.9
5.95
11.85
11.8
5.9
11.75
Pright-axis name
6
5.85
11.7
11.65
5.8
11.6
11.55
5.75
1974
1976
1978
1980
1982
1984
1986
x-axis name
Figure 5: Sample Gretl Graph
3
Econometric Packages
This is a brief list of Packages used in Econometrics
STATA STATA is a general purpose statistical package. It can manage large
data sets. It offers good facilities for the analysis of cross-section and
panel data. In economics a cross-section data set contains data on collection of economic agents at a given point in time. The Irish Household
8
Budget Survey is an example of a cross-section data set The last household budget survey conducted by the CSO collected consumption data
on 8000 households and details of their Principal Economic Status, Occupation, Industry, Household Composition, Social Economic Groups,
Social Class, Farm Acreage, Town Size and Regional Authority, Accommodation type, Household Tenure. A panel data set follows the economic agents over a period of time and repeats the measurement process for each agent in each period.
MATLAB. MATLAB is an interactive system for numerical computation. From
our point of view the basic variable in MATLAB is a MATRIX and you
transcribe the matrix algebra from your text into MATLAB and it does
the calculations
EVIEWS EVIEWS is an econometric package which has good facilities for time
series analysis.
Various other econometric/statistical packages are also available. I have
used most of the packages in the following lists at some stage or another.
SAS or SPSS. These are large general statistical packages.
MICROFIT. MICROFIT is a very easy to use econometric package which is
available on the TCD network. It is good for time series analysis. Some
of you may have used it in undergraduate econometrics.
RATS. RATS like EVIEWS is particularly good for time-series analysis.
Mathematica and Maple. These are packages for symbolic mathematical manipulation which also can be used for numerical analysis. They have
widespread use in Finance and Economics. You may find it useful for
checking some symbolic mathematical calculations.
There are also various other packages that are of interest to economists.
The following programs are distributed under various free licences and are
available for download.
9
LATEX LATEXis a typesetting program for scientific papers and books. Most journals and many publishers can accept and some insist on submission in
LATEX. If you are likely to produce papers and books with a large mathematical content some variant of TEX or LATEXis the best choice. This
document and other nots distributed here were prepared in LATEX
OpenOffice (or LibreOffice). OpenOffice is a free office suite that is almost
100% compatible with Microsoft Office.
Calc the spreadsheet in the
OpenOffice suite is recommended for transferring data between programs and I use it for that purpose in preference to Excel. The new
version 3 of OpenOffice can read MS Office 2007 files. LibreOffice is a
fork of OpenOffice
Gnumeric. Gnumeric is a free Excel type program. The numeric methods in
Gnumeric are more accurate than those in other spreadsheets.
Abiword. Abiword is a free word processor. Abiword and Gnumeric integrate
better with LATEX than Microsoft office or OpenOffice
Scilab or Octave These are similar in function to Matlab. The recently launched
version 3 of Octave runs much easier in Windows than the earlier versions. Base Octave has more data analysis and statistical functions than
base Matlab. Scilab has the same functionality as Matlab but a slightly
different syntax. It does contain an automatic translator for Matlab programs. It has a very good econometric toolbox (GROCER) which can
complete most econometric estimation procedures.
R R is a general statistical package which is the result of worldwide collaboration between a large number of statisticians. R and its associated
packages is, to my knowledge, the most powerful and up to date of all
data analysis/statistical packages. The editor RStudio provides a graphical interface to R (see also SciViews, RCommander and JGR and Tinn-R
for alternative GUIs).
Gretl Gretl is a free econometric package that has been considerably developed over the last years. In certain respects it is like STATA but is much
10
simpler as it concentrates on econometrics. It has interfaces to R and
Octave for problems not covered by Gretl.
jMulti jMulti is a relatively new package with a strong emphasis on timeseries analysis. It works through a modern graphical user interface and
is very easy to use.
Maxima Maxima is a package for symbolic manipulation. Unless your work
is very esoteric or you have a specific need for some of the special packages facilities in Maple or Mathematica, Maxima is an excellent alternative and will meet the needs of many users for free.
Many of these free packages provide facilities that are on a par with or
even better than their commercial equivalents. They are also available on
many varieties of Linux and on MAC PCs. They can be downloaded from the
internet and put into operation in a matter of minutes. Acquiring a copy of
Stata may or similar may take days or longer - particularly if a request has to
submitted through a central purchasing department.
11