1
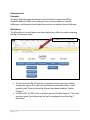
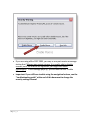
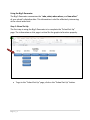
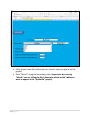
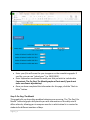
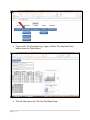
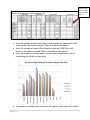
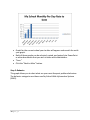
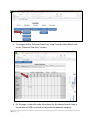
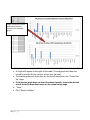
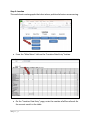
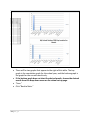
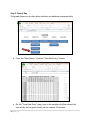
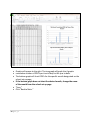
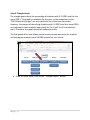
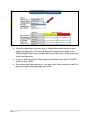
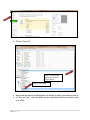
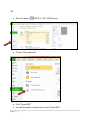
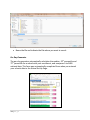
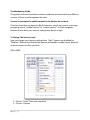
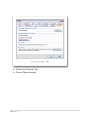
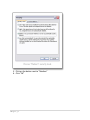
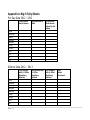
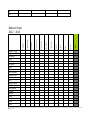
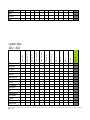
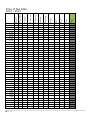
Using the Big 5 Generator Contents Getting Started ....................................................................................................................................................... 3 Using the Big-5 Generator ................................................................................................................................. 5 Step 1: School Set Up ....................................................................................................................................... 5 Step 2: Per Day/ Per Month.......................................................................................................................... 7 Step 3: Behavior ............................................................................................................................................. 10 Step 4: Location.............................................................................................................................................. 13 Step 5: Time of Day ....................................................................................................................................... 15 Step 6: Triangle Graph ................................................................................................................................. 17 Step 7: Printing Graphs and Saving as PDF ......................................................................................... 20 OR ............................................................................................................................................................................. 23 Per Day Generator......................................................................................................................................... 24 Trouble Shooting ................................................................................................................................................ 25 You are not prompted to enable content or the buttons do not work ..................................... 25 Office 2003: ................................................................................................................................................. 25 For Office 2007 and 2010: .................................................................................................................... 29 School name does not appear on graphs ............................................................................................. 30 Wrong month appears on the graph title and data for the wrong month is charted.......... 31 You click in a cell, and receive an error message, or another blank cell is “selected.” ....... 31 Error Message: “Converter Failed to Save File”................................................................................. 31 Other................................................................................................................................................................... 31 2|Page Getting Started Rationale: The Big-5 Generator was developed to assist schools in organizing Office Discipline Referral (ODR) data, making it easier to track progress, identify challenges, and develop school-wide interventions to address these challenges. Main Menu: The Main Menu is a new feature we have added in an effort to make navigating the Big-5 Generator easier. To enable macros, click here. The first time the Big-5 Generator is opened, macros must be enabled. Usually this option is in a bar just below the Excel toolbar ribbon. It will typically read “Security Warning! Macros have been disabled. Enable Content.” In Office 2007 or 2010, click on the box marked “Enable Content.” Once this has been done, the buttons can be used to navigate around the Big-5 Generator. 3|Page If you are using office 1997-2003, you may or may not receive a message stating that “Macros may contain viruses. It is usually safe to disable macros, but if the macros are legitimate, you might lose some functionality.” If this message pops up, you will want to click “Enable Macros.” Important: If you still have trouble using the navigation buttons, see the “troubleshooting guide” at the end of this document to change the security settings in excel. 4|Page Using the Big-5 Generator The Big-5 Generator summarizes the “who, what, when where, and how often” of your school’s discipline data. This information is vital for effectively intervening at the school wide level. Step 1: School Set Up The first step in using the Big-5 Generator is to complete the “School Set-Up” page. The information on this page is critical for the graphs to function properly. To go to the “School Set-Up” page, click on the “School Set-Up” button. 5|Page Enter school name (this will cause your school’s name to appear on the graphs). Enter “Month” using the drop down menu (Important: by entering “Month” you are telling the Big-5 Generator which month’s data you want to appear in the “By Month” graphs). 6|Page Enter year (this will cause the year to appear on the cumulative graphs. If you like, you can use “school year” (i.e. 2012/2013). Enter September enrollment for each year that you wish to include data (Important: The Per Day/ Per Month graphs will not work if you do not enter enrollment information). Once you have completed the information for this page, click the “Back to Main” button. Step 2: Per Day/ Per Month This graph tells you how often problem behaviors are occurring. The “Per Day/ Per Month” table and graphs will provide you with information on the daily rate of office referrals, allowing you to compare months in which school is in session for students for different numbers of days. 7|Page To go to the “Per Day Data Entry” page, click the “Per Day Data Entry” button from the “Main Menu.” This will take you to the “Per Day Per Month Page. 8|Page Enter Data for current school year here. Enter the number of days that school was in session for students for each month under the column marked “Days of Student Attendance.” Enter the number of major office discipline referrals (ODR’s) for each month in the column marked “Major referrals for that month.” If you have data for multiple years, you can track changes over time by completing the table for those years. The graph for multiple years over time will appear to the right of this table. 9|Page Graph for the current school year to date will appear underneath the multiyear graph. Both of these graphs can be selected, copied, and pasted into PowerPoint or other documents that you wish to share with stakeholders. “Save.” Click the “Back to Main” button. Step 3: Behavior This graph allows you to chart what are your most frequent problem behaviors. The behavior categories are those used by School Wide Information Systems (SWIS). 10 | P a g e To navigate to the “Behavior Data Entry” page, from the Main Menu, click on the “Behavior Data Entry” button. On this page, in the cells under the column for the desired month, type in the number of ODR’s received in that particular behavior category. 11 | P a g e Make certain the correct month and data are shown in the monthly graph A Graph will appear to the right of this table. The top graph will show the trends by months for the current school year (to date). The bottom graph will chart data for the month entered on the “School SetUp” page. If the bottom graph does not chart the desired month, choose the desired month from the drop down menu on the school set up page. “Save.” Click “Return to Main” 12 | P a g e Step 4: Location This worksheet creates graphs that chart where problem behaviors are occurring. From the “Main Menu” click on the “Location Data Entry” button. On the “Location Data Entry” page, enter the number of office referrals for the current month in the table. 13 | P a g e There will be two graphs that appear to the right of this table. The top graph is the cumulative graph for the school year, and the bottom graph is the graph for the current month only. If the bottom graph does not chart the desired month, choose the desired month from the drop down menu on the school set up page. “Save.” Click “Back to Main.” 14 | P a g e Step 5: Time of Day This graph allows you to chart when students are behaving inappropriately. From the “Main Menu,” click the “Time Data Entry” button. On the “Time Data Entry” page, type in the number of office referrals by time of day for the given month, to the nearest 15 minutes. 15 | P a g e Graphs will appear to the right. The top graph will graph the A graphs cumulative number of ODR’s per time of day for the year to date. The bottom graph will chart ODR’s for the specific month designated on the school set up page. If the bottom graph does not chart the desired month, change the name of the month from the school set up page. “Save.” Click “Back to Main.” 16 | P a g e Step 6: Triangle Graph The triangle graph charts the percentage of students with 2-5 ODR’s and the 6 or more ODR’s. This graph is cumulative for the year, so the comparison to the “SWIS National Averages” are only valid once the school year has ended. However, the process of identifying students with 2-5 ODR’s and 6 or more ODR’s can help you to catch students who qualify for Tier II and Tier III interventions early. Therefore, this graph should be updated monthly. The final graph of the year allows you to monitor annual outcomes for students and to progress monitory your SW-PBS systems for your school. From the Main Menu, click on the “Triangle Graphs” button. 17 | P a g e Using the drop down menu on step 1, choose the option closest to your school configuration. This sets the National Comparison triangle to the SWIS National Data Norms established the previous year for that particular school configuration. In step 2, enter the year to date number of students who have 2-5 ODR’s and 6 or more ODR’s. If you have data from past year’s, you may enter these numbers as well, to give you a graph showing long term trends. 18 | P a g e National Comparison Grades k-6 My School The generator will produce 2 graphs. The first is a triangle showing your school’s data to the right of the National Comparison for your school’s grade configuration. The other graph depicts long term trends for up to the last four years. 19 | P a g e Graphs on this page can be selected, copied and pasted into other office documents to share with stakeholders. If you want to print from this page, click anywhere off of the graphs and print as you normally would. Only the graphs will print. “Save.” Click “Back to Main.” Step 7: Printing Graphs and Saving as PDF All 5 of the Big-5 Graphs are now on the printing pages. There is a page that shows cumulative data for the year, as well as multi-year data for the Per Day Per Month and Triangle Graphs. There is also a page that allows you to print your Big5 graphs for any given month (provided you selected that month on the school set up page, and you have entered complete data for that month). From the Main Menu, choose the graphs you wish to print (Monthly or Cumulative). This will take you to the desired print page. 20 | P a g e This page is protected. If you wish to select copy and paste a graph, you must go to the data entry page for the desired graph. This was done to make printing easier. To print, print as you normally would print from Excel. Creating a PDF in Office 2007 and 2010 To create a PDF, you may do one of two things: Go to the button 21 | P a g e (2007) or “File” (2010) menu. Click on “Save As” Step 1: Click down arrow on “Save as Type” menu Step 2: Click PDF Name the document and designate the folder in which you want to save it. In “Save as Type”, click the down arrow, and indicate that you want to save it as a PDF. 22 | P a g e OR Go to the button (2007) or “File” (2010) menu. Click on “Save and Send” Click “Create PDF.” You will be asked a second time to click “Create PDF.” 23 | P a g e Name the file and indicate the file where you want to save it. Per Day Generator The per day generator automatically calculates the median, 25th percentile and 75th percentile for a school with your enrollment, and compares it to SWIS national data. This form was automatically completed from when you entered your schools data in the School Set Up Page. 24 | P a g e Troubleshooting Guide This guide is intended to address common problems associated with the different versions of Excel used throughout the state. You are not prompted to enable content or the buttons do not work If the first time that you open the Big-5 Generator you do not receive a message prompting you to “enable content” or “enable macros,” and the navigation buttons do not work, your security settings may be set to high. To Change The Security Level How you change your security settings from “High” (macros are disabled) to “Medium” (Macros are disabled but you are prompted to enable them) depends on what version of office you have. Office 2003: 1. Click on “Tools” from your menu bar 2. Click on “Options 25 | P a g e 3. Click on the “Security” tab 4. Click on “Macro Security” 26 | P a g e 5. Click on the button next to “Medium” 6. Click “OK” 27 | P a g e By selecting Medium, you will receive a warning every time you try to open a file with macros. For the Big-5 Generator, you will need to enable the Macros. For other programs, enable macros only if you trust the source. 28 | P a g e For Office 2007 and 2010: You can change macro security settings in the Trust Center, unless a system administrator in your organization has changed the default settings to prevent you from changing the settings. Click here to enable change security level On the Developer tab, click “Macro Security.” o If the Developer tab is not displayed, click the Microsoft Office Button , click Excel Options, and then in the “Popular” category, under “Top options for working with Excel,” click “Show Developer tab in the Ribbon.” 29 | P a g e Click “disable all macros with notification” In the Macro Settings category, under Macro Settings, click “Disable all macros with notification.” The Microsoft office button was replaced by the “File” tab in office 2010 The information on changing security settings in Office 2007 and 2010 came from http://office.microsoft.com/en-us/excel-help/change-macro-security-settings-inexcel-HP010096919.aspx. School name does not appear on graphs From the “Main Menu,” click the “School Set-Up” button. Enter the school name in the designated space. 30 | P a g e Wrong month appears on the graph title and data for the wrong month is charted From the “Main Menu,” click the “School Set Up” button. Choose the desired month from the drop down menu for “Month.” This will cause the graphs to reflect data from the desired month. You click in a cell, and receive an error message, or another blank cell is “selected.” The Big-5 Generator has been protected to prevent users from inadvertently deleting a formula that generates the graph. You may only click on or enter data into yellow cells. You cannot select, copy, or paste a graph from the Print pages The Print pages (cumulative and monthly) are protected to make printing easier. You may select, copy and paste graphs on the data entry pages. Error Message: “Converter Failed to Save File” Finally, there is one other possibility for those of you who are having trouble converting this file to earlier versions of Excel. Apparently, there was a problem with one of the Microsoft converter service packs. The converter at the following link is supposed to solve the problem. This has worked. Some districts will only allow individuals with administrator rights to load files or do updates. The link is: http://www.microsoft.com/download/en/details.aspx?displaylang=en&id=1285. Other If you encounter a problem that is not addressed in this User’s Manual, you may contact your SW-PBS consultant, or call Gordon Way at 816-235-5656. 31 | P a g e Appendix A: Big-5 Tally Sheets Per Day Data 2012 - 2013 # Days School was in Session Major Referrals for Month Per Day Rate – Divide second column by first column August September October November December January February March April May June Referral Data 2012 – 2013 Total Students with 0-1 Office Disciplinary Referrals August September October November December January February March April 32 | P a g e Total Students with 2-5 Office Disciplinary Referrals Total Students with 6+ Office Disciplinary Referrals Total School Enrollment May June Inappro. Lang Aggression/Fight Disrespect Lying Harass Disruption Tardy Skip Prop Damage Forgery/Theft Dress Tech Inappro. Affect. Out Bounds Gang Display Tobacco Alcohol Drugs Combust Bomb Arson 33 | P a g e YEAR June May April March February January December November October September August Behavior Data 2012 - 2013 Weapons Other Unknown Total Classroom Playground Commons Hall/Breezeway Cafeteria Bath/Restroom Gym Library Bus Loading Parking Lot Bus Special Event Off-Campus Stadium Office Locker Room 34 | P a g e YEAR June May April March February January December November October September August Location Data 2012 - 2013 Other Location Unknown Location Totals 35 | P a g e 7:00 7:15 7:30 7:45 8:00 8:15 8:30 8:45 9:00 9:15 9:30 9:45 10:00 10:15 10:30 10:45 11:00 11:15 11:30 11:45 12:00 12:15 12:30 12:45 1:00 1:15 1:30 1:45 2:00 2:15 2:30 2:45 3:00 3:15 3:30 3:45 4:00 4:15 4:30 4:45 Total 36 | P a g e YEAR June May April March February January December November October September August Time of Day Data 2012 - 2013 37 | P a g e