1
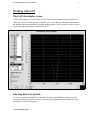
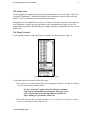
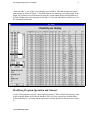
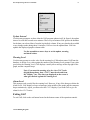
GAS ANALYSIS PROGRAM
(GAP)
USER’S MANUAL
Table of Contents
Document Layout . . . . . . . . . . . . . . . . . . . . . . . . . . . . . . . . . . . . . . . . 1
Installation and Setup . . . . . . . . . . . . . . . . . . . . . . . . . . . . . . . . . . . . 2
Requirements . . . . . . . . . . . . . . . . . . . . . . . . . . . . . . . . . . . . . . . . . . . . . . . . . . . . . 2
Installing GAP . . . . . . . . . . . . . . . . . . . . . . . . . . . . . . . . . . . . . . . . . . . . . . . . . . . . 2
Working with GAP . . . . . . . . . . . . . . . . . . . . . . . . . . . . . . . . . . . . . . 3
The GAP data display screen . . . . . . . . . . . . . . . . . . . . . . . . . . . . . . . . . . . . . . . . 3
Selecting data to be plotted . . . . . . . . . . . . . . . . . . . . . . . . . . . . . . . . . . . . . . . . . . 3
The Graph Area . . . . . . . . . . . . . . . . . . . . . . . . . . . . . . . . . . . . . . . . . . . . . . . . . 4
The Graph Controls . . . . . . . . . . . . . . . . . . . . . . . . . . . . . . . . . . . . . . . . . . . . . . 4
Modifying Program Operation and Alarms! . . . . . . . . . . . . . . . . . . . . . . . . . . . . . 5
Update Interval . . . . . . . . . . . . . . . . . . . . . . . . . . . . . . . . . . . . . . . . . . . . . . . . . 6
Warning Level . . . . . . . . . . . . . . . . . . . . . . . . . . . . . . . . . . . . . . . . . . . . . . . . . . 6
Alarm Level . . . . . . . . . . . . . . . . . . . . . . . . . . . . . . . . . . . . . . . . . . . . . . . . . . . . 6
Exiting GAP . . . . . . . . . . . . . . . . . . . . . . . . . . . . . . . . . . . . . . . . . . . . . . . . . . . . . 6
Panning and Zooming Options . . . . . . . . . . . . . . . . . . . . . . . . . . . . . . . . . . . . . . . 7
Table of Figures
Figure 1.
Figure 2.
Figure 3.
Figure 4.
Figure 5.
Figure 6.
The main window of GAP . . . . . . . . . . . . . . . . . . . . . . . . . . . . . . . . . . . . 3
Select data to be displayed here . . . . . . . . . . . . . . . . . . . . . . . . . . . . . . . 4
Example of the “Element Table” display type. . . . . . . . . . . . . . . . . . . . . 5
Program operations . . . . . . . . . . . . . . . . . . . . . . . . . . . . . . . . . . . . . . . . . 6
Graph palette . . . . . . . . . . . . . . . . . . . . . . . . . . . . . . . . . . . . . . . . . . . . . . 7
Available zoom modes . . . . . . . . . . . . . . . . . . . . . . . . . . . . . . . . . . . . . . 7
Gas Analysis Program User’s Manual
1
Introduction
The Gas Analysis Program (GAP) is designed to aid the user in obtaining gas element analysis
for an entire hole. This program plots C1/C2 and C1/C2+ ratios, and can also be used as a
warning tool for undesirably high concentrations of C2.
Document Layout
This document is broken into two main sections, with several subsections. The first section
describes the installation and setup requirements of GAP. The second section gives detailed
instructions on how to use GAP and how to utilize the main operating window.
Ocean Drilling Program
Gas Analysis Program User’s Manual
2
Installation and Setup
Requirements
The following items must be available in order to install and run GAP:
• A 486 or higher IBM-compatible computer with a minimum 8 MB of RAM (16 MB
recommended).
• A hard disk drive with at least 1 MB of free disk space.
• VGA or higher resolution monitor.
• Windows 3.1
• LabView 4.0
• DataView Oracle 7 drivers.
• ODBC.
Installing GAP
To install GAP on your computer, follow these steps:
1. Create a directory where you want GAP installed (e.g. C:\ GAP).
2. Copy the GAP program file to the directory you created. The program file is either provided as a diskette, or must be taken from the server. The file name is C1_C2.LLB.
3. Create an icon on your desktop for GAP. The command line for the icon should run LabView. Be sure to give it the path and filename to the GAP program file (e.g. C:\LABVIEW\LABVIEW.EXE and C:\GAP\C1_C2.LLB). The working directory for the
program should be the directory you created (e.g. C:\GAP).
4. Setup an ODBC data source named “janus”, which uses an oracle driver to access the
Janus database. Do this using ODBC administrator. Then test the new data source to
make sure it is activated. Do this using software such as ODBCTEST, or MSQUERY.
5. If you were provided with a diskette distribution of GAP, remove the diskette and store
in a safe place.
Ocean Drilling Program
Gas Analysis Program User’s Manual
3
Working with GAP
The GAP data display screen
Use the main, and only, screen in GAP to view any of the gas element analysis results for an
entire hole. This screen also plots C1/C2 and C1/C2+ ratios. Because data that is uploaded to
the database becomes immediately available in this program, GAP can also be used as a warning tool for undesirably high concentrations of C2.
Figure 1. The main window of GAP
Selecting data to be plotted
GAP uses a standard Graphical User Interface. However, not all features on this screen are
accessible from the keyboard. A mouse is necessary for graphical tools that control the scales,
resolution or position of the plots.
Ocean Drilling Program
Gas Analysis Program User’s Manual
4
The Graph Area
Use the graph area to display results from gas element analysis for an entire hole. The Y-axis
is labeled “Depth(mbsf)”, indicating the depth of each data point in meters below sea-floor
(mbsf). The X axis indicates the gas analysis measurement.
The graph area is surrounded by several sets of controls. Use these controls to select the data
to be displayed, to modify program operations, and to manipulate the display or plot. The
graph control, operations, and planning and zooming controls are explained in the next several
subsections.
The Graph Controls
Use the graph controls to select the data to be displayed on the graph (See Figure 2).
Figure 2. Select data to be displayed here
To select the data to be plotted, follow these steps:
1. Select the leg, site and hole from the list box displayed in Figure 2. Do this by clicking
on your selection once with the mouse.
Use the “*Current*” option in the list of holes to automatically find the current hole in the database. This may or may
not be the first hole in the list, depending on whether the
ship is drilling at a previously visited site.
2. Select the data type that you wish to display (e.g. C1/C2 ratio, etc.). Do this by clicking
once on your selection from the “Display” list.
Ocean Drilling Program
Gas Analysis Program User’s Manual
5
“Element Table” is one of the several display types available. This table displays the actual
data numbers as shown in Figure 3. The table contains one sample per row, the sample id, the
depth, and a column for each element. Because the screen cannot display all information, by
default it displays the top left portion of the table. Use the side and bottom scroll bars to view
the remaining information.
Figure 3. Example of the “Element Table” display type.
Modifying Program Operation and Alarms!
Use the GAP program to specify certain operating features. These include the frequency with
which it should update itself from the database, the level of the selected gas element below
which it should give a warning, and the ratio below which it should give an alarm (See Figure
4).
Ocean Drilling Program
Gas Analysis Program User’s Manual
6
Figure 4. Program operations
Update Interval
Use this entry prompt to set how often the GAP program updates itself. In figure 4 the update
interval is set at 600 seconds or ten minutes. Thus every ten minutes GAP queries the database
for the data you selected above from the leg/site/hole column. If any new data has been added
or any changes made during those 10 minutes, GAP receives the updated data. GAP also
updates the displayed graph or element table.
Use the up and down arrow keys to set the update, warning
and alarm values.
Warning Level
Use this entry prompt to set the value for the warning level. When data enters GAP from the
database, it checks every value against the number in the Warning Level prompt. If any value
goes below the Warning Level, GAP displays a small yellow message on the top right of the
graph, and the computer beeps.
Note: if you want the warning to be for a low C1/C2 ratio
(high hydrocarbons), then “C1/C2” must be selected from
the “Display” box. The data type displayed on the screen is
what gets checked against the warning level.
Alarm Level
This prompt works exactly like the warning level. However, if any of the data goes below the
Alarm Level, GAP displays a large red message in the middle of the graph, and the computer
beeps continuously. Again, you must select the C1/C2 display if you want GAP to give an
alarm for low C1/C2 ratios.
Exiting GAP
To exit GAP, click on the exit button located at the bottom corner of the operation controls.
Ocean Drilling Program
Gas Analysis Program User’s Manual
7
Panning and Zooming Options
A Graph palette is included with the graph area (See Figure 5). This palette has controls for
panning (scrolling the display area of a graph) and for zooming in and out of graph sections.
X scale format
X autoscale button
Y autoscale button
Zooming Tool
Figure 5. Graph palette
Panning Tool
Y scale format
• Click on the X Acoustical button to autoscale the X data of the graph.
• Click on the Y Autoscale button to autoscale the Y data of the graph.
• Click on the scale lock buttons (to the left of the autoscale buttons - not shown in Figure 5) to autoscale either of the scales when the program retrieves data from the database. To turn continuous autoscaling off, click again on the autoscale lock switch.
• Use the scale format buttons to control the format of the X and Y scale markers.
• Use the remaining three buttons to control the operation mode for the graph. Normally
this is standard operations mode, indicated by the plus or crosshatch.
• Click on the Panning tool to switch to a mode in which you can scroll the visible data
by clicking and dragging sections of the graph.
• Click on the Zoom tool to zoom in on a section of the graph by dragging a selection
rectangle around that section. Clicking on this tool opens a pop-up menu for selecting
the zooming method (See Figure 6).
Figure 6. Available zoom modes
The following are descriptions of each zoom mode.
Ocean Drilling Program
Gas Analysis Program User’s Manual
8
Zoom by rectangle.
Zoom by rectangle, with zooming restricted to x data (the y scale remains unchanged).
Zoom by rectangle, with zooming restricted to y data (the x scale remains unchanged).
Undo last zoom. Resets the graph to its previous setting.
Zoom in about a point. If you hold down the mouse on a specific point, the graph continuously
zooms in until you release the mouse button.
Zoom out about a point. If you hold down the mouse on a specific point, the graph continuously zooms out until you release the mouse button.
Note: For the last two modes (zoom in and zoom out about a
point) clicking on the “Shift” button at the same time as one
of these buttons zooms in the other direction.
Ocean Drilling Program