1
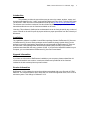
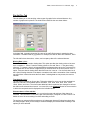
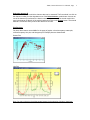
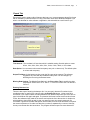
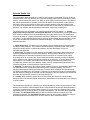
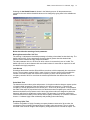
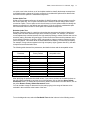
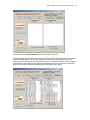
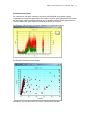
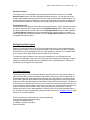
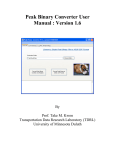
TDRL, DetectorExtractor V3.5 Manual, Page
Detector Data Extractor V3.5
User Manual
Provided by
Transportation Data Research Laboratory
A Division of Northland Advanced Transportation Systems Research Laboratories
University of Minnesota Duluth
Released Date: Sep 9, 2005
Table of Contents
Installation, Upgrade, Upgrade Information, 2
File Tab, 3
Plot Vol/Occ Tab, 4
Export Tab, 9
Detector Health Tab, 11
Exiting From the Program, 16
Concluding Remark, 16
1
TDRL, DetectorExtractor V3.5 Manual, Page
2
Introduction
This software provides the user with an easy-to-use tool to extract, analyze, export, and
visualize traffic data from the “*.traffic” archived files (Minnesota Twin Cities’ Freeway traffic data).
The archived *.traffic files can be downloaded from the ftp site ftp://tdrl.d.umn.edu/pub/tmcdata/.
The software user interface consists of four tabs divided by different groups of functions. This
manual describes how to use the functions available on each tab.
Licensing: This software is distributed as a shareware that can be freely shared by any number of
users. It should not be sold for profit by anyone without a proper permission from the University of
Minnesota.
Installation
The installation software is available in two different package formats: DetExtractorV3_5Inst.exe
or DetExtractorV3_5Inst.msi. Both packages can be installed by simply double clicking on the
software’s icon after downloading. Most people should download the DetExtractorV3_5Inst.exe
file and install. It was packaged with the Microsoft Installer (MSI) internally to minimize the
problems associated with the wrong versions of MSI. If you have the latest MSI installed on your
computer, you can download the DetExtractorV3_5Inst.msi file and install.
Upgrade Information
If you have an old version of DetExtractor installed on your computer, please uninstall the old
version and install this new version. It works much faster and provides all of the functions
included in the old versions plus many new functions.
Version Information
DetExtractor V3.5 is released to correct the problems associated with a new file order in RTMC
data files. The old format (before April, 2005) was in a numerical magnitude order, but it is now in
a dictionary order. This change is reflected in V3.5.
TDRL, DetectorExtractor V3.5 Manual, Page
3
File Tab
If you have successfully installed the software, you can run the software from the Windows
Start/TrafficExtract menu. The initial screen is shown below. The Plot vol/occ , Export and
Detector Health tabs are disabled until you actually load the data. The File tab is used to load a
*.traffic file and serves as a starting point for the rest of functions.
A *.traffic file is a zip compressed file that contains many detector files. The file name of each
detector contains the detector ID. If you wish to check the detector file information, check mark
the option given as “Save the detector file info to a text file”. The text file is save into the
installation directory with the file name “zipFileInfo.txt.” This file can be viewed using a Notepad or
any text editor and shows the number of files, compressed size, extract size, and file names.
Click on the Browse and Load button.
This button allows you to extract the detector list and enables the rest of the tabs. Clicking this
button will open a file dialog and lead you to select a *.traffic file as shown below.
Select the desired file and click the open button. Then the software will start extracting the
detector list and build a table. After the detectors are loaded a message box will appear on the
screen prompting the user that the loading of data has been completed. Click OK to proceed.
You may exit anytime from the software by clicking on the Exit button or the X button of the
window.
TDRL, DetectorExtractor V3.5 Manual, Page
4
Plot Vol/Occ Tab
This tab allows you to view and plot various types of graphs for the selected detector. Any
number of graphs can be plotted. The initial screen looks like the one shown below:
In the date field, it actually shows the file name of the traffic file because it contains the date
information. The date format is yyyymmdd. For example, the date of above file is March 5, 2003.
The left side list box shows time, volume, and occupancy data of the selected detector.
Missing Data options
The detector data may contain missing data. This option provides the missing value to be set to
zero or negative 1. “Set to 0” sets the missing values to zero and “Set to –1” sets the missing
values to –1. However, there is an important difference between them when the Time Interval is
set to higher than 30 sec interval. Suppose that you selected 5min as the time interval. In the –1
option, if any raw data is missing within that 5min time slot, it sets to –1 for the 5min data, but in
the 0 option missing data slot of raw data is counted as zero and the summation of the remaining
non-zero 30sec volumes becomes the 5min data. If missing data are not present, the result is
identical
Time Interval options
The raw data is available as 30 sec data. This option allows for you to convert the raw data into
other time intervals. The available options are 30sec, 1min, 2min, 3min, 4min, 5min, 10min,
15min, 30min, and 1hour. The volumes are added and the occupancies are averaged to convert
the data into the selected time interval. You must click on the Compute Button for the conversion
in which the computed result is displayed on the left-side list box.
Plot start time and Plot end time
Using the dropdown combo buttons, you can select the start and end time of the data to be
extracted. This information is used in the plot routines and the “Compute Vol Total” routine. The
default is set to 24 hours starting from 0:00 and ending at 23:59.
The options you selected will be persistent to all subsequent detector ID selections unless they
are changed again. Now you are ready to extract and display the detector data according to the
options you have selected.
TDRL, DetectorExtractor V3.5 Manual, Page
5
Select the detector ID
There are two methods in which the detector data can be extracted. The first method is to click on
the detector number from the dropdown menu of the Select detector combo button. As soon as
one of the detector ID is selected, the data is automatically extracted. The second method is to
type in the detector ID directly in the text box and then to click on the Extract button. The second
method is convenient when you know the detector ID number.
Plot Routines
For plots, three buttons are available for the types of graphs: volume/occupancy scatter plot,
volume/occupancy line plot, and histogram plot. Example plots are shown below.
Scatter Plot
Line Plot
Note: You may uncheck or check the square buttons for the selection of single or both lines.
TDRL, DetectorExtractor V3.5 Manual, Page
Histogram
Important: Graphs can be edited using the built-in editing tool by clicking one
of the left or right axis.
Graph Editing Tool
6
TDRL, DetectorExtractor V3.5 Manual, Page
Two examples of manipulated graphs using the editing tool are shown below. You may play with
other variations.
The scatter graph was changed to 3-D rendering.
The scatter graph is shown using a line graph to show the inter relation between the data points.
*** The Data tab in the editing tool would be an interesting one if you wish to see the actual
plotted data.
7
TDRL, DetectorExtractor V3.5 Manual, Page
8
Computing Volume Total
Volume total of any time span within a day for the selected detector can be computed using the
Compute Vol Total button. For the total computation, it uses the time selection done using the
“Plot Start Time” and “Plot End Time” in the dropdown combo buttons, so you may need to adjust
the “Plot Start Time” and “Plot End Time” for the different choice of the time span. The screen
portion of “Compute Vol Total” in the “Plot vol/occ” tab is shown below.
TDRL, DetectorExtractor V3.5 Manual, Page
9
Export Tab
Export tab is used to extract a list of detector data into a csv (comma separate values) file format
that is readable by a Microsoft Excel or using a text editor such as the Windows Notepad. If you
wish to use the data for other software or application, this tab would be a useful tool for you.
Setting Options
Time Interval: The raw data is 30 sec data, which is a default setting. Set this option to create
30sec, 1min, 2min, 3min, 4min, 5min, 10min, 15min, 30min, or 1hour data.
Data Option: You can extract volume and occupancy as a pair or volume only. The default option
is volume and occupancy.
Output File Name: At the bottom text box, enter the file name to be exported. The software
suggests a file name with the installation folder path. You can change it by
browsing the files using the Browse button.
Missing Data Options: The Missing Data Options in the Plot vol/occ Tab is used for the data
computation. Select “Set to 0” or “Set to –1” in the Plot vol/occ tab. The default is
“Set to 0”.
Entering Detector List
There are two ways of entering the detector list. You can type in detector ID numbers in the
provided text box or read in from a text file using the Browse File button. Using a text file is
convenient if you need to extract the same detectors from different days since you don’t have to
type in the detector IDs again and again. The detector list format is same as the text box format.
In fact, the software simply reads in the text file and copies the list to the text box. A simple rule,
which applies to the text box as well, is that you cannot put any non-numeric texts such as
comments. It ignores line breaks and spaces, which means, the line break itself does not replace
the comma requirement. So make sure that every number is separated by a comma. However,
do not put a comma after the last number. The program will then expect one more detector ID
TDRL, DetectorExtractor V3.5 Manual, Page 10
that does not exist, so it will give an error message. The text file should have a ".txt" extension,
for example, "DetList.txt". Below is a correct text file entry example.
100, 200, 300,
400, 500,
600
After all settings are done and a list of detectors entered or loaded from a file,
simply click on the Export to File (*.csv Format) button. The data will then be
generated and the user will be informed for the successful generation and saving of the csv
export file.
TDRL, DetectorExtractor V3.5 Manual, Page 11
Detector Health Tab
The loop detector data collected as a *.traffic file may contain incorrect data. This can be due to
hardware faults in the loop detector card, loop-wire breakage, bad sensitivity calibrations, power
failures, communication-link failures, etc. Many of these faults are reflected onto the final data of
the detector and analysis of this data can be used to deduce the faulty status of each detector.
Although it would not be possible to detect every possible problem using data analysis alone
since some of the problems may not be visible from the data, a wide range of problems can be
detected. This software was designed as an automated, single-step screening tool.
The objective this part of software is to classify the detectors into four classes, i.e., healthy,
highly suspicious, suspicious, and marginal detectors. This classification is performed based
on a number of statistical and limit parameters that form a big decision tree. This classification
result can be used for a regular maintenance operation of detectors or for screening out data with
low quality. For data applications that require only high quality of data, we recommend the users
to use only the data from the detectors classified as healthy. The classification meaning is
described as below:
1. Highly Suspicious: The detectors in this category show a sustained period of missing data
and imply a faulty condition. This condition could be caused by temporary power failure at the
detector/controller cabinet, communication failures, loop wire breakages, or from not
activated/used detectors.
2. Suspicious: The detectors in this category produce data like a healthy detector and do not
include a sustained period of missing data. However, the data pattern shows one or more of
abnormalities such as exceeding theoretical volume count limits in a certain interval, highly
fluctuating values of occupancy etc. These conditions could be caused by sensing of adjacent
lanes, missing counts, transient connection problems in the loop wire, or severe variation in the
traffic pattern. This category of detectors will need checking of the sensitivity setting in the
corresponding detector card. If the detector counts correctly, the abnormality pattern was likely
caused by incidents or unusual patterns of special events.
3. Marginal: The detectors in this category show a pattern close to a normal healthy detector but
the data pattern does not indicate that the detectors are completely healthy. They are in a
marginal state between healthy and suspicious. Transient faulty conditions and special events
can produce the data type in this category. Therefore, for the benefit of doubt it is recommended
that the sensitivity setting of the detector card and normality of the card operation be checked but
with lower priority than the detectors in the suspicious group.
4. Healthy: When a detector passes all of the test criteria, the detector is claimed healthy.
Except for annual or biannual regular maintenance, maintenance for the detectors in this category
could be omitted.
The classification algorithm is a decision tree, which calculates a number of parameters for each
detector and compares it with threshold values. These threshold values were determined based
on numerous experiments of testing data. However, if you are using this screening tool for other
applications such as screening data for unusual traffic patterns, you can modify these parameter
thresholds. The det Health Param tab provides the user the freedom to change any of the
parameter thresholds. The det Health Test tab can then be used to test the detectors using the
specified parameters and classify them in one of the four above-mentioned classes.
TDRL, DetectorExtractor V3.5 Manual, Page 12
Selecting the det Health Param tab shows in the following screen. All the parameters are
exposed to the user and the threshold values can be changed by typing them in the editable text
boxes.
Below describes the meaning of each parameter:
Missing/Consecutive Zero Vol Test
The missing % indicates the threshold percentage of missing volume data for that whole day. The
default value is 20%. If it the percentage of missing data is greater than this threshold the
detector will be classified as highly suspicious detector
The other parameter is the no of hours for which volume is consecutively zero or invalid. The
default value is 4 hrs and a detector with zero/invalid volume for more than or equal to 4 hrs will
be classified as highly suspicious.
Lock On test
Sometimes the detector remains ON and fails to record two vehicles separately but counts them
as one. The occupancy remains 100% in case of lock on. Hence to check for this condition the
number of minutes for which the consecutive occupancy is 100% can be specified. If the
occupancy remains 100% for more than the minutes specified then the detector has a Lock on
problem.
Pulse Mode Test
The detector has two modes: pulse and presence. In the pulse mode the detector outputs a pulse
of constant width irrespective of the time taken by the vehicle to pass over it. Therefore the
occupancy is exactly proportional to the volume (occ = const X vol) at all speeds. In the presence
the width of the output is proportional to the time the detector was occupied by the vehicle. All the
detectors should be set to presence mode. Hence the pulse mode test is designed to detect the
detectors, which are by mistake set to pulse mode. The parameter of correlation coefficient is
used to determine the linearity of the volume and occupancy relationship. A correlation coefficient
closer to 1 indicates highly linear relationship and possibly pulse mode setting.
Occupancy Spike Test
To detect the problem of highly fluctuating occupancy between consecutive 30 sec slots, the
occurrences of the occupancy changing beyond a certain value are counted. The occ spike ht
threshold in the minimum height of the occupancy change which will be counted as a spike. The
TDRL, DetectorExtractor V3.5 Manual, Page 13
occ spike count is the minimum no of such spikes needed to classify the detector as suspicious.
In the default case a change of 40 in the occupancy is considered a spike and if a detector has
more than 30 such spikes it is classified as suspicious.
Volume Spike Test
Similar to the occupancy spike test, the problem of wildly fluctuating volumes is taken care of by
the volume spike test. The vol spike ht threshold in the minimum volume change which will be
counted as a spike. The vol spike count is the minimum no of such spikes needed to classify the
detector as suspicious. In the default case a change of 15 in the volume is considered a spike
and if a detector has more than 25 such spikes it is classified as suspicious.
Deviation Index Test
DevIndex (Deviation Index) is a positive real number that represents a deviation of data from a
healthy state. DevIndex becomes larger as the deviation is greater. For example, if a detector
counts adjacent lane vehicles because of a high sensitivity setting or misses vehicles due to a low
sensitivity setting, DevIndex will grow bigger. Another factor that influences this parameter is the
severe speed irregularity of vehicles, which is observed by a large occupancy variance beyond
normal congestion. Yet another factor includes statistical consistency of volume and occupancy.
For example, if large volumes appear in the high occupancy region (greater than 85%), the data
is suspicious and the devIndex rises.
The following table shows all the parameters, their default values and the acceptable values.
Parameter
Missing Percentage
Consecutive invalid
zeros
Consec 100% occ
Correlation coeff
Occ spike ht
Occ spike count
Vol spike ht
Vol spike count
Susp devindex
Marginal devindex
Factory Default
Acceptable value
20%
4 hrs
0-100%
0-18 hrs
7mins
0.9985
40
30
15
25
15
12
0-1440 mins
0-1
0-100
0-2878
0-30
0-2878
After specifying the parameter threshold values, if you want to set them as the default values so
that they load automatically every time you run the software, click on the blue Set as Default
Parameters button. To restore back to the factory default values listed in the table above, click on
the yellow Restore Factory Default Parameters button.
You can exclude a range of detectors from the test by typing in the range of detectors to be
excluded in the text boxes at the bottom of the form.
To run the diagnostic test, select the Det Health Test tab that is shown in the following screen.
TDRL, DetectorExtractor V3.5 Manual, Page 14
Simply click on the Test All Detectors button to test all the detectors.
The software will then take about two minutes or so to go through all the detectors in the loaded
traffic file and will display a list of highly suspicious detectors on the left list box and a list of
suspicious and marginal detectors on the right side list box. When the software is done analyzing
all the detectors a message box will appear acknowledging that it is done and the “All Detector
Report” button will be activated. A finished screen example is shown below.
TDRL, DetectorExtractor V3.5 Manual, Page 15
Volume/Occupancy Plots
For convenience of analysis, clicking on any items in the classified list generates a graph.
To generate time based line graph, select the “Vol/Occ Line Plot” option placed below the to show
the list of highly suspicious/marginal detector list. To generate a Vol/occ scatter graph select the
“Vol/Occ Scatter Plot” option which are located at the bottom of list boxes.
Plot Example: Highly Suspicious Detector (hardware or communication failure)
Plot Example: Abnormal Vo/Occ Relation
Alternatively, you can also use the Plot vol/occ Tab for plotting the data.
TDRL, DetectorExtractor V3.5 Manual, Page 16
All Detector Report
If you want to see a more detailed report generated by the software, please click on the All
Detector Report button. It will open a Notepad and show the report. You can also use the file
saved in the installation directory with the file name report.txt without opening this software. The
report contains the number of detectors in each group, the detector ID numbers, the reason why
the detector was classified as a suspicious one and also the parameter values for that detector.
Single detector test
The software also provides the functionality to test a single detector. Type in the detector number
you want to test in the text box right above the Test Single Detector button. Please make sure
you enter a valid detector number. Click on the Test Single Detector button to test the detector.
The Single detector report button will be activated when the detector testing is complete. To
view the details about the detector tested click on the Single detector report button. It will open
a Notepad and show the report.
Exiting From the Program
Before you press the Exit button on the File tab, please make sure to close all graph windows
opened by the software. If any opened graph windows exist, the software cannot be completely
closed and it runs in the background. This can create problems in the next run. So please make
sure to close all of the graph windows before closing the main window.
To make sure that the program is not running in the background, you could also open the
“Windows Task Manager” (right click on the empty Start bar and select Task Manager, or type in
taskmgr from Start/Run) and check on the applications tab. If any DetExtractor is running, you
should stop it by clicking the End Task button.
Concluding Remark
This software was evolved from a simple detector data extraction tool to the present version of
many functions. Many people contributed to this software during this evolution. In particular, Dr.
Eil Kwon provided many good suggestions by being a user of this software. A number of users
from Mn/DOT and other public agencies also provided good suggestions as well as bug reports.
Students at TDRL also helped testing of the software, particularly Anushri Parsekar. We thank all
of the contributors. We still have a lot more room to improve this software and will continue to do
so by investing our efforts and time. We welcome any criticism or comments that would help us to
improve this public domain software. Also, we are presently not tracking who is using this
software but wish to know in what application it has been used. We would greatly appreciate it if
you could let us know your applications. Please send any comments to [email protected]. Again
thank you for using this software.
Taek Kwon,Professor of Electrical and Computer Engineering
Transportation Data Research Laboratory
University of Minnesota Duluth
271 MWAH, 1023 University Drive
Duluth, MN 55812
TDRL, DetectorExtractor V3.5 Manual, Page 17