1
MoteView User’s Manual
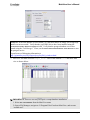
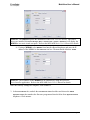
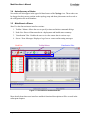
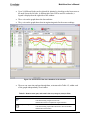
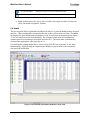
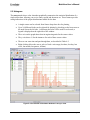
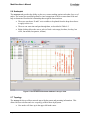
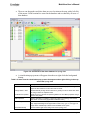
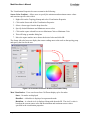
• Up to 24 different Nodes can be selected for plotting by checking on the boxes next to
the node list on the left side. A different plot color will be used for each node; a
legend is displayed on the right side of the window.
• The x-axis on the graph shows the date and time.
• The y-axis on the graph shows data in engineering units for the sensor readings.
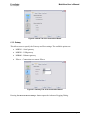
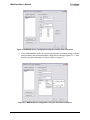
Figure 5-4. Screenshot of the demo database in the Chart tab
• The user can zoom into and pan through data, as instructed in Table 4-2, within each
of the graphs independently of each other.
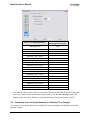
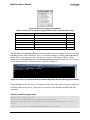
Table 5-1. How to zoom, pan, and reset in the Chart/Histogram/Scatterplot View.
Icon
Desired Action
Instructions
To zoom in
Click on the “Zoom” icon.
Left click and drag a region to zoom into.
Release the mouse to complete the region selection.
To pan through data
Click on the “Pan” icon.
Left click and drag a point within the chart to the new location.
Release the mouse button.
Doc.# 7430-0008-05 Rev. A
Page 21