1
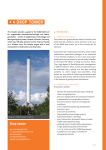
Active Spectrum’s Benchtop Electron Spin Resonance Spectrometers Extended Range Benchtop ESR •4000G sweep range (air cooled) •6500 G sweep range (water cooled) •Compact benchtop design •Competitive pricing •Variable temperature accessories available Technical Data Frequency Resonator Sample Tube Diameter Sweep Range Supply Voltage Data Interfaces Screen Dimensions Mass 9.6 to 9.8 GHz Cylindrical Dielectric Up to 5.8 mm Up to 6500 Gauss (water cooled); Up to 4000 Gauss (air cooled) 120/240 VAC Ethernet, USB, and 802.11 WiFi 21 cm Touch Panel display with Windows 7 Embedded DVI/HDMI/VGA 30.5 x 35.5 x56 cm3 54 kg Micro-ESR Spectrometer •Easily Transported Anywhere •Plug In, Power On, Acquire Spectra •Versatile: Applications in Research, Education, and Industry •Variable temperature accessories available Technical Data Frequency 9.6 to 9.8 GHz Resonator Cylindrical Dielectric Sample Tube Diameter Up to 5.8 mm Sweep Range Over 330 Gauss Centered at g=2 Supply Voltage 15 VDC (120/240 V Wall Adapter Included) Ethernet and USB Data Interfaces Screen Dimensions 21 cm Touch Panel display with Windows 7 Embedded DVI/HDMI/VGA 30.5 x 30.5 x 30.5 cm3 Mass 10 kg Online Benchtop ESR •World’s first industrial process monitoring instrument •Provides real-time, embedded, non-destructive measurements of free radicals and some transition metals •Designed to work under harsh environmental conditions •Easily transported to any site •Hazardous location rated enclosures available(Class 1, Div. 1, and ATEX) Technical Data Frequency 9.6 to 9.8 GHz Resonator Cylindrical Dielectric Sample Tube Diameter (Flow Mode) Up to 6 mm OD Sample Tube Diameter (Tube Mode) Up to 3 mm OD Sweep Range Over 300 Gauss centered at g=2 Supply Voltage 15 VDC (120/240 V wall adapter Included) Data Interfaces Ethernet and USB Screen Dimensions 21 cm Touch Panel display with Windows 7 Embedded DVI/HDMI/VGA 30.5 x 15 x 23 cm3 Mass 10 kg Operating Temperature -30 to 85 degrees C Maximum Pressure 100 psi Maximum Fluid Inlet Temperature 160 degrees C Signal to Noise NOTE: Signal and noise measurements are made using the same conditions. The signal is calculated as the average of the amplitude of the three TEMPOL peak heights divided by two times the RMS noise in the same spectrum. Signal to Noise = (peak amplitude) / (2*RMS noise) 50 µM TEMPOL in Water 1 scan, 4k data points, 15 mW S:N > 200:1 Extended Range Benchtop 1 µM TEMPOL in Water Flat Cell Signal to Noise 70:1 Capillary, 1mm ID Signal to Noise 30:1 64 scans, 4k points, 15 mW, 100 G sweep width Resolution Perylene Radical Cation Semiquinone Radical Anions A B Benzosemiquinone 2-butylbenzosemiquinone aH1 C catechol aH2 aH3 1.38 A 2.28 B 2.01 1.67 C 3.38 0.74 Some Applications • • • • • • • Spin Trapping Kinetics Coordination Chemistry Antioxidant Radicals in Lubricants Dosimetry Crystal Defects Education DMPO as a Spin Trap For OH • . Electron spin resonance spectroscopy is a well established technique for measuring the signal from hydroxyl radicals that are spin trapped by DMPO. These hydroxyl radicals are generated via the Fenton Reaction: Fe2+ + H2O2 → Fe3+ + OH. + OH− DMPO + OH. → DMPO-OH. • Micro-ESR provides a portable, cost-effective, and sensitive spectrometer that can measure DMPO-OH radicals from this reaction. DMPO-OH. Spin Adduct PTIO as a Spin Trap for Nitric Oxide 1. ESR signal of α-Phenyltetramethylnitronly nitroxide (PTIO) PAPA NONOate (NO source) is added to the tube 2. The ESR signal changing from the nitronyl nitroxide to the imino nitroxide 3. The imino nitroxide ESR signal Determine Reaction Mechanisms by Observing Spin Adducts • Using PBN (t-butyl-α-phenyl nitrone) as a spin trap, we follow a Fenton Reaction in DMSO. • The Fenton Reaction generates hydroxyl radicals, which react with the PBN, but also the DMSO • The PBN-OH• spin adduct is too short lived to observe directly, but methoxyl (OCH3•) radicals are also produced • The PBN-OCH3• spin adduct is long lived, and easily observed by ESR • As the reaction proceeds, the major spin adduct changes from methoxyl to methyl • MNP, 2-methyl-2-nitrosopropane, a spin trap itself, is formed during the reaction • MNP forms a third spin adduct with methyl radicals PBN-OCH3 Spin Adduct The PBN-CH3 spin adduct remains, and another spin adduct is forming A second spin adduct starts to form Both PBN-OCH3 and PBN-CH3 Spin Adducts are present A third spin adduct, MNP-CH3 has formed, and is superimposed on the PBN-CH3 spin adduct Identifying Spin Adducts • The hyperfine coupling constants help to identify the trapped radicals, and give information about the electron spin density – The hyperfine coupling constants are smaller both for the nitrogen and the proton in the PBN-OCH3 spin adduct than the PBN-CH3 spin adduct because the oxygen in the methoxy pulls spin density away from the nitrogen • More direct information can be obtained about the radical from the nitroso spin adduct because the radical adds directly to the nitrogen atom – We see coupling from the methyl protons only in the MNP-CH3 spin adduct • We know that it is the methyl, not the methoxyl, radical that had added to the MNP because MNP does not form oxygen centered radicals Kinetics and Spin Traps • Stable radicals such as TEMPOL can be used to monitor reaction rates • TEMPOL has an intense ESR signal, and can react with other radicals to form ESR silent products • The rate at which the TEMPOL signal disappears can be used to determine reaction rates and mechanism • Active Spectrum’s user friendly acquisition software allows for quick and easy set up of kinetics experiments • Easy to use processing and analysis software allows for quick analysis of data Data Acquisition 1. Insert Sample into Spectrometer 3. Set up the Experiment 2. Choose Multiple Runs with Delay. a) b) c) d) e) Enter the number of scans Enter the number of points per scan Enter number of runs Enter the delay time between runs Start acquisition Data Processing Load as many or few files as needed into the MicroESR processing software Display a single spectrum or overlay as many spectra as needed. Processing software automatically calculates the double integral of all selected spectra, and displays the values in a bar graph. Ocean Spray Diet Blueberry Juice 10 9.5 9 8.5 ln(AU) Data is saved is csv format, so can easily be read into other processing programs if desired. 8 7.5 7 6.5 6 0 100 200 300 400 Tim e(s) 500 600 700 800 900 Transition Metal Compounds (Extended Range) VO(acac)2 CuSO4 MnO CuTPP Ferrofluids (Extended Range) 0.1 and 0.5 % Ferrofluid in Toluene 1, 5, and 10% Ferrofluid in Toluene Antioxidant Radicals in Lubricants •ESR is a very effective way to monitor and identify antioxidants in lubricants •Peroxy and other radicals formed as thermal degradation products react with antioxidants, often forming stable radicals which are visible by ESR •Elucidate reaction mechanisms through radical adducts Butylated Hydroxy Toluene (BHT) Loses the OH proton to free radicals Galvinoxyl radical 4,4-methylenebis (2,6-Di-tert-butylphenol) (Loses the OH proton to free radicals) Optically Polarized Nitrogen Vacancies in Diamond Special mirror allows laser light to be shown in to the resonator cavity to induce optical polarization. Data courtesy of Eric Scott, Jeff Reimer’s Lab, UC Berkeley. Extended Range Benchtop. Dosimetry • Electron Spin Resonance can be used to measure radiation exposure • Signal amplitude of irradiated sample is proportional to the dose (sample specific, and true only for good dosimetry samples) Spectra of sample irradiated with 1,2, and 5 Gy from a 60Co source y = 0.7852x R² = 0.9987 Dose Response 45 40 Linear dose response of sample for radiation doses from 1 to 50 Gy 35 Peak Amplitude 30 25 20 15 10 5 0 0 10 20 30 Dose, Gy 40 50 60 Crude Oil Analysis Vanadyl Asphaltene Asphaltenes contain radicals, and vanadyl porphyrins are commonly found in crude oil Education • Active Spectrum’s Micro-ESR is an ideal undergraduate teaching tool • It can easily be moved to labs, classrooms, or shared • Easy to use, so students can start to acquire data quickly • Can be purchased with an Education Package Micro-ESR Education Package • • • • • • Micro-ESR Spectrometer Micro-ESR Experiments Manual with Seven Labs Micro-ESR Instructor’s Guide Lab Accessory Kit Micro-ESR User’s Manual Micro-ESR Analysis and Processing Software with Manual http://www.activespectrum.com/Micro-ESR_Education_Pkg2B_Summary.pdf Contact • These are only a small number of ESR applications • For more information: http://www.activespectrum.com/about-us.shtml Active Spectrum 1191 Chess Dr. Foster City, CA 94404 USA (650)212-2625 www.activespectrum.com