1
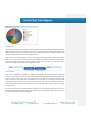
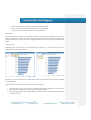
User manual
1
Table of Contents
Welcome to Financial-Clarity ................................................................................................................................. 3
Website ............................................................................................................................................................. 4
Login .................................................................................................................................................................. 5
Change your password ....................................................................................................................................... 5
Lost your details ................................................................................................................................................. 5
Landing page ...................................................................................................................................................... 6
Dashboard overview .............................................................................................................................................. 8
General Navigation ................................................................................................................................................ 9
Making selections .............................................................................................................................................. 9
Changing your breakdown view ....................................................................................................................... 12
Other Navigation .............................................................................................................................................. 13
Corporate Performance.................................................................................................................................... 17
Key Customers and Targets .............................................................................................................................. 20
Profiling ........................................................................................................................................................... 23
Lead Generation............................................................................................................................................... 25
Account analysis............................................................................................................................................... 25
Outlet details ................................................................................................................................................... 26
Sales team mgmt ............................................................................................................................................. 26
Market analysis ................................................................................................................................................ 27
Product analysis ............................................................................................................................................... 27
2
Comment [MSOffice1]: Can we clearly
put the FC support phone number and
email address in either the header or
footer on each page.
Welcome to Financial-Clarity
This user manual aims to give an overview of Financial-Clarity and act as a guide when creating your data
selection and reports. The first part of manual will provide you with brief introduction to the 9 interactive
dashboards and demonstrate how to use the various selection variables available in Financial-Clarity.
Financial-Clarity is a suite of revenue-driving business intelligence tools which has been developed exclusively for
the UK financial services industry. It is an online data hub coupled with a number of analysis tools such as data
selection variables and charts which enables the user to create a range of bespoke reports. The Financial-Clarity
data universe is powered by Matrix Financial Intermediary Database (MFID), which is the most comprehensive
database of UK financial intermediaries. The database includes over 60,000 registered UK Outlets across the IFA,
mortgage and protection market.
This data is collected from a variety of sources;
The FSA Register: A comprehensive list of all firms and individuals who are permitted to sell and give advice on
financial products in the UK. All of our subsequent external sources are cross checked against the FSA register,
allowing us to provide the most comprehensive, up-to-date, marketing focused list of Financial Intermediaries in
the UK.
In-house research team
Our 20-strong research team conduct research into new outlets and also focus on the top 500 IFA’s in the UK, of
which the top 100 which are published annually in FT’s Financial Adviser. They also conduct telephone based
research such as collecting and confirming the information on financial advisers this further enhances the quality
of the database.
Subscription lists from financial publications
Matrix Solutions have partnerships with publication companies such as Centaur Media. We receive a monthly
data feed of their subscription lists of publications such as Money Marketing, Fund Strategy and Mortgage
Strategy.
My local adviser.co.uk
3
Comment [MSOffice2]: Check the
name. We also publish a second list. Add
that too.
This website is hosted by Matrix Solutions and is a search directory website for consumers wanting to find
financial adviser in their area. Financial advisers can register for free and the information that is provided when
creating an account such as geographical, commercial, and administrative details is checked against the FSA
register and then added to the database.
Trade organisations membership lists
MFID also contains information from membership lists of the main trade organisation of the financial services
industry; Association of Independent Financial Advisers (AIFA) and the Association of Mortgage Intermediaries
(AMI).
This data is coupled with quarterly transaction data from UK Financial services companies, which covers the
market of Fund management companies, Life and Pension companies and Platforms.
Website
Comment [MSOffice3]: Needs much
more on this. Copy and paste from the
brochure. Also mention the ways of
accessing FC data briefly before saying that
this document concentrates on the
dashboards.
Financial-Clarity is a cloud based system and therefore access is not restricted to a single computer and requires
no IT installation. On the Financial-Clarity website (www.financial-clarity.com) you can find all the information
associated with the product but also the latest news and upcoming events.
From the Client Zone area of the website users can access dashboards, newsletters and released documents such
as this User Manual or “What’s New” which highlights any changes or enhancement to Financial-Clarity. Access to
our ‘Data Uploader’ is also available from here.
We are always trying to improve our products and services; user feedback is a very important way to ensure the
continual advancement of the product and services that we offer. Any feedback or ideas that you may have on
the product is welcomed and highly appreciated. If you have any feedback that you would like to share with us
you can either contact our Customer Services team, your Technical Account Manager or complete our user
surveys.
4
Comment [MSOffice4]: Move to
somewhere more appropriate. Perhaps
before the website section but after the
general intro.
Login
The login bar is situated at the top-right corner of the website. To enter your username and password, overwrite
the “username” and ******* placeholders. Note that the username and password is case sensitive.
Change your password
To change your password you must first login and then click on “change password” which is displayed under the
login bar.
Lost your details
If you have lost your password we can easily send you a new one, just click on “Lost you details” and enter your
username. If you enter the wrong password 3 times your account will be locked for security reasons and the
account can only be unlocked by the Financial-Clarity support team. To avoid locking your account, always reset
you password if you have entered the wrong password twice.
For security reasons you can only log in at one browser session at a time. You should always logout of the
website rather than closing the browser. Otherwise you may receive an “Account in use” message if you attempt
to log back in shortly afterwards.
If you still experience problems logging in or accessing your dashboards please contact our Financial-Clarity
support team.
5
Comment [MSOffice5]: How do they
reset their password if they are not logged
in? If they are logged in then they will get
another 3 chances so resetting is not
necessary.
Landing page
Once you have logged in and launched your dashboards you will be directed to the landing page where your
name and company will be displayed. In the top-left corner you will see the period for which the data covers:
“Market analysis data: XX/XX/20XX”.
The charts displayed at the bottom of the page show the relative Financial-Clarity data coverage over time. Note
that this data coverage is based on the value of transaction data we receive from our data contributors and does
not show the overall market coverage.
E.g. 100% data coverage means that all Financial-Clarity data contributors have supplied data for that quarter.
A 97% figure would show that we are missing data from contributors that would make up 3% of our total data
based on previous quarters.
On this page you will also find the Financial-Clarity support contact details:
Email: [email protected]
Telephone number: 0800 074 0574
6
Comment [MSOffice6]: Update the
screenshot to a Q4 2010 (or even Q1 2011
if we are that late!
7
Dashboard overview
There are 9 interactive dashboards (highlighted in red below) available in Financial-Clarity. Each dashboard
serves a different analytical purpose. They can provide valuable information for every area of your business such
as Marketing, Sales and senior management. By using the various selection variables that are available, users can
tailor their analysis to suit a firm’s individual business intelligence and reporting needs.
8
Comment [MSOffice7]: Cut and paste
the 2-3 line introductions to the various
dashboards from the FC brochure and link
through to the more detailed information
provided on each one. After this short
intro to the dashboards, move on to the
general navigation side of things and
making selections before returning to the
specific dashboards. This will prevent you
repeating yourself on cycling through
objects, making selections etc.
General Navigation
Making selections
Formatted: Normal
Whilst you can use the dashboards without making any selections, you will often wish to focus your analysis on
particular firms, products, time periods etc. To do this you can select the specific variables and values that you
wish to focus upon.
The variables are available on every dashboard, which allows the user you to make selections regardless of which
dashboard they are currently viewing. When moving from one dashboard to another your selections will be
preserved, therefore eliminating the need to reselect variables for each dashboard.
Formatted: Font: +Body
9
The user can make their selections one-by-one or if preferred it is possible to
select multiple variables. This can be achieved by clicking and dragging over, for
example, the quarters or years that you want to select. The selections will then
be highlighted in green. Alternatively, it is possible to make multiple selections by
holding down the Ctrl button and clicking on each variable. This will allow you to
compare your sales performance across two periods such as Q3 2010 and Q3
2009.
The “Current Selection” window displayed in top-left corner shows all selections
made and helps monitor the data query as it develops.
Financial-Clarity is a very intuitive product as most of the charts and tables that you see can be selected.
Note that if no selections are made Financial-clarity will show the whole data universe. To make a selection from
one of the charts the user can either click on a chart area or if preferred make multiple selections by clicking and
dragging the cursor over the area that you wish to select as shown in the picture below.
-
Over a bar chart
Over a pie chart
Over a legend
10
Formatted: Font: +Body
Formatted: Font: +Body
Comment [MSOffice8]: Explain how
you can remove a selection using the
current selections box.
Formatted: Font: +Body, Underline
Formatted: Font: +Body, Underline
Formatted: Font: +Body, Underline
These are the selections can be made:
Comment [MSOffice9]: Update using
the new Q1 layout.
Channel
Quarter
Year
Payment frequency
Product class
Product type
Here you are able to
segment your sales by
sales channel, your sales
via platforms or nonplatforms.
One specific quarter or
year can be selected, or
multiple selections can be
made for comparison
purpose.
Here the user is able
specify a range of product
criteria as well as select
individual products.
Primary Business
Network
Own Sales
Market Sales
Market Share
Registered Individuals
Status*
Office type*
The selection variables
available in here are
related to the set of
criteria for the outlets that
the user wishes to see,
such as market share or
how many registered
Region
County
Town
Sales Team
Sales Rep
Allocated
Controlled function
Job title
It is possible to look at
either, very specific towns
or a broader view such as
regions
Here, it is possible to
either look at the
performance of specific
sales representative or a
sales team.
Under this selection tab it
is possible to specify the
job title of an IFA and also
specify their FSA
permissions.
11
IMA Sector Class
IMA Sector Type
IMA Sector
Multimanager
Investment asset
Financial-clarity uses the
fund classification; IMA
sectors, which allow easier
comparison to be drawn
between funds on a likefor-like basis.
individuals the office has.
*Status: The status selection variable indicates if the Adviser is currently registered with the FSA.
*Office type: With this selection variable the user can define if they only want to include head offices in your data query
Comment [MSOffice10]: Add cycle
groups. Point out that different charts will
have different cycle groups.
Changing your breakdown view
Region
The regions are classified by the post-offices in the
UK. This shows which location a firm sales are
coming from. If a region is labelled “other” the
user can select this variable in order to identify
which regions are included.
Primary business
Financial-Clarity has been developed with its own
system of classifying the primary business split.
This classification allows the user you to easily
track from which type of intermediary their sales
going through.
Product/ Product class/ Product type
There are three ways of segmenting you product
sales; the “product” variable is based on the range
of products available for the users firm
IMA sector group
This classification is similar to the IMA sector split,
however under this sales split the IMA sectors
have been grouped.
Channel
Allows for a split between sales by sales channel;
platform sales, non-platform fund sales and nonplatform other sales.
IMA sector
The IMA sector group is based on The Investment
Management Association fund classification. This
fund classification makes it easier compare funds
like-for-like before looking at fund in more detail.
12
Formatted: Heading 2
Other Navigation
Formatted: Font: +Body, Bold
1: Clear
2: Back
Comment [MSOffice11]: Explain what
these do..
3: Lock/un-lock selections
The user also has the option to lock some of their selections thereby preventing variables from being deleted (as
explained above). When building the selection it can sometimes be useful to lock some of them to preserve the
“base” for the selections, for example if the user is looking at a specific region and product type but making a few
additional selections on top of that. Financial-Clarity is able to delve down into great detail and therefore the
selections can sometimes become quite extensive, by locking of some selections this can make the process much
easier. When a selection is locked the little circle changes colour from green to grey, which then indicates that
this selection is locked. The selection can be unlocked by clicking on the “unlocked padlock” (3) and the circle will
then become green.
4: Add/Remove bookmarks
Adding bookmarks is good way of creating reports. The user is able to share these bookmarks with other
Financial-Clarity users within their firm. This enables easy sharing of information across departments. Once the
selection has been created it is possible to save it as a bookmark by clicking on the button “add bookmark”. To
share the bookmark - tick the box “Share Bookmark with Other Users”.
5: Select bookmarks
13
The bookmarks that are created will be saved and available in the drop-down menu.
Add/delete selections
The selections that have been made will be displayed in the “Current selection” window. This can help keep track
of the selections that have made. Selections can be deleted using the clear button (1) displayed at the top of the
page which is the quickest method of deleting selections. However, if the user requires that some selection
variables remain this can be done by deleting them one-by-one by clicking on the eraser symbol displayed next to
each selection. The selections are preserved when moving from one dashboard to another which means that
navigation between the different dashboards without having to re- select is achieved. By keeping the Ctrl button
pressed it is possible to make multiple selections for example the user is able to compare two periods e.g. Q1
2010 and Q2 2009 or if desired to look at ISAs and SIPPs as a group.
Maximise
Some of the dashboards display a number of different graphs and tables, which sometimes needs to be
maximised in order to see the different values. Most of the graphs and charts have a small square symbol in the
top-right corner (highlighted in red below) which allows the user to maximise it. In order to restore the view press
on the same button.
A chart can be maximised by right-clicking on the chart area and choosing “maximise” from the drop down menu.
Formatted: Font: +Body
Search
In the right-hand corner of each selection box there is a magnifying class which allows the user to search within
the selection menu, for example, for a particular fund or IMA sector.
There is also a search bar displayed above the “Current selections” window which allows the user to search within
the data universe, for example for a specific company, FSA reference number or postcode.
14
Formatted: Font: +Body
Print
It is possible to print charts from Financial-Clarity by right-clicking in the chart area and select print from the drop
down menu.
Formatted: Font: +Body
Legend variables
If there are two arrows displayed under the legend it means that there are more variables, click on the arrows to
change the view.
15
Formatted: Font: +Body, Bold
Comment [MSOffice12]: Add a hints
and tips section. E.g. the notes on the
QuickStartGuide, the suggestion about
making selections on one dashboard
before moving to the more computerintensive dashboards in order to pull up
the screen faster.
16
Corporate Performance
Corporate performance is the first dashboard and gives a snapshot of your sales performance and market share.
The sales can viewed at an aggregated level or be segmented by using variables such as geographical location,
time periods and product types and is displayed using a range of different charts. A similar view is provided for
the market sales and therefore you can easily compare your sales against the market. This dashboard is a good
place to start building data selections as it gives a general overview of your sales performance and can allow you
to spot interesting areas of a business for further analysis.
Overview of the different charts
Own sales value
The first chart shows your own sales value over a specific time period which will be based on your selection
criteria. Therefore, all quarters/years for which we have data across all products will be displayed on default
when no selections are made. The sales can be segmented (split) into many different areas; from specific
products and sectors to regions (more information, see section: “Split your sales”).
To split your sales: right-click on
displaying the different split options.
next to (in this case) [REGION] and a drop down menu will appear
If you are viewing your sales on a quarterly basis you can easily change this to a yearly view by right-clicking on
the circular arrow with the label [QUARTER].
The values of the charts can sometimes be difficult to read. To see the underlying values, that correspond to each
colour coded area of each bar, more clearly you can do so by moving the cursor over the area and a “hover box”
will be displayed (as shown in the picture below).
17
However, if you want to see all the underlying values in a spreadsheet format you can change the view by clicking
on the [FAST CHANGE] button in the top-right corner of the chart.
18
Indexed sales growth
This graph shows your own sales, market sales and market share as an index with “Own sales” set as the index
base =100.
By using the selection button [PERIOD] you are able to change the time period for which you are viewing. This
time period can either be displayed on a quarterly or yearly basis, to change the time frame right-click on the
circular arrow with the label [QUARTER].
Own sales mix/ Market sales mix
These two pie charts show the segmentation or split of your own sales and the market sales. Note that the data
output in these 4 charts will always reflect the same selection criteria and you are not able to separate data
queries in different charts. The “Market mix” pie chart will often display more variables (as shown in the picture
below) since it is representative of the market and cover the whole data universe whereas “Own sales” will only
reflect your product/fund sales.
19
Key Customers and Targets
This dashboard gives an overview of the largest intermediaries and accounts by your own sales and market sales.
The chart on the left hand side shows the top firms by your own sales based on the selections that you have made
and will show the whole data universe if no selection have been made. On the right-hand side you have the same
table but showing the top firms by market sales. In addition to sales reports you are also able to create customer
targets reports, thereby identifying intermediaries that offer most potential for growth. Similarly, you can also
identify those intermediaries where your share of their sales are declining or are below average.
The intermediaries can be viewed on a firm, outlet, network or platform level. To change the view, use the
buttons above the tables as displayed below.
Financial-Clarity classifies firms and outlets by the following criteria:
Outlets: All the individual outlets regardless of their FSA register number
Firm: All outlets reporting under the same FSA register number are aggregated into a firm
In the platform view you can see the portion of your sales that are going through platforms and you can also see
the non-platform sales at an aggregated level, if you want to split this sales figure into non-platform fund sales
and non-platform other sales, use the [GENERAL] selection button.
20
Financial-Clarity disaggregates the transaction data received from Platforms, this allows the user to delve down
into the data and view the firms that are buying or selling their products through a particular platform. Note that
this only applies to the firm’s own sales and only the platforms that are data contributors. To create this selection
simply select a platform under the “platform view” and move to the “firm view” where the list of the firms will be
displayed. As mentioned, the user can only see information regarding their own sales data and therefore the
table showing the top firms in the market will not be adjusted to this selection.
Firm Key Metrics
In this table you are able to see the sales data of each, in this case Firm, but also for each Outlet, Network or
Platform. This table can be useful when comparing your sales performance to specific firms.
The values are represented in 3 different colours:
Green: positive growth above 5%
Orange: positive growth below 5%
Red: negative growth
To sort the table by a specific column double click on the arrow displayed in the top row of each column as shown
in the image below.
21
Data anonymity
As seen in the Key Metrics table above some sales figures are replaced by a (-) highlighted in red. This is in order
to comply with firm data anonymity; when there are less than 2 data contributors, the firm’s sales figures are
protected in order not to display any individual firm’s sales to a particular firm.
Note that the comparison period, for which you wish to view in this table, is selected by using the drop-down
menu displayed above the table.
The selection periods available:
- Quarter to last quarter
- This quarter to same quarter last year
- Trailing 4 quarters to previous trailing 4 quarters
- Year to date vs. previous year to date
To create reports where you want to restrict the number of firms displayed, you can specify how many rows that
you want to include (for example the top 50 firms) by using the drop-down menu as shown below.
22
Note that all these values can all be exported to an Excel spreadsheet by right-clicking anywhere on the table area
and choose [SEND TO EXCEL] from the menu (see picture below). If you are using a Mac computer – note that you
can right-click by clicking and moving the cursor with two fingers.
Profiling
The profiling dashboard gives an overview of the various sales channels and this data can be further drilled down
using variables such as primary business, region, market sales band and product class. This information can be
used to track sales performance in different market segments and be used for strategy planning and reporting.
This dashboard can also be particularly useful when targeting specific segments of the market, for example, when
you want to create a mailing list for a road show or the launch of a new product.
When you have selected the segment of the market that you are interested move to the Lead Generation
dashboard and you can see the firms and the individual contacts that match your selection criteria.
Outlets by business areas
This chart displays the number of outlets that are involved in the different business areas such as Insurance,
Investment, Mortgage and Protection. “No business” simply means that the outlets do not operate in that
business area. Note that a firm can have involvement in more than one business area and therefore are not
mutually exclusive.
23
MFID contacts by Controlled Functions
A Controlled Function relates to permissions that the firm is required to have in order to carry out a regulated
activity. Contacts with CF30 permission are approved by the FSA to give financial advice.
MFID contacts by job title
MFID is regularly updated using a range of data sources, the pie chart below shows the user how many contacts
we currently have that directly match their selection, these contacts are split by job title. In order to see the
underlying values you can either export the values to an Excel spreadsheet or hover the cursor over the area of
the chart that you are interested in.
24
Lead Generation
The information available in this dashboard is linked to the Matrix Financial Intermediary Database (MFID) which
holds all the contact details of the financial intermediaries. The information that is available is dependent on the
MFID subscription and gives you information such as; their personal email addresses, telephone numbers, FSA
reference number and branch office and head office addresses.
There are two small windows displayed at the top of the page which show the number of outlets and contacts
(based on your selection) that we have identified and are available in the MFID. All information can be exported
to an Excel spreadsheet by pressing the “Export contacts” button. You can also plot the outlets that you have
selected on a Google map by clicking on the “Google Maps” button.
Account analysis
When you have identified an intermediary or a number of intermediaries that you want explore in more detail
you can do so by moving to the account analysis dashboard. This dashboard will display all the information about
these account(s) in terms of; your sales to that firm(s) and their total sales, your market share at the particular
firm(s) and the firm’s total market share. This information can also be split by, for example, product type, IMA
sector and sales channel. For your own sales you can drill down the data to see the individual funds that were
sold to a particular firm; however in the market sales chart you will only be able to see a firm’s sales on a product
or wrapper level.
You can also see the sales as an index and track the performance over a specific time period. Similar to the Lead
Generation dashboard, this dashboard will give you information about the individual outlets of the firm(s) such as
the address, FSA reference number and office type.
25
-
Click on a FSA number to see all the outlets with the same FSA number
Click on an outlet’s postcode to see all outlets located at that postcode
Click on the outlet type such as head office to see all head offices
Outlet details
If you have selected an outlet in the Key Customer & Targets or Account analysis dashboard that you want to
know more about you can move to the Outlet details tab. In this tab you will not only see the address of the
specific outlet but also the outlet’s permission’s, regulatory details and each person’s job title that works at that
outlet.
Sales team mgmt
Incorporating your sales structure into Financial-Clarity can enable you to track your sales teams’ sales
performance and enhance the overall data.
By clicking on the circular arrows you can change the view from the performance of the sales team to individual
sales representatives.
To get an overview of a sales team or a sales representative’s performance:
1. Select the team or person and move to the “Corporate performance” dashboard to see the team’s or
representative’s sales performance and compare this against the market.
2. Move to the Key customers and Targets dashboard to see the number of accounts that has been allocated
to this team or person
26
3. Select an account and move to the Account analysis dashboard to analyse the account in more detail, for
example the funds and products that were sold to a particular firm.
Market analysis
This dashboard will provide the user with market sales data and give an overview of the market performance over
time. This can allow you to spot market trends and identify opportunities. The charts that are available within
this dashboard are:
-
Sales contribution
Total sales
Number of contribution outlet
Product analysis
This dashboard is very similar to the Market Analysis tab, however, here the user is looking at their own product
sales performance. It is possible to look at particular funds and how these are performing in different regions or
sectors of the market.
27
28