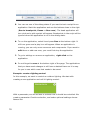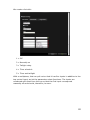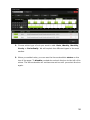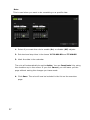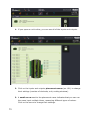
1
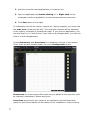
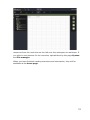
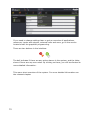
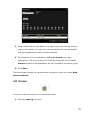
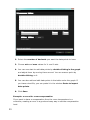
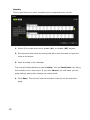
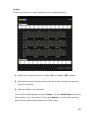
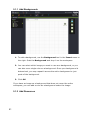
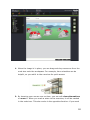
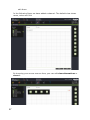
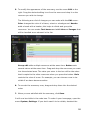
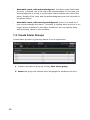
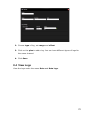
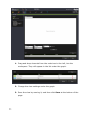
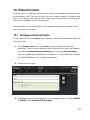
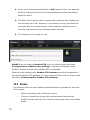
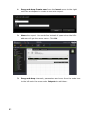
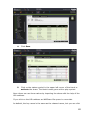
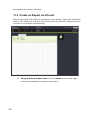
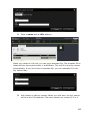
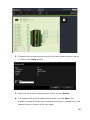
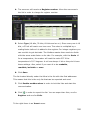
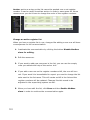
2. Select the number of decimals you want the data points to have.
3. Choose min and max values for X- and Y-axis.
4. You can now start to add data points by double-clicking in the graph
and adjust them by moving them around. You can erase a point by
double-clicking on it.
5. You can also add and edit data points in the table under the graph. If
you have a text file, you can paste it in the window Paste to import
data points.
6. Click Save.
Example: a curve for room compensation
If you want to have a compensation from the room temperature in a
controller, creating a curve is a good and easy way to set the compensation
level.
33