1
Technische Universiteit Eindhoven
Soft Vision
Software Visualization Framework
- User Manual -
Author(s)
Version
Date
Status
Name
– October 2003 –
Voinea S.L.
Telea A.C.
0.1
31.10.2003
Draft
SoftVisionManual.pdf
Version 0.1
31.10.2003
Revision history
Version
0.1
Date
31.10.2003
Author
Voinea S.L.
Telea A.C.
Comments
Document Created
Reviewer
Status after review
Review history
Version
Date
Technische Universiteit Eindhoven
2
The Software Visualization Framework
User Manual
Contents
1
2
3
Overview .......................................................................................................................................... 4
Introduction ...................................................................................................................................... 5
General Description.......................................................................................................................... 7
3.1
Installation ............................................................................................................................. 7
3.1.1
SoftViz Tool File Structure............................................................................................. 10
3.2
Visualization Concepts and Operation Principle ................................................................. 11
3.2.1
Data Representation........................................................................................................ 11
3.2.2
Operations....................................................................................................................... 12
3.3
Visualization Scenarios ....................................................................................................... 16
3.3.1
Scenario Structure........................................................................................................... 16
3.3.2
Scenario Saving and Restoring ....................................................................................... 17
4
Framework customization guidelines ............................................................................................. 19
4.1
Runtime Layer ..................................................................................................................... 19
4.1.1
Purpose ........................................................................................................................... 19
4.1.2
Mapper Runtime Customization ..................................................................................... 19
4.1.3
Requirements .................................................................................................................. 20
4.2
Tcl Layer ............................................................................................................................. 22
4.2.1
Purpose ........................................................................................................................... 22
4.2.2
Provisions ....................................................................................................................... 22
4.2.3
Requirements .................................................................................................................. 23
4.3
Kernel Layer........................................................................................................................ 24
4.3.1
Purpose ........................................................................................................................... 24
4.3.2
Provisions ....................................................................................................................... 24
4.3.2.1 General data flow diagram......................................................................................... 24
4.3.3
Mapper Subsystem.......................................................................................................... 25
4.3.3.1 Mapper design trade-offs ........................................................................................... 28
4.3.3.2 Syntax of the native implementation for Tcl system library commands.................... 28
4.3.4
Requirements .................................................................................................................. 28
Technische Universiteit Eindhoven
3
Version 0.1
31.10.2003
1 Overview
The Software Visualization Framework (abbreviated SVF) is intended to be a handy tool in building
visualization scenarios for large amounts of relational data. SVF’s aim is to allow users to interactively
explore complex relational datasets at different levels of abstraction.
The SVF can be used by different users at various level of detail. End users typically want to install and
run the system to obtain some pictures. Other users want to perform more involved actions that imply
modifying some parts of the system. In this document we describe the SVF at various level of details.
The aim is to support understanding and modifying the SVF to the desired level. There are many ways
in which the SVF can be customized. In this section, we give an overview of what the following
sections contain. The following should be read by the user to understand what has to be further
examined to accomplish the desired tasks within the SVF.
This document has the following sections:
1.
2.
3.
4.
Overview: this is the current section
Introduction: description of the layered structure of the SVF. This section should be read by all
users to get an understanding of the purpose and semantics of the several layers in the SVF.
Several users will then choose to go in depth in reading about specific layers, depending on their
proficiency and interests.
General Description: this section presents the general concepts all users should be familiar with
when using the SVF, such as installation and operation via the GUI and Tcl scripts. This section
should be real by all users. End users should probably not go further than this section.
Framework Customization: this section details the various ways the SVF can be customized. The
purpose is to provide detailed documentation of the various system layers, so that changes can be
brought at the desired level of detail. This section is not necessary for end users. However, users
who plan to use the SVF more than for visualizing their datasets via pre-built scenarios should
have a quick read of this section. Users already familiar with the GUI and scripting functionality of
the SVF and who need more customization freedom to reach their goals will find here the
complete technical information of the working of the SVF.
Technische Universiteit Eindhoven
4
The Software Visualization Framework
User Manual
2 Introduction
The Software Visualization Framework (abbreviated SVF) is intended to be a handy tool in building
visualization scenarios for large amounts of relational data. SVF’s aim is to allow users to interactively
explore complex relational datasets at different levels of abstraction.
Relational data exploration is a complex task having several dimensions or degrees of freedom. These
include, but are not limited to, the following:
• data type: various data types describe various application domains, such as software
structures, network data, architectural patterns, communication and organization structures,
and so on. Although structurally similar, these datasets have different meanings, so they are
probably best visualized in different ways.
• data size: relational datasets may range from a few tens to tens of thousands of elements.
Visualizing, and interacting with, large datasets clearly poses other problems as dealing with
smaller ones. Users should be able to configure visualizations depending on the size of the
targeted datasets.
• visual metaphors: different real-world applications ask different questions about their data.
Consequently, every two visualization scenarios would probably attempt to depict their data
in different ways. Users should be able to easily customize the way data is drawn in a certain
scenario.
• interaction metaphors: similarly to the above, interacting with a given dataset is tightly bound
to the data semantics and the questions to be answered. Users should be able to easily tailor
the scenario interaction, i.e. the actions the visualization tool should perform in response to
user input.
SVF provides a general visualization framework with several layers of customization that allow users
to construct specific visualization scenarios. These customization layers attempt to address all the
above degrees of freedom in constructing a visualization. Depending on the proficiency of the user and
on the generality of the tailoring action, the customization can take place at three layers (see Figure 1).
Higher layers are simpler to use for non-programmers, but offer less customization than lower layers.
Lower layers offer more, up to complete, control on display and interaction, but demand more
programming skills from the user. These layers are described next:
Runtime
End User
GUI
Tcl Scripts
Tcl
Kernel
Ease
Power
of
of
Developer / use customization
Extender
System
Architect
Figure 1: SVF customization layers
Runtime
At this layer, scenario specific customization actions can be performed. The
color, shape, number of objects and relations among them can be easily
adjusted to meet the needs of a certain scenario. The tailoring actions are
executed as user commands given to the system by means of the user
interface (i.e. widgets and command line), or by Tcl script files.
This layer of customization has a small understanding threshold and easy
learning curve, as it does not require deep knowledge of the system.
Therefore, it is suitable for end-users. Briefly put, this layer is similar to the
Technische Universiteit Eindhoven
5
Version 0.1
31.10.2003
point-and-click and command-line operation of most programs.
Tcl
At this layer, more general customization actions can be performed. These
actions are expressed by scripts written in the interpreted Tcl language. They
are intended to encapsulate in the SVF more complex tailoring actions that
occur in a large number of scenarios. The purpose of this layer is to provide a
way to write more complex actions and reuse them in different scenarios.
The unit of reuse is the Tcl script.
This layer of customization has a medium understanding threshold.
Nevertheless, it requires a good conceptual understanding of the domain for
which it is intended. Also, users should be familiar with scripting in the Tcl
language, or a similar one. Therefore, this layer is suitable for more advanced
users, especially for those who intend to extend the SVF or use it more than
occasionally.
Kernel
This layer contains the main engine of the system, written in compiled C++
code. At this layer, basically any aspect of the system can be customized.
The kernel contains the main data structures of the system, as well as the
execution synchronization mechanisms. One should attempt coding at this
layer only if the desired functionality cannot be efficiently or effectively
obtained via the Tcl layer. Moreover, this layer should be changed only if the
modifications are deemed to be important and permanent for all further uses
of the SVF system.
This layer of customization requires deep understanding of the architecture
of the SVF. Therefore it is only intended for very advanced users, namely
system architects and similar roles.
In the remainder of this document, we present the general way of working with the SoftViz framework.
The aim is to give detailed guidelines and information on how to perform tailoring actions at the three
aforementioned customization layers.
Technische Universiteit Eindhoven
6
The Software Visualization Framework
User Manual
3 General Description
In this section we present some general aspects related to installing and working with the SVF. We
begin with the description of basic actions like the installation of the software package. We continue
with more detailed information about the concepts and the actions that are to be mastered in order to be
able to build useful visualization scenarios in the framework.
3.1
Installation
The framework is based on a visualization tool, called the SoftViz tool, and a number of third party
packages (see Figure 2). Users interact directly with the SoftViz tool only. The SoftViz tool uses the
third-party packages to implement a number of functionalities.
Visualization tool
SoftViz
GUI
Tcl script
Tcl / Tk + Tix scripting
C / C++ Kernel
3rd Party Packages
call
GLUT Package
dll
call
call
call
Coin3D / Inventor
Tcl / Tk
+ Tix library (for GUI blocks
like OpenFile dialog)
dll
SoWin
dll
file I/O
file I/O
GraphViz Package
GEM Package
exe
exe
dll
System
OpenGL
System graphic
device manager
Figure 2: Software packages for the SVF
The layered architecture of the SVF reflects the three layers of customization where tailoring actions
can take place (see Section 1). Also, this layered structure determines the way the SVF is to be
installed. In the following, we give a number of guidelines for the installation of the framework
packages on a Microsoft Windows based system. Installation under UNIX/Linux is also possible.
Whenever the UNIX installation differs from the Windows one, we explain the differences in the text.
Coin3D / Inventor
This package is responsible for the 3D display and interaction within the SVF. Open Inventor is a
library providing 3D scene modeling and interaction via a C++ API. There exist a number of
implementations of the original Inventor API, first released by Silicon Graphics (SGI) under the IRIX
operating system. Briefly put, all one needs is a complete Open Inventor compatible installation for a
given platform, consisting of the API, coming as C++ headers, and the binaries, usually coming as a
shared object or DLL. There are various distributions of the above, as follows.
Under MS Windows, two options are possible. The first is to use the original Open Inventor source
code (get from www.studierstube.ac.at) together with GLUT. The second is to use the Inentor clone
called Coin3D. The first option won'
t give more than basic 3D rendering in GLUT windows (no
manipulators, viewers, etc). The second option is an almost complete API-level compatible
replacement of the original SGI Inventor distribution. We chose for the second. So far, Coin3D'
s
functionality/API seems to be 100% compatible with the original SGI Inventor distribution. A
noteworthy exception is that the windowing system classes, called SoXt in the UNIX/IRIX distribution,
Technische Universiteit Eindhoven
7
Version 0.1
31.10.2003
become SoWin in the Ms Windows distribution. This change has been encapsulated in the SVF
installation, so it should be transparent to the end user installing the system. However, this explains the
following aspects of the installation.
Coin3D (www.coin3d.org) needs 2 software sub-packages: the Coin3D core and the SoWin Windowsbindings. Both packages can be installed as headers + DLL/LIB Windows binaries using the selfextractors. Very simple. They just make a common directory with everything.
In order to build Inventor apps using Coin3D a number of guidelines are to be followed. The source
code stays the same except:
• SoXt stuff gets translated to SoWin stuff. Applies for C++ class names as well as headers.
Minor change, could be automated e.g. via factories + #define'
s in the source code.
• Two #defines are needed in the project: SOWIN_NOT_DLL and COIN_NOT_DLL (or the
DLL ones if DLLs are used rather than static linking). These are needed for compiling
applications against Coin3D and SoWin. Nothing special here.
• The include and lib paths to sowin*.lib and coin*.lib must be set in the project when
compiling it under Microsoft’s Visual C++.
• One should link either against the debug-libraries of SoWin and Coin or against the non-debug
ones.
Just choose what you want, the debug-ones have the suffix '
d'appended to the name.
• At runtime, the sowin*.dll and coin*.dll must be available on the path, as expected.
Under UNIX (Linux/IRIX), one can install one of the various open source distributions of Open
Inventor. Nothing special to be noted here.
GraphViz
GraphViz is a toolkit we use in the SVF to perform graph layouts. The latest GraphViz distribution
(www.research.att.com) comes for UNIX as well as Windows. The Windows installation is very simple
- it comes as a self-extractor which creates a directory containing the command-line executables dot,
neato, dotty, lneato, etc. The command-line parameters and functionality of these is identical with
their UNIX counterparts, so they should be usable from he SoftViz package in exactly the same way.
The installation of GraphViz is well documented in the GraphViz package itself.
GEM
GEM is another graph layout toolkit. We provide our own adapted version of the public GEM code.
Our version adds a number of basic functionalities and thus slightly modifies the original source. The
additions could not have been done without modifying the original source code, for which reason we
include the modified code in the SVF installation kit. Moreover, our version comes with both UNIX
and MS Windows installations. To install the toolkit under Windows: open the Visual C++ project in
the GEM source directory and build it to obtain the executable '
gem'
. Alternatively, just copy and unzip
the gemWin-bin.zip file, in which we provide a precompiled binary distribution for Windows. Finally,
the path to the unzipped directory has to be provided to the SoftViz toolkit. For this, edit the init.tcl
script present in the TCL directory of the SoftViz installation and see the text about configuring GEM.
Tcl/Tk
Tcl/Tk is used throughout the SVF for two purposes: providing run-time scripting capabilities and
building GUIs. A simple-to-install Tcl/Tk 8.3.x distribution comes from ActiveTcl. The installer
creates a TclTk directory containing the headers, libs, and shells (wish,tclsh).An interesting side-effect
of installing the ActiveTcl distribution is getting the BWidgets widget-set. These seem nicer/better than
Tix which is currently used in the SoftViz package above the basic Tk. Moreover, using BWidgets
won'
t require installing Tix atop of the ActiveTcl distribution (see next paragraph). To test the
installation, use the Windows Start menu to locate the ActiveTcl program folder and then either run the
shells or go to the '
demos'folder. Finally, the TclTk installation directory (the exact path is found by
issuing the '
set tcl_library'command in tclsh) must be set as an environment-var under the name
'
tcl_library'(using Control Panel/System in Windows). This is needed for the Tcl_Init() call from our
own user code to work properly - namely, this call tried to find the script init.tcl in the above directory.
Tix
Tix is an add-on library to Tk, providing more complex, nicer looking GUI widgets to the basic ones
included in Tl. Tix 8.x is currently needed by the SVF. In the future it could be replaced by Tk'
s
BWidgets package (see Sec. 3 above). However if Tix is to be installed, use the Tix 8.x package
Technische Universiteit Eindhoven
8
The Software Visualization Framework
User Manual
containing the binaries for Windows. This package comes as a ZIP that is to be simply unzipped into
the TclTk installation directory (the exact place to unzip is found by issuing the '
set tcl_library'
command in a tclsh shell). Next, one has to set the TIX_LIBRARY environment-var to the directory
where the tix8*.dll is located. This is the directory unzipped from the Tix distribution. The env-var can
be set using the Settings/System/Advanced panel in Windows. To test Tix, locate the '
widget'file in the
Tix8.0/demos dir created at installation. Next, edit this file and add the line '
package require Tix 8.0'
instead of the '
exec tixwish....'line at the top. That'
s because there'
s actually no tixwish shell coming
with the Tix distribution. Next, rename the file to have the .tcl extension and then run it.
Visual C++ Runtime Libraries
Since the software is developed with Visual C++, it needs a few Visual C++ DLLs at runtime
(msvcrt.dll, msvcrtd.dll). These DLLs must be copied in the standard Windows system directory (e.g.
c:\winnt\system32 for a Windows NT machine). Alternatively, they can be copied on the same path as
the executable of the SVF.
SoftViz tool itself
See the README_INSTALL file in the package'
s main directory. Basically this amounts to
configuring some paths, if necessary, in the TCL/init.tcl script.
Technische Universiteit Eindhoven
9
Version 0.1
3.1.1
31.10.2003
SoftViz Tool File Structure
The SoftViz Tool is deployed as source code under Microsoft Windows (as a Visual C++ project) and
under UNIX (Linux/IRIX). The file structure of the source code is identical for both distributions.
Nevertheless, while building the application, new directories may be used. In this subsection we give a
short description of the file structure part that is invariant across distributions (see Figure 3) and forms
the backbone of the source code of the application.
SoftViz Folder
Source code
*.cpp
Tool code
*.h
GRAPH_ED
*.c
Modified third party
code
*.h
Runtime data
RSCS
icons
Icons (e.g. for
buttons)
IV
*.iv
3D Objects
TCL
init.tcl
Initialization script
*.tcl
GUI components
*.tcl
Tcl component
libraries
Figure 3: The file structure for the SoftViz tool
The main part of the source code resides in the root directory of the application. Most of the files
containing the implementation (i.e. *.cpp) and the header files (i.e. *.h) are located there. The
remaining implementation and header files are to be found in the GRAPH_ED folder, and they contain
modified code of the original GEM toolkit (see previous section)
The rest of the file structure (i.e. the RSCS, IV and TCL folders) contains runtime data, i.e. data that is
not needed at compile time but only when the application is executed. The RSCS folder contains
various icons used by the GUI of the application. The IV folder contains graphical specifications of the
3D objects used by the tool (i.e. cubes, spheres, bars, etc…). The TCL folder contains the tool
instantiation script (i.e. init.tcl), various GUI scripts (e.g. for save, load, editing, etc…), and domain
specific tcl libraries (i.e. tcl libraries that contain customizations script specific to a certain type of
visualization). As the SVF grows, developers should include their own additions, both compile-time
and run-time, to the SVF in the corresponding directories.
Technische Universiteit Eindhoven
10
The Software Visualization Framework
3.2
User Manual
Visualization Concepts and Operation Principle
In order to understand the way of working with the SVF, one should get first a good grasp on the basic
data models and operations that form the core functionality of the application. In this section, we
present the way the SVF models relational data.
3.2.1
Data Representation
Three main concepts build the data representation in the SVF: structure, attribute, selection and scenegraphs.
Structure
Structure refers to the way in which information elements are related to each other. Briefly put, SVF
represents data as an attributed graph. The nodes are data elements of the users’ own domain model.
The edges are domain-model relations between nodes. The attributes describe specific values the nodes
and edges have. This data model is fully general, i.e. there are no constraints imposed on the structure
or size of the above graph and/or its attributes.
Let us give some examples. Network data can be represented in the SVF as a graph in which nodes
model data sending and receiving entities (e.g. computers) and edges data connections between
computers. Attributes model various aspects of the computers and/or connections, e.g. URLs, speed,
load, and so on. Another example is software architectures. Architectural data can be represented in the
SVF as a graph in which nodes are software entities (files, packages, components, functions, classes,
and so on). Edges represent software relations such as uses, calls, inherits from, needs, and so on.
Attributes model software aspects such as number of lines of code, name of developer, number of bugs,
version, date, programming language, and so on. Clearly any form of relational data can fit into the
SVF attributed graph model.
Attributes
Attributes refer to sets of key-value pairs, associated with a node or edge. These sets contain
information that is specific to each node or edge. Just as structure, this information can be used in the
SVF to query or display specific aspects about the data at hand. Similar to structure, there are few
restrictions about attributes. Specifically, any node and/or edge may have any number of attributes. An
attribute is described by its name, which is a text string, and its value. Within the same node or edge, a
key is unique. Writing an attribute value under a given key erases the previous value known under that
key, if any, or creates a new value, if there was none. Reading an attribute value under a given key
returns the value known under that key, if any, or a default ‘nil’ value, if none was stored. Currently,
the SVF supports a fixed set of value types: integer, floating point, string, pointer, and one dimensional
arrays of the basic types. Internally, provisions are taken to represent data in efficient ways. Conversion
between the basic types are done automatically to maximize simplicity.
Often one gives a special meaning to all attribute values of all nodes or edges that are known under a
given key. For example, one wants to visualize the “cost” attribute of a given set of nodes. We call the
set of all attributes known under the same key an attribute plane. Several attribute planes may coexist
in a graph. Attribute planes are implicitly described by their key and play an important role in the
operation of the SVF
Selections
Selections are sets of nodes and edges. In other words, selections are just subgraphs of the complete
graph the SVF maintains its data in. The selection concept is essential for designating specific
subgraphs for the SVF operations. For example, if one wants to visualize a subset of the complete data,
one creates a selection specifying, in some way, the data he is interested in, and then passes this
selection to the display function. Selections are named and are kept as key-value pairs, in a global
selection set, similarly to the way attributes are kept in a node or edge. In this way, one can refer to a
given subgraph by name in the operations one wants to execute. There are no restrictions on the
selections created, i.e. they can contain any number of nodes and/or edges. Similarly, a node and/or
edge may be contained in any number of selections at the same time. However, selection keys are
unique in the selection set. Selections refer, rather than copy, to their nodes and edges. This means that,
if a given node or edge is in two or more selections, the selections refer to the same node or edge
Technische Universiteit Eindhoven
11
Version 0.1
31.10.2003
instance. Among other aspects, this allows an efficient selection management: one can quickly create
hundreds of selections dynamically in the SVF.
-All, None: define, explain need
Scene Graphs
Scene-graphs are the visual representation of graph data in the SVF. So far, we talked about nodes,
edges, and selections. However, these objects are not directly drawn, or visualized in any way, in the
SVF. The framework uses the 3D display and interaction toolkit Open Inventor to represent data
visually (see Section 2). The visual representation of a subgraph in an Inventor window is called a
scene graph, following Inventor’s own terminology. Consequently, to display something in the SVF,
one needs to a) select what is to be seen from the complete data and b) create a scene graph from the
selection. More on scene graphs and displaying data in SectionXXX.
3.2.2
Operations
Operations describe how the data representations, presented in the previous section, are created,
manipulated, and destroyed. Any action in the SVF that reads or writes data in any way is an operation.
One can see SVF’s working as being the application of a set of operations, in some sequence, on its
data.
To describe an operation, we must describe the way it accesses its data. Operations have conceptually
inputs and outputs. Inputs describe the way operations read their data. Outputs describe what the
operations change in the data. Operations may have three types of inputs and outputs:
Selections
Selections specify on which nodes and edges to operate. For example, to draw some data, one first puts
the data in some selection, called e.g. “sel”, and then invokes the display operation with the input “sel”.
Selections can also describe outputs. For example, the union operation may receive two selections
“sel1” and “sel2” and output “sel3”, a selection containing the union of nodes in “sel1” and “sel2”.
Attribute keys
Attribute keys specify on which attribute plane(s) the selection works. For example, an operation that
computes a global cost on some nodes, by adding up the costs of all nodes in its input selection, needs
the name, i.e. key, of the cost attribute to add up. Similarly, a layout operation takes as input a selection
containing a subgraph and assigns an (x,y) position to every node in the input. The layout operations
needs to know the keys (names) of the attributes in which to write the (x,y) positions of the nodes it
lays out.
Specific parameters
Operation specific parameters are parameters an operation has that are not selections or attribute plane
names. Such parameters are e.g. thresholds and other configuration values specific to the working of
the operation itself.
All the above is depicted in Figure 4. Here we see the general data flow diagram of the SVF that shows
the dependencies between the data and operation concepts.
Technische Universiteit Eindhoven
12
The Software Visualization Framework
User Manual
Graph
(structure)
Read
Selection
Read /Write
Operation
Read /Write
Attibutes
Read
Read
Mapper
Write
Inventor
scene-graph
Read
Renderer
Key
= Operation (edit, select, map, reader, etc...)
= Data (selection, graph, Inventor scene-graph)
Figure 4: General data flow diagram for the SoftViz tool
Technische Universiteit Eindhoven
13
Version 0.1
31.10.2003
To better understand the operations, we classify them into three types, from the point of view of
read/write data access:
Selection operations
This type of operation creates selection objects. A number of examples of selection operations in the
SVF follow below:
•
Level Selection (also called Horizontal Slice). In many cases, the graph one deals with has the
notion of hierarchy, or level. Lower levels are contained in higher levels. The edges between levels
are thus containment relations. Directory trees are the simplest examples of hierarchical graphs, in
which all edges are containment edges. More complex containment relations exist in multi-level
software architectures. For such graphs a level selection operation gathers all nodes and associated
edges on a certain aggregation level in the layered graph. This selection is useful for visualizing a
system at a given level of detail.
•
Tree selection (also called Vertical Slice). This operation gathers all nodes and containment edges
reachable, via containment relations, from nodes in a given input selection. For example, one uses
a tree selection to visualize subsystem structures.
•
Conditional Selection (also known as Filter). This operation gathers all elements in an input
selection that obey some attribute condition on its elements. Filters are useful for queries such as
‘show all nodes for which the cost attribute is higher than some threshold’.
The common aspect of selection operations is that they do not modify the graph data, but just create
new selections.
Graph editing operations
This type of operation constructs and modifies the graph data. There are two types of editing
operations:
•
Structure editing. Structure editing operations modify the structure of the graph by adding /
removing nodes and edges. For example, operations that read graphs from files in standard formats
(e.g. RSF, GraphEd, DOT, GXL) are structure editing operations.
•
Attribute editing . These operations create / modify / delete attributes from the nodes’ and edges’
attribute sets. Besides the selection input, attribute editing operations have also one or several
attribute plane names as inputs. The most common attribute editing operations are the metrics and
the graph layouts. The metrics may produce new attribute planes or single values. The graph
layouts produce position related attribute planes for the nodes and edges of a selection, and
decouple completely the mapping from the visualization of the graph. Complex graph layout
operations (e.g. stacked layouts, nested layouts) may be generated by cascading simple ones.
The common aspect of graph editing operations is that they do not modify the selection set but only th
graph data.
Mapping and visualization operations
This type of operation maps the graph data to visual objects, i.e. scene graphs, and allows the user to
interact with the data. Four types of SVF components collaborate to carry out such operations:
•
Mappers. These are components that map their input selections to Inventor scene graphs.
Examples of mappers in the SVF are the glyph mapper and the splat mapper. The glyph mapper
creates a glyph for each node and edge in the input selection, and positions these glyphs at the 2D
or 3D coordinates provided by an attribute plane of the input nodes and edges. Glyphs are
described below in this section. The splat mapper produces a splat field from the selected subgraph. The splat field can be viewed as a color or elevation plot.
•
Viewers. The viewers display the scene graph constructed by mappers, offer 2D and 3D
navigation, and support mouse-based picking operations on the displayed data. The result of a pick
operation is a subset of the input selection called highlight selection, which is displayed by the
viewer in a special color-highlighted manner.
Technische Universiteit Eindhoven
14
The Software Visualization Framework
User Manual
•
Glyph. Glyphs are 2D or 3D graphical objects that visualize a node or an edge in a viewer.
•
Glyphs factories. Glyph factories are small engines that are used by the mappers to construct a
glyph from the attributes of a node and/or edge. Glyph factories are called by the glyph mapper for
every node or edge. Various glyph factories let mappers customize the way in which they construct
their graphical representations.
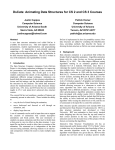
Figure 5 depicts a common example of data flow for a visualization scenario. The input selection is fed
into a layout operator that performs a graph-layout attribute-editing operation. The result of this
operation is an attribute plane that contains position information for the input selection. Enriched with
the position attribute, the input selection is further fed into a viewer. The viewer uses a mapper to map
the input selection to an Inventor scene graph which is then displayed it on the screen. If picking is
performed by the user in the viewer, a highlight selection is generated. This selection can be used
further on as input selection for other graph editing, mapping and viewing operations.
… or any other operation that modifies the
structure or the attributes of the nodes / edges
in the selection or even the selection itself
Input Selection
Layout operator
Position attribute
Viewer (mapper)
Highlight Selection
Contains a mapper that transforms the data
into a scene based on position and other types
of attributes
Figure 5: Common example of data flow for a visualization scenario
Technische Universiteit Eindhoven
15
Version 0.1
3.3
31.10.2003
Visualization Scenarios
Users perform several actions in a session of using the SoftViz tool. Such actions are loading a data
file, selecting some data, deciding how to map it via some glyphs, opening viewers, attaching some
actions to the mouse events in the viewers, etc. A particular set of all above mentioned actions form a
visualization scenario. Building expressive scenarios for a given number of datasets is essential for
getting insight into the data at hand.
Building an appropriate scenario for some given data may require a lot of time spent on analysis and
tuning. It is thus desirable to be able to restore a given scenario, once built, or to pass a given scenario
to other users so they can use it right away on their data. This section gives an overview on the way
visualization scenarios are represented and managed in the SVF.
3.3.1 Scenario Structure
The main property of a scenario is that it can be restored once it has been saved. In other words, a
scenario is persistent. It is thus important to understand what exactly gets saved, and how. The
structure of the visualization scenario in the SVF is depicted in Figure 6.
Scenario
*.tcl
references
1
references
*
references
1
include
inline
include
inline
*.dat, *.rsf, etc...
Graph file
*.tcl
Component library files
*.sel
Selection file
* Local Tcl procedures
(not components)
1
Tcl source text
(executed to restore
parameter settings for
all system parts)
Inline tcl
Inline tcl
Figure 6: Structure of a visualization scenario file
Every scenario references a file where the graph data is stored (i.e. Graph file). This file comes in
various formats (DAT, RSF, GVF, or some other formats supported by the system). The graph file
contains the relations and attributes of the nodes and edges in the graph.
A scenario must also save the selections existing in the system at a given point in time. The selections
are saved as a separate selection file which is referenced by the scenario file. The selection file contains
the names of the existing selection and, for each selection, references to its nodes and edges. The
reason for saving selections separately from the graph data is that users might want to use the same
graph data in different scenarios containing different selections. Replicating the usually large graph
data along with the different selections is thus not desired.
A scenario references also a number of component library files. A component library file contains a
number of components. Components, within this context, are Tcl procedures (scripts) used by the SVF
to perform a number of tasks, such as glyph construction, response to user actions in the GUI, layout
algorithms, and so on. The SVF can be customized with various component libraries that describe
various glyph construction, interaction, and layout mechanisms. Consequently, a scenario must
reference which component libraries have been used in a given session, so that, upon reloading it, the
Technische Universiteit Eindhoven
16
The Software Visualization Framework
User Manual
user gets the same system behavior. For this, the scenario contains references to the Tcl files describing
the component libraries. More on component libraries in Section 4.2.
Besides reusable Tcl components coming in the form of component libraries, a scenario might contain
some specific Tcl scripts as well. For example, a user has written some specific Tcl procedure for a
given scenario, but hasn’t included it in any component library. In this case, the scenario will save the
full source text of the Tcl procedure in-line in the scenario file. The reason hereof is to be able to
restore the Tcl procedure upon resuming the scenario.
The overall goal of the above scenario structure is to make reusable as many elements of a scenario as
possible. We do this by referencing the elements in the scenario file rather than including them inline.
Reusable elements are graph data, component libraries, and selection files. These elements are referred
by their corresponding file names in a scenario file. If, thus, some user wants to apply a given scenario
on another data file than the one the scenario was built upon, he should only replace the reference to the
original data file in the scenario with a reference to the new data file. Similarly, new component
libraries can be automatically used by a scenario instead of the ones it was built for, as long as they
have the same name and provide the same Tcl API. This mechanism allows, for example, visualizing a
given dataset in different ways, just by replacing the graphics-related component libraries in a given
scenario.
The selection files are a particular case. They always refer to (i.e. ‘select’) a particular data file, so they
cannot be, in general, reused in other scenarios than the ones they were created for. However, they are
stored as separate files, as explained, in order to keep the scenario file concise.
3.3.2
Scenario Saving and Restoring
The SVF offers a mechanism by which visualization scenarios may be saved in a persistent storage and
restored at a later moment. Figure 7 depicts this mechanism in detail. At the base of each scenario there
is a file containing information about the structure of the system to visualize, in the form of an
attributed graph (see also Section 3.2). More visualization scenarios may be based on the same
attributed graph, and the host graph file never modifies.
*.dat
*.rsf
etc...
visualization
Visualization
scenario
1
- Selections
- New attributes
- Settings: (viewers, callbacks, scripts)
…….
Graph data in
different formats
Scenario files
Visualization
scenario
n
Restored
Visualization
scenario
n
save
1) Graph (*.dat, *rsf, etc...)
2) Selections (*.sel)
3) Scenario script (*.tcl) - we load this
restore
Contains commends to restore the scenario:
- viewers preferences, GUI
- Tcl libs to be loaded
-…
Example:
pr_load_data “my_graph.dat”
pr_include “my_lib.tcl”
Figure 7: Scenario save / restore mechanism
While building a visualization scenario, a number of selections, attributes and operations can be
defined. In order to restore a visualization scenario from its persistent state, information about these
entities has to be saved too. The selections and the attributes defined during the visualization scenario
are stored in a *.sel file. The particular operations defined during visualization are stored in a *.tcl file.
The *.tcl file is actually the only one that needs to be passed to the SVF for restoring a scenario.
Technische Universiteit Eindhoven
17
Version 0.1
31.10.2003
Besides operations, this file contains also necessary commands to load data from the associated *.dat
and *.sel files (that are part of the visualization scenario), and the domain specific Tcl libraries.
Technische Universiteit Eindhoven
18
The Software Visualization Framework
User Manual
4 Framework customization guidelines
The SVF has three layers of customization that allows a user to tailor it for a specific scenario.
Depending on the proficiency of the user and on the generality of the tailoring action, the customization
can range from the Runtime layer to the Tcl and, eventually, the Kernel layers.
4.1
4.1.1
Runtime Layer
Purpose
At this layer, scenario-specific customization actions can be performed. In general words, the runtime
layer provides both a widget-based GUI and a command-line interface to the operations contained in
the SVF. Users can thus apply most of the operations by invoking them via the command line and/or
GUIs (see Figure 8) and supplying the necessary inputs and outputs (selection names, attribute plane
names, and special parameters). For an overview of these concepts, see Section 3.2.
Runtime
End User
GUI
Tcl Scripts
Tcl
Developer / Extender
Kernel
System Architect
Figure 8: The customization scope and target for the Runtime layer
As explained above, the runtime GUI actions are translated to Tcl actions that are either directly
executed by the Tcl interpreter or passed to the kernel layer. The reason to be of the GUI interface is to
present the (Tcl level) functionality in a more compact and easy to use way. In principle, there can be
as many GUI elements as functionalities provided by the Tcl layer. Moreover, these GUIs can be
modified to suit different look and feel policies without changing the Tcl layer. Consequently, we shall
not describe all the GUIs in detail. For the sake of exposition we shall describe one GUI, namely the
one providing runtime mapper customization.
4.1.2
Mapper Runtime Customization
The mapper runtime customization provides a set of GUIs that allow interactive changing of the
mapper subsystem (see Sec. 4.3.3 for a complete description thereof). There are four sub-levels of
tailoring in the Runtime customization layer for mappers(see Figure 9). They range from sub-levels
that address general features of visualization (i.e. Node / Edge mapper – see also Section 3.2) to sublevels where the actual appearance of nodes and edges can be easily tailored (i.e. the Tcl procedure
sub-level )
Technische Universiteit Eindhoven
19
Version 0.1
31.10.2003
2) Node / Edge mapper sub-level
3) Factory sub-level
4) Tcl procedure sub-level
Choose among:
- Basic
- Splat
- Factory
- other
Choose among different types of
factories:
- Basic
- TclGlyphFactories:
- etc
Example:
“if N large the draw red cube else draw
blue sphere”
However, customization should be possible at this point also, at the level of
choosing a different instance with the properties set by the following points.
In other terms, at this point, fast transition between different appearances
could be made available. In the current implementation, this is done in point
3, so customizations done in level 2 cannot be used for fast switching.
Particular features
Chosse among different possible
representations based on the analysis of
the input parameters
General features
1) Mapper sub-level : fixed so far
At this level, domain specific
libraries should be initiated and only
if really necessary the changes
should be introduced in upper
levels (the Tcl factories should be
enough for the most cases)
Figure 9: The four sub-levels of tailoring for the Runtime customization layer
Mapper
For the time being no customization is possible at this level. Nevertheless, the
intent is to make customization possible here too, by allowing the user to easily
switch between more instances of the same visualization scenario.
Node / Edge Mapper
At this level the end-user can switch by means of the GUI among three
possible mappers (see also Section 3.2) for the edge and the nodes of the
graph: Basic (default), Splat and Factory. Basic is the default node / edge
mapper. The SoftViz tool will also use it for graceful degradation, when
runtime errors are encountered in other selected mappers (e.g. Factory). The
Splat mapper produces a splat field from the selected nodes and edges and can
be displayed as a color or elevation plot. The Factory mapper is used whenever
the user wishes to specify a building engine (i.e. factory) that can be applied to
each node or edge.
Factory
When the Factory mapper is chosen as a mapper for a visualization scenario,
the user can select at this level the specific type of factory to be used. At this
moment, two alternatives are available: Basic (default) and TclGlyphFactory.
Basic is the default factory mapper. The SoftViz tool will also use it for
graceful degradation, when runtime errors are encountered in other selected
factory mappers (e.g. TclGlyphFactory). The TclGlyphFactory type of factory
mapper allows the user to select a Tcl procedure that specifies the appearance
of the nodes and edges in the visualization scenario.
Tcl procedure
At this level, the user can define a specific Tcl procedure that will determine
the appearance of nodes and edges in the visualization scenario, when the
TclGlyphFactory type of factory mappers is used.
4.1.3
Requirements
The Runtime layer of customization has a small understanding threshold, as it does not require deep
knowledge of the system. Therefore, it is suitable for end-users. At the most basic level, users should
be able to load already saved scenarios to restore the system in a given state and just navigate in the
viewers to visualize the data. Next, users can start executing a number of actions by manipulating the
GUI of the tool. For this, knowing the tool’s GUI is required together with a good understanding of the
visualization concepts and operation principle (see Section 3.2).
Technische Universiteit Eindhoven
20
The Software Visualization Framework
User Manual
For more advanced users (e.g. users that aim to specify their own procedures for the TclGlyphFactory),
basic knowledge of the Tcl scripting language is required, and good understanding of the SoftViz Tcl
public libraries for manipulating nodes, edges, selections, layouts and viewers (see Appendix I).
Technische Universiteit Eindhoven
21
Version 0.1
31.10.2003
4.2
Tcl Layer
4.2.1
Purpose
At this layer, general customization actions can be performed. These actions are expressed by Tcl
scripts, and they are intended to encapsulate in the framework tailoring actions that occur in a large
number of scenarios (see Figure 10). The Tcl scripts created at this level are to be included in Tcl
component libraries and they can be used by end-users during Runtime layer customization of their
visualization scenarios.
Runtime
End User
GUI
Tcl Scripts
Tcl
Native
Tcl
Via
C/C++ Kernel
Tcl
system
libraries
Kernel
Developer / Extender
System Architect
Figure 10: The customization scope and target for the Tcl layer
The Tcl layer consists of three subsystems: built-in, native C++, and compo libs
The reason of subdividing the Tcl layer functionality into these three parts is that there are different
ways of providing it: built-in is what Tcl offers natively, mainly scripting and control structures; native
C++ is just a way of exposing the kernel functionality to the upper layers, so this subsystem is nothing
but a translation layer from the compiled to the interpreted; The ‘Compo libs ‘ subsystem attempts to
provide reusable Tcl scripts. Since Tcl does not do this natively, we implement this reusability
functionality in the Compo Libs.
One section explaining each must come below!
4.2.2
Provisions
The SVF offers a mechanism by which Tcl component libraries can be defined, implemented and than
used by end-users during runtime customization (see Figure 10). These libraries (i.e. Tcl system
libraries) are to be implemented in the Tcl language, using standard Tcl calls (i.e. Native Tcl), Tcl
proxies to natively implemented data structures (i.e. Via C/C++ Kernel), and even other system
libraries. The file format of a Tcl component library has two parts (see Figure 11):
-
the registration part, where the name, the type, and the textual description of the methods
contained in the library are indicated
-
the definition part, where the actual implementation of the library methods is done.
Technische Universiteit Eindhoven
22
The Software Visualization Framework
User Manual
General manager of Tcl component
libraries, that provides mechanisms for
loading / unloading libraries
ComponentLibrarySet
MyLib1.tcl
MyLib2.tcl
*
MyLib3.tcl
REGISTRATION
ComponentLibrary
pr_comp_lib add_proc name1 “text descriptor 1”
pr_comp_lib add_proc name2 “text descriptor 2”
*
DEFINITION
GlyphProc
name1 { body1 }
name2 { body2 }
A set of Tcl components stored as a
single file
A single Tcl procedure stored in a
component library identified by :
- a registration part (where the
procedure is registered with the Tcl
environment so that it can be used in
Tcl scripts)
- a definition part (where the Tcl
procedure is actually built)
In the visualization scenario, the domain specific
libraries are loaded with the command
pr_compo_lib load MyLib3.tcl
Figure 11: The Tcl system library development support
In order to be able to use the methods offered by a library, one should load first the library in the
system. This can be done by using the Tcl command pr_compo_lib that belongs to the SoftViz
standard Tcl system library (loaded by default). For a detailed description of this method see
Appendix I.
At runtime, the SVF maintains a list with all currently loaded libraries. The standard system library
offers methods to browse this list and the contents of the loaded libraries, based on the information
supplied in the registration part of their implementation files.
4.2.3
Requirements
This level of customization has a medium level of difficulty. Nevertheless, it requires a good
conceptual knowledge of the domain for which the library is intended. Therefore, it is suitable for more
advanced users, namely for those who intend to extend the system with domain specific Tcl system
libraries.
Technische Universiteit Eindhoven
23
Version 0.1
4.3
4.3.1
31.10.2003
Kernel Layer
Purpose
At this layer, very general customization actions can be performed. These actions are written as
compiled C++ code. They implement general, system-wide operations such as data access and
operation synchronization. Only actions that are specific to all visualization scenarios or that have strict
speed and memory constraints should be embedded at this layer in the framework.
Runtime
End User
GUI
Tcl Scripts
Tcl
Native
Tcl
Tcl
system
libraries
Via
C/C++ Kernel
Developer / Extender
Kernel
System Architect
Figure 12: The customization scope and target for the Kernel layer
4.3.2
4.3.2.1
Provisions
General data flow diagram
Figure 13 contains the data and command flow diagram for the SoftViz tool.
GUI
Tcl user
scenarios
TK
Tcl library
Tcl scripts
(pr_*)
Tcl
Native
Tcl
Via
C/C++ Kernel
Tcl
system
libraries
call
C/C++ Kernel
Tcl via kernel
commands
Mapper
(basic, low-level
access to data
structures)
Operations
read
IVMapper
Graph Manager
inspects
writes
Inventor scenegraph
(the scene to be rendered, i.e. all
So* objects)
singletone
So...
Element
node
SelectionList
*
SoLine
write
Has attributes:
{(name,value)*}
GraphManager
SoCamera
SoCube
Operation
Edge
Node
*
*
Selection
Figure 13: General data flow diagram for the SoftViz tool
Technische Universiteit Eindhoven
24
The Software Visualization Framework
User Manual
The end-user commands are acquired by means of the GUI and/or some user-defined Tcl scripts at the
Runtime customization level. These commands are forwarded then to a Tcl interpreter where they are
converted into actions (by Native Tcl). Part of these actions can be executed by the Tcl interpreter
itself. Others need to be pre-processed (by Tcl system libraries) or are redirected to the C/C++ Kernel
implementation of the SoftViz tool (by Via C/C++ Kernel).
The commands that are implemented in C/C++ Kernel are designed to build, manage and visualize the
Inventor scene representation of the graph.
In the following, we shall detail the most important subsystems of the Kernel layer. For the developer,
the most interesting subsystems are the ones that are the most likely to be extended or customized.
Among these, we discuss:
•
•
Mapper subsystem: implements the mapping of graph data to Inventor scene graphs.
(Other ones will come in here…)
4.3.3
Mapper Subsystem
As explained before (see Section 3.2), mappers provide various level of functionality in terms of
- mapping the selected graph data to visual representations, in terms of drawing node and edge
representations as well as drawing the selected elements in a separate way.
- allowing one to query which elements (nodes or edges) are at a particular position in space.
Both above functionalities are optional, in the sense that a mapper may decide to implement them in
any way, including not implementing part of whole thereof. This allows one to easily develop new
mappers in an incremental way.
The mappers are organized in a class hierarchy, rooted at IVMapperBase. This is essentially an
implementation hierarchy. That is, lower levels do not add provisions to the mappers, but specialize in
implementing the provisions. The hierarchy is shown in Figure 14.
The following outline the reasons for implementation of the various levels in the mapper hierarchy:
IVMapperBase
Provides just the global interface all mappers must support – that is…. [TO DO]
IVMapper
Specializes IVMapperBase by using two separate mappers, one for the edges and one for the nodes.
The reason for IVMapper is to allow separate customization of node and edge mapping. This should
reduce the total number of mappers one has to write to achieve a given functionality. The node and
edge mappers are subclasses of IVMapperImp (‘Imp’ stands here for implementation class). The
provisions of IVMapper are basically delegated to its two (node and edge) IVMapperImp
subclasses.
So far, we have specialized only the IVMapperImp subclasses, i.e. we have only implemented a
number of separate node and edge mappers. It is though possible, if needed, to implement new
IVMapperBase subclasses, if a totally different way of drawing graphs is desired. For example,
matrix plots are probably best supported as direct IVMapperBase specializations.
Technische Universiteit Eindhoven
25
Version 0.1
31.10.2003
Mapping
Has operation map that outputs drawable
representation of the input selection
IVMapperBase
IVMapperImp
The Graphical data
- Implements map separately for nodes / edges
- Implements pic, move, highlight
IVMapper
creates
SoSeparator
IVNodeMapper
uses
Similar structure with IVNodeMapper
(not represented here)
IVEdgeMapper
Viewing
default
IVBasicNodeMapper
IVFactoryNodeMapper
IVViewer
IVSplatMapper
s et aer c
Selection
Calls a factory for each node
IVNodeGlyphFactory
IVTclGlyphFactory
Name of a Tcl
procedure
default
IVBasicNodeGlyphFactory
Has operation map that makes a
standard cube per node
IVTclNodeGlyphFactory
Customization
required
pr_my_proc (Node)
{
get stuff from node;
return glyph nodes by calling gfx Tvl_proc
}
Has operation map that calls Tcl procedures with argument of
type Node * and returns result with type SoNode *
TclApi
IVGlyph
Figure 14: Mappers class hierarchy
IVNodeMapper ( IVEdgeMapper )
Specializes IVMApperImp for mapping nodes (edges).
IVBasicNodeMapper (IVBasicEdgeMapper)
This is a very memory and speed efficient mapper that draws every node as a 3D cube (every edge as a
line). No difference between the nodes (edges) is shown. This is the default mapper the system uses in
case no preferences are given or in case of falling back upon an error in the other mappers.
IVSplatMapper
Contains a basic implementation for a splat mapper.
IVFactoryNodeMapper (IVFactoryEdgeMapper)
This mapper is the ‘entry point’ for providing per-node custom drawing. Customization is done by
allowing the IVFactoryNodeMapper to call a ‘glyph factory’ for every node it needs to draw. The
factory is a subclass of IVNodeGlyphFactory. The factory receives the node to be drawn and must
return an Inventor object (SoNode subclass) that is drawn for that node. The factory can decide upon
how to draw that node. from this point on, specializing the drawing can be done by specializing the
IVGlyphFactory, not the IVFactoryNodeMapper. A second feature of this construction is that
IVFactoryNodeMapper can switch, at runtime, between different factories, and thus draw the
same graph, or even parts thereof, in different ways.
A similar specification holds for the IVFactoryEdgeMapper.
IVBasicNodeGlyphFactory ( IVBasicEdgeGlyphFactory )
Technische Universiteit Eindhoven
26
The Software Visualization Framework
User Manual
This is the basic node glyph factory class. It constructs a 3D cube for a given node. Functionally, it is
very similar to IVBasicNodeMapper. The difference that it is called separately for each node
whereas IVBasicNodeMapper is called once for a whole selection. Just as IVBasicNodeMapper,
IVBasicNodeGlyphFactory is automatically used by the mapper system as default factory or in
case some custom factory has failed working.
A similar specification is available for the IVBasicEdgeGlyphFactory.
IVTclNodeGlyphFactory (IVTclEdgeGlyphFactory)
These specializations of the basic glyph factories implement glyph creation by calling a user-supplied
Tcl procedure. The idea is to allow users to design their node and edge glyphs by writing (small) Tcl
procedures rather than C++ code. In this way, one can not only switch between factories at runtime, but
can also adapt and develop new factories at runtime, by directly editing the Tcl procedures. Ultimately,
a visualization scenario can employ a single mapper, using a single node glyph factory, that can switch
between a number of Tcl glyph-construction procedures. For a list of available glyphs see Appendix I.
These glyphs are implemented in C++ in the TclApi.cpp file in the root folder of the source code for the
SoftViz tool. When writing new C++ implementations for glyphs, a number of steps are to be followed.
In the example bellow, the steps for building a node glyph are presented:
1.
Declare (preferably in the IVGlyph.cpp root file) and build a C++ glyph function that returns a
pointer to a value of type SoNode. This function should have the form SoNode*
my_func (char* []). The list of arguments contain both standard (e.g. color 0.1 0.2
0.1) and implementation specific parameters.
2.
Inside the function body create a SoGroup variable
3.
Add default nodes to the created SoGroup (i.e. SoColor, SoMaterial, etc…)
4.
Add specific stuff to the SoGroup (i.e. the code that actually builds the glyph)
5.
6.
Return as function result the created SoGroup variable
Wrap the function in a Tcl shell using the following template:
int pr_make_my_glyph(ClientData cd,Tcl_Interp* in,int n,Tcl_Obj* CONST obj [])
{
//-------------------------------------------------- get Tcl args --char* args[20]; int i;
for(i=1;i<n;i++) args[i-1]=Tcl_GetString(obj[i]);
args[i-1]=0;
//-------------------------------------------- make IV cube glyph --Tcl_Obj* res = Tcl_NewLongObj((long)(unsigned long)IVGlyphs::my_func(args));
Tcl_SetObjResult(in,res);
return TCL_OK;
}
7.
The bold case indicates the textual changes that are to be performed.
Register the function with the Tcl environment in TclApi.cpp using the following command:
TclCreateObjCommand(interpreter, “Tcl_name”, my_func, context_data);
interpreter
instance of the Tcl interpreter used for interpreting the Tcl
scripts in the application
“Tcl_name”
name to be used for calling the native procedure in the Tcl
scripts
c_name
the name of the native procedure into the Kernel
context_data
pointer to pass context data to the interpreter
(usually not used = 0)
A similar specification holds for the IVTclEdgeGlyphFactory
Technische Universiteit Eindhoven
27
Version 0.1
4.3.3.1
31.10.2003
Mapper design trade-offs
As outlined, there are a number of trade-offs in the design of the mapper hierarchy. As a rule, higherlevel classes are simpler and faster to use, but less customizable. Lowe-level classes offer more finegrained functionality and customizability but are more involved to set up and take more time and
memory.
A few things must be noted when using mappers. The Inventor scene graphs can take quite some time
to construct and render. The memory and speed are proportional to the scene graph’s overall size and
the amount of data-sharing within. Whenever possible, the mappers attempt to share data when
constructing such graphs. For example, a IVBasicNodeMapper will construct only one cube
instance for all the nodes, but draw it at the different locations specified by the layout. However, a
IVTclNodeGlyphFactory is obliged to construct a different Inventor scene subgraph for each
node, as it cannot assume any similarities for the different nodes. Moreover, it has to interpret a Tcl
procedure call per node. This makes the memory and speed consumption of Tcl-based factories quite
high. In practice, Tcl factories become quite memory and speed demanding for graphs over a few
hundred nodes.
There are several solutions to this problem. First, specialized mappers, higher in the hierarchy, could be
constructed for a given class of drawings. Second, some more complex data-sharing and Tcl
interpretation caching mechanisms could be implemented in the glyph factories.
4.3.3.2
Syntax of the native implementation for Tcl system library commands
A Tcl command implemented in C++ should have the following structure:
int pr_xxxxx (
ClientData cd,
Tcl_Interp* in,
int n,
const TclObj* obj[]
)
{
char* argument_i = Tcl_GetString(obj[i]);
…
char* result = “my result”;
Tcl_SetObjResult(in, Tcl_NewStringObj(result,-1));
// for a string
return TCL_OK;
// or TCL_ERROR
}
Input / output parameters description:
The instance of the Tcl interpreter
The number of arguments = real arguments + 1 ( for the procedure name)
The array of arguments
The result that the procedure has to return to the caller in the Tcl environment. this value is
not is not returned via the classic return mechanism, but through a special call.
in
n
obj
result
The command will be used then in Tcl in the following way:
pr_xxxxx
arg1 arg2 arg3 …
Remark: the pr_xxxxx is treated in the native environment as arg0
4.3.4
Requirements
This level of customization requires deep understanding of the system architecture of the visualization
framework. Therefore it is only intended for very advanced users, namely system architects and similar
roles, who wish to tailor the kernel (native C++) representation of data structures and access to them.
Technische Universiteit Eindhoven
28
The Software Visualization Framework
Technische Universiteit Eindhoven
User Manual
29
Version 0.1
31.10.2003
Glossary
API
GUI
matrix plot
Application Programming Interface. Set of functions / procedures that a
software library / module / component offers to application developers that
wish to integrate in an application the functionality provided by the library /
module /component.
Graphical User Interface. The on-screen representation of the user interface of
a system.
Representation model for a graph, in form of a matrix, in which the rows and
the columns represent nodes in the graph and the cells indicate whether there is
an edge between the nodes that are the coordinates of the cell.
References
[1] A. Telea & all, An Open Toolkit for Prototyping Reverse Engineering Visualizations, 2002,
Joint EUROGRAPHICS-IEEE TCVG Symposium on Visualization (2002)
Technische Universiteit Eindhoven
30
The Software Visualization Framework
User Manual
Appendix I: List of the SVF Tcl layer native commands
LOAD / WRITE commands
pr_read_sel_file <*.sel>
Reads a file that contains a selection. Puts the selection into the standard All selection.
pr_load_own_format [sel_name] <*.dat>
Reads a file that contains a graph and puts it into the sel_name selection. If sel_name is not
present, the result is put into the standard All selection. similar operation exists for writing a graph.
pr_write_sesion <*.tcl>
Saves a scenario into a *.tcl file
pr_compo_lib load <mylib.tcl>
Loads a library into the system, so that one can use methods that belong to that library.
SELECTION commands
<int> pr_num_selections
Returns the number of selections that are active in the environment.
<Selection*> pr_get_selection <”name”> <char* selection_name>
Returns the selection that is identified by the string selection_name
<Selection*> pr_get_selection <”idx”> <int i>
Returns the selection that is identified by the integer id i.
<Selection*> pr_new_sel [char* name]
Creates a new selection identified by the string name. If the parameter is missing a standard (unique)
name is given.
pr_selection <Selection* s> <options…>
Stereotype for general purpose operations on selections
pr_selection_op <Selection* s1> <Selection* s2> <Selection* Result>
Applies the binary operation op on s1 and s2 and puts the resulting selection in result. (e.g. reunion,
intersection)
LAYOUT commands
pr_lay_* <char* selection_name> <char* pos_attr> <attributes...>
pr_lay_nested <char* selection_name> <char* pos_attr> <traverse?
name? val?>
Performs a layout attribute editing on a certain selection.
EDITING commands
<Node*> pr_get_node <char* selection_name> <”id”> <int idx>
Returns the node with the id idx from the selection selection_name
<Node*> pr_get_node <char* selection_name> <”attr”> <char*
attribute_name> <value>
Returns the node with the attribute attribute_name set to a certain value, from the selection
selection_name
pr_node <options…>
various operations for editing the attributes of a node
Remark: similar operations exist for edges
VIEWER commands
Technische Universiteit Eindhoven
31
Version 0.1
31.10.2003
pr_view_new <char* view_name> <char* sel_name> <char* pos_attr>
Creates a new viewer that renders the nodes of the selection sel_name using the layout attributes
from the pos_attr.
GLYPH DRAWING commands
pr_make_cube [color <int r> <int g> <int b>]
Draws a cube with the specified color components.
pr_make_sphere [color <int r> <int g> <int b>]
Draws a sphere with the specified color components.
pr_make_line [color <int r> <int g> <int b>]
Draws a line with the specified color components.
pr_make_file [color <int r> <int g> <int b>]
Draws a file icon with the specified color components.
pr_make_bar [color <int r> <int g> <int b>]
Draws a bar with the specified color components.
pr_bbox [color <int r> <int g> <int b>]
Draws a ? with the specified color components.
MISCELANEOUS commands
<Iterator*> pr_selection <Selection* s> <”iter_nodes”|”iter_edges”>
Returns an iterator for the nodes or the edges of the selection s.
<Node* | Edge*> pr_iterator <Iterator* i> <”next_node” | “next_edge”>
Returns the next node or edge from the iterator i. When it reaches the end it auto-destroys itself.
Technische Universiteit Eindhoven
32
The Software Visualization Framework
User Manual
Appendix II: List of desired features
ID
001
002
003
004
Feature description
Unify the aux and primary mappers. One should simply have an IVViewer with a
(fixed) set of all known node/edge mappers that can be on/off toggled. Picking could
either use the 1st or an OR between picks in all mappers. The IVMapper should
simply maintain a list of IVNode/EdgeMappers. Should be quite simple to do.
Finish the splat mapper'
s resources (Tcl / GUI, etc) so it becomes really functional.
Enhance the brushText() function to handle multiline text (ended by \n'
s). Make an
example to show this, via a Tcl sweep_cb
Build a few '
standard'node/edge glyphs (and possibly other Tcl-based settings?) into
a'
domain package'
. This is simply a Tcl file that could be automatically sourced
before a given RSF domain is loaded. Sourcing another file lets one easily change all
appearances in a given app WITHOUT re-running / editing the app. Such a domainpackage would contain e.g:
Priority
HIGH
HIGH
HIGH
HIGH
- node and edge mappers drawing something meaningful for all types in the
domain-model
- some other global settings (layout? mapper? viewer?)
005
006
007
008
009
010
011
012
Expose NeatoLayoutOp::get/setCompact() in Tcl API & GUI
Finish the updating of the Viewer Panel (menu Options) "2D render" checkbox. It
works ok, but its state doesn'
t reflect the core data when we change the viewer. The
problem is that I don'
t know how to set the state of a checkbox-entry in a Tcl menu.
ode the UNIX equivalent of the new SoUIExaminerViewer (new options, e.g. userbuttons, etc). Test newest version under UNIX please.
LayoutOp::layout() is not fully correct. Pinned nodes'positions are restored - but
what do we do with edge pinning? This is important e.g. in case edges are layed out
separately.We should probably automatically restore all edges connected to pinned
nodes, too.
Make the Glyphs GUI also an observer (it has to update e.g. after a reset()). Take
care, so far it has no '
global'refresh(). Also take care that its destroy-event should
remove the observer, as the other GUIs do.
Maybe a more efficient GUI policy would be to keep all (currently separate) GUI
windows as panels in a Tab-window. This will reduce the chaos of multiple,
randomly stacked, windows on the screen.
Add an option to the IVBasicNode/EdgeMappers to set a color for ALL nodes/edges
- just a simple color-node inserted before the subgraphs for nodes and edges. Expose
this option in the GUI. Then investigate how easy is to parametrize node/edge color
in the basic mappers by something else, e.g. an attribute-plane. This would make
these mappers more functional.
Now that we removed the delNode()/delEdge() from Observer, deleting a Node/Edge
triggers a full update() of an Observer. We could speed this up by:
HIGH
HIGH
HIGH
HIGH
HIGH
HIGH
HIGH
LOW
-adding a set of reasons with the AttrSet::touch(). Caller could specify WHY he
touches the object.
Technische Universiteit Eindhoven
33
Version 0.1
31.10.2003
-inquiring, in the Observer'
s update(), for the reason. If the reason is e.g. ONLY
DEL_NODE or so, then a lighter update could be triggered that would check which
node(s) are deleted, i.e. are in Observer but NOT in Selection, and then do a
delNode() on them in Observer. However, I don'
t yet know whether this is really
going to give a visible performance improvement...
013
014
015
016
017
018
Make reader for .dot format. May be complex since the .dot format is quite complex.
See GV1.8 documentation.
Add comprehensive error-msgs to the Tcl wrappers (arg/result checking)
Setting a DomainModel into the GraphManager simply deletes the previously set
DomainModel, if any was there. Do we want this?
REMARK: The program creates attrs on its own. This may easily conflict with attrnames created by the domain-model. For example, the "pos_" attrs created by the
layout-tools or the "name" attrs created by the file-readers... We should devise a
scheme that introduces new attr-names without intruding over the names declared by
the eventual domain-models. Underscore-prefixed names maybe?
MAYBE: add a tool to scale highlight-sel in a viewer, in the same way we translate it
now.
MAYBE: when layout-with-imposed-bbox done, pinned nodes may:
LOW
LOW
LOW
LOW
LOW
LOW
-remain pinned RELATIVE to the bbox, which means that absolutely they
may move.
-remain pinned ABSOLUTELY, which means that their relative position in
the bbox may change.
So far I chose for the 1st option. I'
m not sure whether this is the best. The 2nd
could be done too - simply adapt the code in LayoutOp::layout().
Technische Universiteit Eindhoven
34