1
7.
Results Visualisation
7.1
Overview
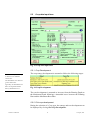
WaSim incorporates an extensive results visualisation engine to enable
the output from simulations to be displayed, evaluated and compared. The
results from up to 5 simulations can be loaded into memory at any one
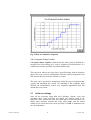
time. The results can be displayed in tables, plotted in charts and
summarised (by month, year or season) as required.
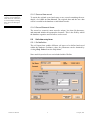
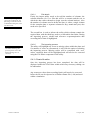
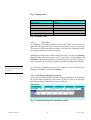
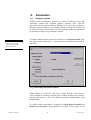
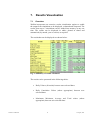
The results that can be displayed are shown below:
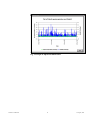
Fig. 27 Summary of results calculated
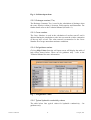
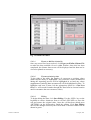
The results can be presented in the following tables:
WaSim User Manual
•
Daily Values (all results) between user-selected dates
•
Daily Cumulative Values (where appropriate) between user
selected dates
•
Maximum, Minimum, Average and Total values (where
appropriate) between user-selected dates
33
17 August, 2001