1
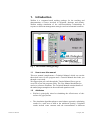
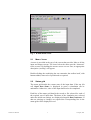
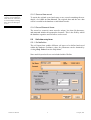
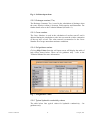
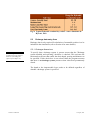
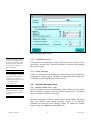
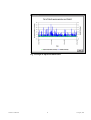
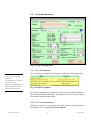
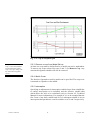
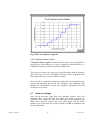
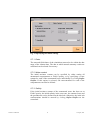
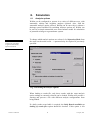
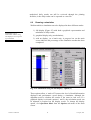
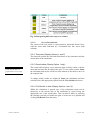
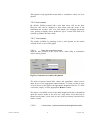
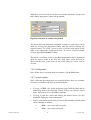
IWASRI
WaSim
User Manual
This manual is an output of Project R6879, funded by DFID under the Knowledge
and Research (KAR) Programme. The work was undertaken by HR Wallingford and
Cranfield University (at Silsoe), with the active participation of the International
Waterlogging and Research Institute (IWASRI), Pakistan.
The DFID KAR Project details are:
Theme:
W5 – Improved availability of water for sustainable
food production and rural development.
Project title:
Aids to Improved Agricultural Development
Project No:
R6879
This document is an output from a project funded by the UK Department for
International Development (DFID) for the benefit of developing countries. The views
expressed are not necessarily those of DFID.
Authors;
Chris Counsell (HR Wallingford)
Tim Hess (Cranfield University)
19 October 2000
HR Wallingford
Howbery Park
Wallingford
Oxfordshire
OX10 8BA
UK
Institute of Water and Environment
Cranfield University
Silsoe
Bedford
MK45 4DT
UK
http://www.hrwallingford.co.uk/
http://www.silsoe.cranfield.ac.uk/
© HR Wallingford, 2000
Visit: http://www.hrwallingford.co.uk/projects/WASIM.html or
http://www.silsoe.cranfield.ac.uk/iwe/wasim/
Contents
1.
Introduction....................................................................1
1.1
1.2
1.3
2.
How to use this manual....................................................................... 1
Attributes ............................................................................................ 1
On-line help ........................................................................................ 2
Main Screen....................................................................2
2.1
2.2
2.3
3.
Menu / icons: ...................................................................................... 3
Status grid ........................................................................................... 3
Status bar............................................................................................. 4
User Levels/Access Permissions ...................................4
3.1
4.
Setting/clearing passwords.................................................................. 4
WaSim Database............................................................4
4.1
4.2
4.3
4.4
4.5
4.6
4.7
4.8
5.
Crop / irrigation relationship............................................................... 5
Record selection form ......................................................................... 6
Sorting available records..................................................................... 6
Resizing columns ................................................................................ 6
Viewing and editing a record.............................................................. 7
Define a new record ............................................................................ 7
Deleting records .................................................................................. 7
File operations..................................................................................... 7
Data Input.......................................................................8
5.1
5.2
5.3
5.4
5.5
5.6
5.7
6.
Common features ................................................................................ 8
Soil data entry form ............................................................................ 9
Drainage data entry form .................................................................. 11
Climate data import form.................................................................. 12
Crop data input form......................................................................... 19
Irrigation data input form.................................................................. 21
Initial run settings ............................................................................. 26
Simulation.....................................................................28
6.1
6.2
7.
Analysis options................................................................................ 28
Running a simulation ........................................................................ 29
Results Visualisation....................................................33
7.1
7.2
7.3
7.4
7.5
8.
Overview........................................................................................... 33
Daily/Cumulative Results table ........................................................ 34
Seasonal/Annual/Monthly Summaries.............................................. 37
Export Results As CSV..................................................................... 38
Plotting results .................................................................................. 39
Technical Issues ...........................................................43
8.1
8.2
WaSim Specification ........................................................................ 43
Year 2000 Compliance ..................................................................... 44
Acknowledgements.................................................................44
WaSim User Manual
i
17 August, 2001
WaSim User Manual
ii
17 August, 2001
1.
Introduction
WaSim is a computer-based training package for the teaching and
demonstration of issues involved in irrigation, drainage and salinity.
WaSim enables simulation of the soil/water/salinity relationships in
response to different management strategies and environmental scenarios.
Fig. 1 The WaSim training package
1.1
How to use this manual
This user manual complements a Technical Manual, which sets out the
theoretical bases for the program and a Tutorial Manual that leads you
through a case study.
We suggest that you work through the Tutorial Manual first to get an
overview of how the program works. The User Manual should then be
used as a reference document. The Technical Manual contains details of
the underlying assumptions in the model and equations used.
1.2
WaSim User Manual
Attributes
•
WaSim is principally aimed at simulating the effectiveness of subsurface tile (pipe) drains.
•
The simulation algorithm adopts a mass-balance approach, calculating
results for a unit area of land at the mid-drain spacing. Calculated
results include water contents and salt concentrations at different
1
17 August, 2001
points in the soil profile, along with drainage flows and water table
depths.
•
WaSim runs on a daily time-step using actual rainfall and reference
evapotranpsiration data (an associated WaSim-ET program is
provided to calculate reference evapotranspiration from weather
station data)
•
Simulation runs of up to 30 years in duration can be undertaken
•
A sequence of up to three crops in a cropping pattern (+ fallow) can
be specified, with each crop season lasting up to 2 years
•
Only single layered soils can be simulated
•
WaSim can also be run as an unsaturated water balance simulation
with irrigation, drainage/watertable and salinity options
selected/deselected independently as required
1.3
On-line help
There is context-sensitive on-line help provided with the program which
can be accessed by using the on-screen menus or pressing <F1> at any
point.
The icon buttons below the
menu bar or the appropriate
row of the status grid can be
used as shortcuts to the data
input screens.
WaSim User Manual
2.
Main Screen
From the main screen all the screens within WaSim can be accessed. The
main screen has a number of features that are described below. The status
grid and toolbar can be switched on/off via the Options sub-menu.
2
17 August, 2001
Fig. 2 WaSim main screen
2.1
Menu / icons:
A menu is provided at the top of the screen that provides links to all the
input and output screens. The icons below the menu provide “shortcuts”
to the screens. By holding the mouse cursor over an icon, an appropriate
description (‘tooltip’) will appear.
Double-clicking the underlying bar can customise the toolbar itself, with
buttons added, removed or repositioned as required.
2.2
Status grid
The status grid details the current state of the input data. If the top left
cell, Input Data Status, is displayed in green a simulation can be
undertaken. Otherwise, some of the input data need to be completed.
Each line of the status grid details the record or file selected for each of
the required sets of input data. The dates of the simulation run, selected
under the initial run settings, are displayed alongside Run Parameters. If
data are missing or changes are required the corresponding line in the
status grid will be displayed in red
WaSim User Manual
3
17 August, 2001
The associated data input screen can be accessed directly by clicking the
appropriate row of the status grid.
2.3
Status bar
The status bar at the bottom of the screen provides “progress” information
during the importing/exporting of files, and when a simulation is
undertaken without a graphical display - see Section 6.
3.
User Levels/Access Permissions
WaSim can be set to operate at three levels, with each level allowing
permissions as detailed below. A password may be required if previously
specified.
Fig. 3 User level access descriptions
The password is stored in
the Windows Registry. If the
password is forgotten the
user level cannot be
changed.
3.1
Setting/clearing passwords
To set a password to prevent users from altering the user level, click Set
Password in the operations mode screen (accessed from the Options
menu item on the main screen). WaSim will request the new password
twice to ensure no typing errors have been included.
To clear the password click Clear Password from the operations mode
screen.
4.
WaSim Database
WaSim uses a database to store created soil, drainage, crop, and irrigation
records, along with allowing simulation run configurations, including the
initial run settings, to be saved and recalled at a later date for subsequent
simulations.
WaSim User Manual
4
17 August, 2001
The database has a simple structure as shown below:
The WaSim database also
enables model
configurations
(combinations of soil,
drainage, climate, irrigation
and initial run settings data)
to be saved and reloaded
when required.
Fig. 4 Schematic diagram of the WaSim database
4.1
Crop / irrigation relationship
Each irrigation record is related to a crop through the crop’s name. This
allows a number of different irrigation schedules to be created and saved
for each crop and selected as appropriate for different simulation runs. If a
crop record is deleted, all associated irrigation records are also removed
from the database.
WaSim User Manual
5
17 August, 2001
4.2
Record selection form
The record selection screen is used to define and select specific crop,
irrigation, drainage and soil records.
Fig. 5 Record selection screen
The record selection screen highlights the available records along with
some key information about each record. When the irrigation records are
displayed, only those irrigation schedules that have been defined for the
currently selected crop will be displayed.
4.3
Sorting available records
To sort the records, simply click the column heading of the field by which
you wish to sort the records. Records are sorted in ascending order.
4.4
Resizing columns
To enlarge (or reduce) column widths within the table, position the mouse
at the right-edge of the column header of the column to be widened and
click and drag the mouse horizontally to adjust the column to the required
width.
WaSim User Manual
6
17 August, 2001
4.5
Viewing and editing a record
Once a record has been selected, the data can be viewed/edited by
clicking the Edit key or double-clicking the record name itself. This will
lead to the appropriate data input form.
4.6
Define a new record
To define a new record, click Define New Record. The program will then
prompt you for a name for your record, which must be unique, 20
characters or less and not contain the apostrophe character. After entering
the name, the program will create the new record with default values and
display the appropriate data input screen.
Deleting a crop record will
also delete any associated
irrigation schedules defined
for that crop.
4.7
Deleting records
Records can be permanently deleted by firstly selecting the record to be
deleted from the record selection screen and clicking the Delete key.
There is no way of restoring any deleted records.
4.8
File operations
Simulation run configurations can be saved, loaded and deleted by using
the appropriate option on the File sub-menu on the main screen.
4.8.1 Save Input File
WaSim allows model configurations to be saved and reloaded at a later
date. At any stage during the setting-up of a simulation, the input status
can be saved, including references to any selected soil, drainage, crop and
irrigation records and climate files, along with any specified initial run
settings.
To save an input file, select Save Input Data from the File sub-menu.
The name for the input file will be requested, which must be unique and
less than 20 characters.
4.8.2 Load Input File
To reload a previously saved model configuration, select Load Input
Data from the File sub-menu. To load a file, click the file name in the
table displayed, or select the appropriate name from the drop-down list
box and click Load Data.
WaSim User Manual
7
17 August, 2001
4.8.3 Delete file
To delete input file stored in the database, select the record to be deleted
and click Delete.
4.8.4 Clear Input Data
To remove any selected records previously selected, click Clear Input
Data.
5.
Data Input
The required input data has been divided into 6 main areas, soil, drainage,
climate, crop, irrigation and initial run settings, each with their own data
input form.
5.1
Common features
The data input forms have common features, which are discussed below.
5.1.1 Comments
The Comments text box allows the user to include a description about the
record. This information is stored in the database but is not used by the
program. A description of up to 255 characters is allowed.
5.1.2 Last edited
The Last Edited date records the last time any changes were made to the
record (or when the record was created). This is only included for user
information.
5.1.3 Confirm
To confirm any changes made to the record click Confirm. This will
update the record within the database. Once completed, the original
details cannot be restored.
5.1.4 Cancel changes
To abort any changes to the record click Cancel Changes and the original
data will be maintained in the database.
WaSim User Manual
8
17 August, 2001
To prevent overwriting an
existing record a different
name/scenario will need to
be entered before clicking
Save As on the data input
screen.
5.1.5 Save as New record
To retain the original record and create a new record containing the new
details, click Save As New Record. The original data and the new data
will be recorded in the database as individual records.
5.1.6 Record/Scenario Name
The record (or scenario) name must be unique, less than 20 characters,
and must not include the apostrophe character. This is the field by which
the database organises and references each record.
5.2
Soil data entry form
5.2.1 Soil definition
The soil input form enables different soil types to be defined and saved
within the database. Guidance values for parameters can be obtained by
clicking Help Values from the Help Menu.
Note: multi-layered soils are not included within WaSim.
WaSim User Manual
9
17 August, 2001
Fig. 6 Soil data input form
5.2.2 Drainage constant, Tau,
The Drainage Constant, Tau, is used in the calculation of drainage when
the water fraction volume is between Field capacity and Saturation. For
further details refer to the Technical Manual (Section 6.1).
5.2.3 Curve number
The Curve Number is used in the calculation of surface run-off, and is
adjusted during the simulation to take into account the relative saturation
of the top layer of soil. The value entered is assumed to be the Curve
Number for average antecedent moisture conditions.
5.2.4 Soil guidance values
Clicking Help Values from the soil input screen will display the table of
help values shown below. These are for guidance only - refer to the
Technical Manual for more information.
Fig. 7 Soil guidance values
5.2.5 Typical hydraulic conductivity values
The table below lists typical values for hydraulic conductivity - for
guidance only.
WaSim User Manual
10
17 August, 2001
Fig. 8 Typical hydraulic conductivity values - source Smedema &
Rycroft, 1983
5.3
Drainage data entry form
Drainage data is only required if calculation of watertable position is to be
included in the simulation (refer to Section 6 for more details).
5.3.1 Drainage dimensions
The drainage diameter is
assumed to be the effective
diameter (including the
effects of envelopes etc).
To specify that a drainage system is present ensure that the "Drainage
system installed and operating" checkbox is checked. This activates the
horizontal scroll bars that enable the drain depth, spacing and diameter to
be specified. If this check box is not selected then the program assumes
that there is no drainage system present or that it has been permanently
closed.
The depth to the impermeable layer needs to be defined regardless of
whether a drainage system is specified.
WaSim User Manual
11
17 August, 2001
Fig. 9 Drainage data screen
The Tubewell Extraction is
assumed to be taken directly
from the groundwater zone,
with the salinity assumed to
be equal to the salinity of
the groundwater.
Canal Seepage is applied to
the groundwater zone below
the depth of any drainage
system present, with the
salinity assumed to be equal
to the salinity of the
irrigation water.
5.3.2 Tubewell extraction
If Tubewells are installed then a daily extraction rate, in mm/day, can be
specified by selecting the "Tubewell Extraction" checkbox and adjusting
the rate as required.
5.3.3 Canal seepage
If there is significant canal seepage present then this can be included by
selecting the "Canal Seepage" checkbox and specifying the seepage rate,
in mm/day, by adjusting the associated scroll bar.
5.4
Climate data import form
5.4.1 WaSim climate files (*.cld)
The climate data is stored
within climate files (*.cld)
and these can be saved for
future use.
Before a simulation can be undertaken the climate data needs to be loaded
into the program. WaSim uses specific WaSim climate files (*.cld) which
can be saved and recalled at a later date.
WaSim incorporates a Climate Import Utility which enables text-based
files (for example, with comma separated values) to be imported,
validated and converted to the WaSim format. To launch the Climate
Import Utility click Import from the File menu.
WaSim User Manual
12
17 August, 2001
To load an existing WaSim format climate file (*.cld) click Select New
Climate File.
Once loaded, the data can be displayed in a table and plotted by clicking
View Data and Plot respectively.
5.4.2 Climate file import utility
The Import Utility can convert text-based files, such as comma separated
values (*.csv) files into WaSim compatible climate files (*.cld).
WaSim requires both daily rainfall and reference evapotranspiration.
Other data are ignored, both within the simulation and during the
importing process.
Fig. 10 Climate import utility
WaSim User Manual
13
17 August, 2001
5.4.2.1
A maximum file length of 30
years can be imported. Any
files longer than this will be
terminated at this point, and
the data saved.
File details
Firstly, the import utility needs to be told the number of columns, the
column delimiter (for *.csv files this will be a comma) and the row at
which the data values themselves begin (not the column headers). Also
the number of columns used to define the date (ie either a single column
for the complete date or separate columns for day, month and year) also
needs to be specified.
The second box is used to inform the utility which columns contain the
required data, with the third box used to set allowable data limits. During
the importing process, rainfall and reference evapotranspiration data
exceeding these limits is highlighted.
5.4.2.2
If any problems are
encountered during this
process please ensure the
Import Settings are set
correctly.
The Importing process
The utility will highlight any errors or missing values within the data, and
if a number of errors are encountered, it will offer the option of aborting
the importing process. Missing values will be completed with ‘zero’
values, erroneous data will be highlighted and will need to be corrected
using the File Editor component of the utility.
5.4.3 Climate file editor
Once the importing process has been completed, the data will be
displayed within the File Editor within which any necessary editing can
be undertaken.
Any erroneous values (data exceeding limits) will need to be corrected
before the file can be exported as a WaSim climate file (*.cld) and used
within a simulation.
WaSim User Manual
14
17 August, 2001
Fig. 11 Climate file editor
5.4.3.1
Export as WaSim climate file
Once any errors have been resolved, click Export as WaSim Climate File
to make the data available for use within WaSim. Once this has been
completed, the climate data screen will be displayed and the data can be
viewed or plotted as necessary.
5.4.3.2
Erroneous/missing data
To the right of the table, the number of erroneous or missing values
(added by the utility) is highlighted. Any erroneous values encountered
during the importing process will be highlighted in red and any values
supplemented (missing data encountered) will be highlighted in blue. To
highlight each error in turn click the appropriate option (i.e. Find Next
Error >> will search forwards through the data from its current location
until it encounters the next erroneous value).
5.4.3.3
Editing
To begin editing the data, click Start Editing. Use the <DEL> key on the
keyboard to remove characters from a cell and <ESCAPE> to leave the
cell and restore the original value. Once the cell has been edited press
<RETURN> on the keyboard to finish the editing. Click Stop Editing
once all the changes necessary have been made. Corrected values will be
shown in green.
WaSim User Manual
15
17 August, 2001
5.4.3.4
Resolve all errors
To fix all the errors in one process click Resolve Error Values, and the
following options, highlighted in the picture below will be presented.
Select the appropriate options, and corresponding replacement values and
click OK.
Fig. 12 Resolving import file errors
5.4.4 View/plot climate data
To view a WaSim climate data click View Data or Plot on the climate
data screen to display a table and graph respectively.
WaSim User Manual
16
17 August, 2001
Fig. 13 Viewing imported climate data
WaSim User Manual
17
17 August, 2001
Fig. 14 Graph of imported climate data
WaSim User Manual
18
17 August, 2001
5.5
Crop data input form
Fig. 15 Crop data input form
5.5.1 Crop Development
The reduction from maturity
to harvest is to simulate
senescence.
The crop canopy development is assumed to follow the following stages:
The maximum cover must be
greater than 20%.
Typically, the maximum root
date corresponds with the
date of maximum cover.
Fig. 16 Crop Development
The root development is assumed to increase from the Planting Depth to
the Maximum Depth following a sinusoidal curve between the Planting
Date and the Maximum Root Date.
5.5.2 Plot crop development
During the selection of a Crop type, the canopy and root development can
be displayed by clicking Plot Crop Development.
WaSim User Manual
19
17 August, 2001
Fig. 17 A crop development plot
If crop 2 is removed and
crop 3 is activated, WaSim
will automatically update
crop 3 to crop 2, along with
any associated irrigation
record
5.5.3 Remove a crop from Model Set-up
At least one crop must be defined before a model run can be undertaken.
To remove any crops selected for crops 2 and 3 click Remove Crop. Any
associated irrigation schedule will also be removed.
5.5.4 Mulch Cover
The fraction of ground covered by mulch can be specified. The crop cover
is assumed to expand over the mulch.
5.5.5 Interception
Specifying an adjustment for interception enables losses from rainfall due
to canopy interception to be included, and the effective rainfall (that
which enters the soil) to be calculated (refer to Section 4.2, Technical
Manual for more information). For example if it is to be assumed that the
first 5 mm of any daily rainfall and 10% of subsequent rainfall is lost to
interception then parameters a and b would be set to .9 and 5 respectively.
WaSim User Manual
20
17 August, 2001
Interception losses to irrigation (in the case of sprinkler irrigation, for
example) can be included with the formula defined within the irrigation
screen (Section 5.6) used to calculate the effective irrigation application.
5.5.6 Tolerance to salinity
During a simulation the display will indicate days when the root zone
salinity exceeds the salinity threshold of the current crop. Any values
exceeding this threshold value are also highlighted within the results table
(refer to Section 6).
5.5.7 Ponding
During a simulation a maximum ponding depth and a corresponding crop
coefficient during ponding can be specified. If the crop transpiration is
reduced during waterlogging then the Reduce ET due to Excess Water
option box should be checked.
5.6
Irrigation data input form
The irrigation input screen enables irrigation schedules to be prepared.
The top half of the screen (see Figure 18) has tabs that provide
information about the crop, pre-irrigation, rainfall, salinity and controlled
drainage.
The bottom half of the screen provides two procedures for defining of
irrigation schedules, the Rule-Based Scheduling method and the GridBased Scheduling method.
WaSim User Manual
21
17 August, 2001
Fig. 18 Rule-Based irrigation scheduling method
5.6.1 Crop data
A summary of the crop is displayed on the front tab of the top section of
the screen.
5.6.2 Pre-Irrigation
Pre-irrigation can be defined on the second tab on the top section, and can
be applied up to 30 days before planting. Three different options for
calculating the amount to apply are available:
1. Fixed Amount
2. Fixed Wetting Depth
3. Target Salinity
The objective of the third option, Target Salinity, is to apply enough
irrigation to bring the salinity back to the specified target value.
5.6.3 Rainfall / interception
The third tab enables Irrigation to be aborted if the rainfall exceeds a
specified amount over a defined period. For example, irrigation could be
suspended if the rainfall over the previous five days exceeds 50 mm. This
tab also enables losses due to canopy interception (appropriate to
sprinkler irrigation) to be included.
WaSim User Manual
22
17 August, 2001
5.6.4 Water salinity and flow rate
The next tab enables the salinity of the irrigation water to be defined
and, if Rule-based scheduling is adopted, enables an additional leaching
requirement to be specified when a threshold salinity is reached. In this
case, three options to increase the amount of irrigation for leaching
purposes are available:
1. Increase by a fixed amount
2. Increase by a fixed percentage
3. Target Salinity
The objective of the third option, Target Salinity, is to apply enough
irrigation to bring the salinity back to the specified target value.
If there is a limited water supply, the maximum flow rate can be fixed.
This will limit any planned irrigation events that would exceed this rate.
5.6.5 Controlled drainage
The final tab allows simple controlled drainage options to be included.
This option can be used if drainage has been installed and the drains are
to be closed for a period during the crop season to maximise the
contribution from groundwater.
5.6.6 Irrigation scheduling
Two procedures are available for defining irrigation schedules; RuleBased Scheduling or Grid-Based Scheduling.
5.6.7 Rule-Based irrigation scheduling
The start date of each
Irrigation Scheduling
Period is assumed to be the
date at which the previous
period is finished. In the
case of the first period the
start date is assumed to be
the Crop Planting Date.
Rule-Based scheduling (Figure 18) enables up to twelve combinations of
frequencies and amounts of irrigation between selected dates. If any
timing rule other than No Irrigation is selected then the amount rule
options will become enabled.
Timing
Example
Fixed Interval
Every 10 days
Fixed Deficit (mm)
Irrigate at 50 mm Deficit
Fixed Depletion (%)
Irrigate at 50% TAM* Depletion
No Irrigation
No Irrigation
Irrigate at Deficit Below Saturation
Irrigate at 50 mm Deficit below Saturation
Irrigate at Fixed Ponding Depth
Irrigate at 10mm Ponding Depth
*TAM = Total Available Moisture in Rootzone
WaSim User Manual
23
17 August, 2001
Fig. 19 Timing rules
Amount
Example
Fixed Amount
100mm
Return to Fixed Deficit (mm)
Return to 0mm Deficit
Return to Fixed Depletion (%)
Return to 0% Depletion
Return to Fixed Saturation Deficit
Return to 50 mm Saturation Deficit
Return to Fixed Ponding Depth
Return to 30 mm Ponding Depth
Fig. 20 Amount rules
5.6.7.1
Finish date
To complete an irrigation schedule period, the finish date needs to be
specified. This date will also be used as the start date for the next period.
The range of period start dates available is between the finish date of the
previous period and the crop harvest date.
Scheduling periods can be added and removed by clicking the Remove
Period button and all periods can be cleared by clicking Clear All
Schedules. Additional periods are positioned at the end of the sequence,
and if a period is removed all subsequent periods are updated accordingly.
Once removed, the details of
the deleted period cannot be
recovered.
To restore the irrigation record to the condition it was in before any
changes were made, click Cancel Changes.
5.6.8 Grid Based irrigation scheduling
Grid based scheduling enables specific irrigation quantities to be applied
on specific dates during the crop season. At the far right of the grid the
total amount applied during the season is displayed.
Fig. 21 Grid-Based irrigation scheduling method
WaSim User Manual
24
17 August, 2001
5.6.8.1
Editing the grid
Any irrigation events specified within the grid can be manually edited by
clicking the appropriate cell. Use the <DEL> key on the keyboard to
remove characters from a cell and <ESCAPE> to leave the cell and
restore the original value. Once the cell has been edited press
<RETURN> on the keyboard to finish the editing.
5.6.8.2
Add irrigation
To add an irrigation event adjust the Day of Application value to the
appropriate day and click Add Irrigation. An irrigation event will be
added to the grid and both the day and amount can be subsequently
edited.
5.6.8.3
Remove Irrigation
To remove an irrigation event (or a range of irrigation events) highlight
the irrigation(s) to be removed and click Remove Irrigation. Once
completed there is no way to restore the applications.
To restore the irrigation record itself to the condition it was in before any
changes were made, click Cancel Changes.
5.6.8.4
Clear all irrigation events
To remove all the irrigation events specified in the grid click Clear All
Irrigations. There is no procedure for restoring these applications once
they have been removed.
5.6.8.5
Define schedule (complete grid)
To complete the grid with a “Fixed Frequency-Fixed Amount” schedule
click Complete Grid. This will display the Define Schedule screen, which
will allow a frequency and associated fixed amount to be defined. The
grid will then be filled with irrigation events derived from this schedule.
5.6.8.6
Plot cumulative irrigation
To plot the cumulative amount of irrigation applied through the season
(including any pre-irrigation) click Plot at the top left of the grid.
WaSim User Manual
25
17 August, 2001
Fig. 22 Plot of cumulative irrigation
5.6.9 Irrigation Dates Conflict
If Irrigation Dates Conflict is indicated in the status grid (or detailed in a
message box) after editing of a crop or irrigation record then there is a
conflict between the specified crop and irrigation data.
This can occur when a new crop type is specified along with an irrigation
plan. If the crop record is subsequently altered so that an irrigation event
falls outside the crop season a conflict is created.
The error can be resolved by returning to either the crop or irrigation data
screens and amending the record. On returning to the irrigation form
WaSim can automatically remove any irrigation applications that fall
outside the crop season.
5.7
Initial run settings
Once all the necessary input data (soil, drainage, climate, crop, and
irrigation) have been specified, the initial run settings need to be
specified. These include the start and finish dates of the simulation, the
initial water moisture content and water table depth, and the initial
salinity levels. Once these have been specified click OK. A simulation can
now be undertaken.
WaSim User Manual
26
17 August, 2001
Fig. 23 Specifying the initial settings
5.7.1 Dates
The start and finish dates of the simulation run need to be within the date
range of the climate data. The date at which annual summary results are
calculated can be altered if necessary.
5.7.2 Water content
The initial moisture content can be specified by either setting all
unsaturated compartments to Field Capacity, or by specifying a water
content for each of the unsaturated layers individually by clicking Define
Profiles. If this option is selected, salt concentrations for each of the
compartments can also be defined.
5.7.3 Salinity
If the initial moisture content of the unsaturated zones has been set at
Field Capacity, the initial salinity in the root-zone, the saturated zone and
the groundwater can be defined on the third tab. Otherwise, the inital salt
concentrations should be entered by clicking Define Profiles on the
second tab.
WaSim User Manual
27
17 August, 2001
6.
Simulation
6.1
Analysis options
WaSim can be configured to operate in a variety of different ways, with
watertable, salinity and irrigation analyses optional. Also, with the
watertable analysis option selected, WaSim can be run with or without a
drainage system included. By switching all these options off, WaSim can
be used as a simple unsaturated zone water balance model for calculation
of potential recharge to a groundwater system.
WaSim can be used with or
without the watertable,
irrigation and salinity
options activated
To change which analysis options are selected, click Operation Mode from
the menu on the main screen. - a password may be required if previously
specified.
Fig. 24 Selecting the analysis options
When loading a results file, only those results with the same analysis
option settings as currently selected can be loaded. WaSim will provide a
warning and prevent a file with different analysis configurations from
being loaded.
If a daily results record table is required, the Daily Results available on
loading of results files option should be checked. If this option is left
WaSim User Manual
28
17 August, 2001
unchecked, daily results can still be reviewed through the plotting
facilities, or the daily results can be exported as a text file.
6.2
Running a simulation
WaSim enables a simulation run to be displayed in three different modes:
Simulations can be
undertaken without using
the display screen to speed
up calculation
1) full display (Figure 25) with both a graphical representation and
tabulation of daily results;
2) graphical display only (no tabulation);
3) with no display, (as a batch run). A progress bar on the main
screen indicates the percentage of the simulation run that has been
completed.
Fig. 25 A simulation using the full display - option (1)
These options allow a ‘trade-off’ between the level of detail/information
displayed and performance speed during a simulation, although the
algorithm used to calculate the results is the same in each case. If a
graphical display is selected (options 1 and 2), the calculation speed can
be adjusted as required on the display screen. To change the display
option, click Operation Mode from the Options sub-menu of the main
screen.
WaSim User Manual
29
17 August, 2001
6.2.1 Starting a simulation
Once all the data have been input a simulation can be undertaken. To start
a simulation run, click Analysis >> Run from the menu on the main
screen. Alternatively, click the appropriate icon on the toolbar.
6.2.2 Control - starting/pausing/aborting simulations (Display
Options 1 and 2)
Simulations can be paused
or aborted at anytime, with
the results analysed up to
that point
To start the simulation, click the Play button on the display screen. At any
time during the simulation, the analysis can be paused or aborted by
clicking the Pause or Stop buttons. There is also a speed control provided,
and this can be altered at any time to adjust the calculation speed.
6.2.3 Visual display and legend (display options 1 and 2)
The main visual display to the left of the screen highlights the key results.
The light-grey background provides a depth-axis (in metres) and provides
a visual summary of the drainage system.
6.2.3.1
Mositure and salinity profiles
The left-hand column (blue to white in colour) relates the moisture
contents of the different soil profile zones (averaged over each zone) to
the soil moisture holding properties (saturation, field capacity and
permanent wilting point).
The right-hand column (red to white in colour) indicates the average salt
concentrations (electrical conductivity of the saturation extract) in each
zone.
6.2.3.1.1
The darker the blue, the
wetter the soil. The darker
the red, the higher the
salinity. Crop stress will be
indicated by a yellowing of
the crop cover.
WaSim User Manual
Crop development and crop stress
Above both columns, an indication of the crop cover development is
provided. An an indication of the root development is also shown using a
hatched area below the soil surface. During the season, the colour of the
crop cover above either column may change to indicate potential moisture
or salinity stress. These details are summarised in the associated legend.
30
17 August, 2001
Fig. 26 Interpreting different crop cover colours
6.2.3.2
Soil profile/watertable
The extent of the soil profile is represented by horizontal brown lines,
with the water table indicated by a horizontal blue line across both
columns.
6.2.4 Timescale (Display Options 1 and 2)
The timescale details the start and finish dates of the simulation and the
current date of the simulation.
6.2.5 Results table (Display Option 1 only):
Right-clicking a row in the
results table produces a
graph of that row of results
The results table displays a user-selected range of daily results, with the
latest date shown at the far right of the grid. To view earlier results, Pause
the simulation and use the scroll bar at the bottom of the table to move to
the requried date.
To change which results are displayed, Pause the simulation and then
select/de-select the appropriate option from the View Results sub-menu.
6.2.6 Plot Results to date (Display Options 1 and 2):
Whilst the simulation is paused, any of the calculated results can be
plotted up to the current date of the simulation by right-clicking the
appropriate row of the results table. This can also be done, by ensuring
the currently selected cell within the grid is in the row to be plotted and
clicking Plot Results from the menu.
WaSim User Manual
31
17 August, 2001
6.2.7 View Input Data (Display Options 1 and 2):
To view the soil, drainage, crop or irrigation input data, Pause the
simulation, and then select the appropriate option from the View Input
Data section of the menu.
6.2.8 Saving and reloading of results:
Once a simulation has been completed, the option to save the results will
be presented - note the results are not automatically saved or stored in
memory after a simulation has been run.
To review the results they will need to be saved and then loaded into
memory. To load a results file, select Load Results File from the Results
menu on the main screen, and use the file browser to locate the file. Once
loaded, the results can be displayed in tables (including summary results)
or plotted as required. Up to 5 sets of results can be stored in memory at
any time to enable results of different simulations to be compared.
WaSim User Manual
32
17 August, 2001
7.
Results Visualisation
7.1
Overview
WaSim incorporates an extensive results visualisation engine to enable
the output from simulations to be displayed, evaluated and compared. The
results from up to 5 simulations can be loaded into memory at any one
time. The results can be displayed in tables, plotted in charts and
summarised (by month, year or season) as required.
The results that can be displayed are shown below:
Fig. 27 Summary of results calculated
The results can be presented in the following tables:
WaSim User Manual
•
Daily Values (all results) between user-selected dates
•
Daily Cumulative Values (where appropriate) between user
selected dates
•
Maximum, Minimum, Average and Total values (where
appropriate) between user-selected dates
33
17 August, 2001
•
Monthly, Annual, and Seasonal Summaries over the time-period
of the simulation
In each case, a combination of output parameters can be plotted on a
chart, with up to 5 result files displayed at any one time. This enables
different strategies and scenarios to be readily compared. Previously
saved simulation results can be reloaded at a later date for comparison.
The results can also be exported as comma separated values (*.csv files)
to allow further manipulation and analysis within an external spreadsheet
package or text editor.
7.2
Daily/Cumulative Results table
The calculated daily results can be viewed by clicking Results >> View
Results (or the appropriate icon on the toolbar) from the main screen. A
list of currently loaded results will be displayed and the appropriate
results file can be selected by clicking the appropriate row of the table and
clicking the View button.
Fig. 28 Results files currently in memory
The title box above the results table (see Figure 29) displays the
simulation file name and the range of dates currently on display.
WaSim User Manual
34
17 August, 2001
Fig. 29 Results table
Other results files that are currently loaded into memory can also be
displayed by returning to the results files list (Figure 28) and reselecting
another file to display.
7.2.1 Change displayed Result Columns/Hide Column
The user can toggle which results to display within the table. For example
to toggle between hiding and showing the Irrigation column, click View
Complete Results File >> Irrigation from the menu. Alternatively, to
hide a column, highlight the column(s) to be hidden, right-click the mouse
button and select Hide Column from the pop-up menu that appears. To
redisplay the column, click View Complete Results File >> Irrigation
from the menu.
7.2.2 Change Date Range
To change the dates between which the results are displayed, click
Start/Finish Dates >> Change Date Range from the menu and the screen
will display the change dates screen. Once the dates have been changed,
click OK and WaSim will update the table. To view the complete results
file, click Start/Finish Dates >> Select All Results from the menu.
WaSim User Manual
35
17 August, 2001
7.2.3 View Summary Data
To view a summary (maximum, minimum, average and, where
appropriate, total) of the currently displayed results, click Summary Data
>> View Summary Data (Selected Results). To view a summary of the
whole simulation click Summary Data >> View Summary Data (All
Results).
Fig. 30 Summary of daily results
7.2.4 Cumulative Results
To view cumulative daily results rather than actual daily values, click
Cumulative Results >> View Cumulative Results from the menu. To
return to daily values click Daily Values >> View Daily Results.
7.2.5 Plot Column
To plot a column of results, right-click the appropriate column and select
Plot Column from the pop-up menu displayed. Once plotted, the same
parameter for any other loaded results file can also be displayed using the
menu provided within the plot screen.
WaSim User Manual
36
17 August, 2001
7.3
Seasonal/Annual/Monthly Summaries
WaSim enables the calculated results to be summarised either by crop
season, by year and by month. To view the results in this form, click
Results >> View Summary Results (or the appropriate icon on the
toolbar) from the menu of the main screen. A list of loaded results files
(Figure 27) will be displayed and the appropriate results file can be
selected by clicking the appropriate row of the table and clicking the
appropriate summary (annual/monthly/seasonal) button from those
available.
Fig. 31 Seasonal Summary
To access plotting and, in the case of Seasonal Summaries, further
summary data, right-click a cell to display the following options, where
appropriate:
7.3.1 Plot Series
The results within any column can be plotted as a series, with the option
of including any other results currently loaded into memory that have the
same start and finish dates.
7.3.2 Plot Season/Year/Month
The actual change in a parameter through the course of the summarised
season/year/month can be plotted, with the option of including any other
WaSim User Manual
37
17 August, 2001
results currently loaded into memory that have the same start and finish
dates.
7.3.3 View Further Summary Information
Within Seasonal summaries, further information can be obtained by
accessing the Further Summary Info option from the pop-up menu.
Fig. 32 Detailed seasonal summary info
This additional summary information details the watertable depth at
planting and harvest, along with the date and depth of the shallowest
water table depth recorded during the season. Also, the rootzone salinity
at planting and harvest, along with the date and value of the maximum
salinity during the season, is presented.
7.3.4 Relative transpiration (yield indicator)
Within the summary screens, a summary for the seasonal crop
transpiration is calculated, and provides an indication of the magnitude of
any moisture and salinity stresses present during the season. This
information provides an indication of potential effects on crop yield.
7.3.5 Cumulative irrigation
The cumulative irrigation values recorded within seasonal summaries do
NOT include any pre-irrigation applied prior to planting of the crop.
7.4
Export Results As CSV
To export a set of results currently loaded into memory click Results >>
Export Results As CSV File (or the appropriate icon on the toolbar) from
WaSim User Manual
38
17 August, 2001
the main screen. A list of currently loaded result files will be displayed
and the appropriate results file can be selected by clicking the appropriate
row of the table and clicking the Export Results button. The results will
be exported as a comma separated values (*.csv) file which can be
imported into any spreadsheet or text editor.
The exported results also contain information regarding the input data and
the initial starting conditions specified for the simulation.
7.5
Plotting results
WaSim incorporates comprehensive charting capability, enabling the user
to produce a variety of user-defined charts. The user can select any of the
calculated results displayed in the result tables, and plot up to three series
at once from up to 5 sets of results. The user can also plot maximum,
minimum, average and total values for each result (where meaningful)
and also plot cumulative results. All of these charts can be plotted over a
user-defined range of dates.
Fig. 33 Example plot
WaSim enables the charts to be “cut-and-paste” into a word-processing
package (for inclusion in a report) or plotted to a printer. Direct “cut-andpaste” of the underlying data to a spreadsheet package for further
manipulation and analysis is also possible. The individual chart elements
can be repositioned/resized as required.
WaSim User Manual
39
17 August, 2001
The type of chart to be displayed is determined by the setting of the
various options displayed below:
Fig. 34 Defining a plot
7.5.1 Selection of result files to be plotted
WaSim enables up to 5 sets of results to be stored in memory
simultaneously, and any combination of these can be included within a
chart. To select/deselect a results file from the plot, click the plot/no plot
button to the left of the name of the result file. WaSim will not allow a
chart to be produced unless at least one set of results has been selected.
7.5.2 Date Range
To adjust the dates, between which the chart will be plotted, click Change
Date Range. This will display the change dates screen and enable the
dates to be changed as required.
7.5.3 Interval
WaSim allows simulation runs of up to 30 years in duration, and given
that up to 30 results are calculated and stored each day, the number of
points to be plotted can become extremely large. On some computers, this
may result in a short delay before a chart is produced, and therefore
WaSim allows aggregation of data on a monthly basis to reduce the
number of points to be plotted. If the difference between start and finish
dates is greater than 1 year, WaSim defaults to aggregating the data on a
monthly basis before plotting, although the user can override this by use
of the drop-down list box.
WaSim User Manual
40
17 August, 2001
This option is only applicable when daily or cumulative values are to be
plotted.
7.5.4 X-axis series
By default, WaSim assumes the x-axis data series will be the date.
However, this can be changed so that charts with the name of the
simulation run on the x-axis, or a scale based on a drainage parameter
(size, spacing or depth) can be produced. Up to 2 result files need to be
selected to produce the latter chart.
7.5.5 Y-axis series
The results available for plotting on the y-axis depend on the option
selected for the x-axis of the graph.
7.5.5.1
Daily and cumulative results
With the date selected as the x-axis series, either daily or cumulative
values can be plotted.
Fig 35(a). Selection of results to be plotted
The choice between actual daily values and cumulative values can be
made by use of the appropriate option buttons. To select a series to plot,
click the arrow at the right of the appropriate dropdown list box. To clear
a selection, simply click the appropriate Remove button.
The choice of available series for the third dropdown list box is dependent
upon the choices made in the first two. Only those series that can be
plotted on the same y-axis scale as one of the previously selected series
can be viewed.
7.5.5.2
WaSim User Manual
Y-axis series - maximum/minimum/average/total results
41
17 August, 2001
With the x-axis series not set for dates, maximum, minimum, average and
total (where appropriate) values can be plotted.
Fig 35(b). Selection of results to be plotted
The choice between maximum, minimum, average or total values can be
made by clicking the appropriate button until the caption displays the
required choice. To select a series to plot, click the small arrow at the
right of the appropriate dropdown list box. To clear a selection, simply
click the appropriate Remove button.
The choice of available series for the third dropdown list box is dependent
upon the choices made in the first two. Only those series that can be
plotted on the same y-axis scale as one of the other two series cwn be
viewed.
7.5.6 Plotting chart
Once all the above selections have been made, click the Plot button.
7.5.7 In-chart options
Once a chart has been displayed (see examples below) there are a number
of features available to the user as described below:
WaSim User Manual
•
Pressing <CTRL + C> on the keyboard copies both the chart and its
underlying data to the clipboard. Either of these can then be pasted
into a word processor or spreadsheet package
•
Clicking a point on a chart and holding the mouse cursor over this
point will display the value at that point
•
Once a point has been selected (see above) the currently selected point
can be changed as follows:
•
<F12> - move forwards one point
•
<F11> - move back one point
42
17 August, 2001
•
<F9> - move up one series
•
<F8> - move down one series
•
Any of the chart elements can be repositioned or resized by using
standard “drag-and-drop” methods (select the element to be
repositioned/resized and hold-down the left-mouse button and
drag/resize the element as required)
•
Clicking the Print button will output the chart to a printer, if one is
connected.
8.
Technical Issues
8.1
WaSim Specification
WaSim can be supplied on either CD-ROM (recommended) or Floppy
Disk.
Minimum Hardware Specification
•
A 486 Processor
•
8 Megabytes of RAM
•
SVGA Monitor - set at a minimum resolution of 800 x 600
Recommended Hardware Specification
•
Pentium Processor
•
16 Megabytes of RAM
•
SVGA Monitor - set at 1024 x 768 resolution, and High Colour (16
bit)
Software Requirements
•
WaSim User Manual
Windows 95/98/NT, or later, operating system
43
17 August, 2001
8.2
Year 2000 Compliance
This topic describes how WaSim conforms to the requirements for Year
2000 conformity as specified in BSI DISC PD2000-1:1998.
General: WaSim uses the Gregorian Calendar and is applicable for dates
after 1 January 1900.
Rule 1. General integrity. WaSim will successfully cope with roll-over
of dates.
Rule 2. Date integrity. WaSim will correctly calculate, manipulate and
represent dates for the purpose for which it is intended.
Rule 3. Explicit / implicit century. Where the original data file contains
explicit representation of the year (i.e. four-digits), this is used in WaSim.
If the original data file contains two-digit years, then a value greater than
50 implies 19xx (twentieth century) and a value equal to or less than 50
implies 20xx (twenty first century).
Rule 4. Leap years. WaSim successfully identifies leap years (as defined
by ISO 8601:1998) and correctly identifies 2000 as a leap year.
Acknowledgements
The assistance of Dr MN Bhutta, Director, and his staff at the
International Waterlogging and Research Institute in Lahore, is gratefully
acknowledged. Particularly valuable were a series of working meetings
arranged by IWASRI with organisations in Pakistan involved in
agricultural drainage. The hands-on sessions provided invaluable
feedback to the program designers. Thanks is extended to those other
organisations concerned: to Professor M Latif (Director), Dr A Tariq,
and staff at the Centre for Excellence in Water Resources Engineering,
Lahore; staff of the National Drainage Programme, Lahore; Dr SA
Prathapar (Director) and staff at IWMI; Dr R Choudrhy (Chairman
DWM) and staff at Faisalabad University; Dr M J Khan (Chairman
DWM) and staff at NWFP Agricultural University, Peshawar; staff of
Pakistan Drainage Consultants, Peshawar.
The support and encouragement of DFID throughout the project period is
also acknowledged with thanks.
WaSim User Manual
44
17 August, 2001