1
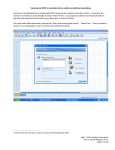
Software to digitize electrocardiograms
and quantify heart rate variability in
humans
Andrés Machado García
Mario Estévez Báez
Abstract
A computer program for acquiring the ECG signal, discriminating the R-wave peaks and
measuring automatically the RR intervals for quantifying heart rate variability (HRV) is
presented. The software uses sound cards included in most of the current personal
computers to digitize the ECG signal. Starting from the RR intervals, obtained by this
method or imported from ASCII data files, the software calculates the main measures, in
both the time and frequency domain, frequently used for HRV studies. These indexes can
be exported to comma separated values file format to introduce them in many of the
existing professional software used for data processing. The program includes a filtering
option that automatically detects, removes or corrects wrong RR interval values
according to an algorithm previously published.
Keywords Heart rate variability; Computer programs; Signal analysis
Introduction
Heart rate variability (HRV) in humans has been recognized as an index to study several
pathologic conditions of the cardiovascular and nervous systems. It has also been used to
evaluate the magnitude of mental effort and stress, to assess the state of fetuses and
comatose patients, and to study heart rate fluctuations in psychophysiologic
investigations, as well as to evaluate quantitatively the activity of the autonomous
nervous system [1, 2].
Most of the commercial software developed for the study of HRV are very expensive and
depend on the existence of a specific hardware installed in the PC, thus rendering them
non-portable. On the other hand, the good known free software, such as [3], depend on
the previous installation of a professional , etc) or, at least, on the installation of the®,
LabView®platform (MatLab corresponding function libraries, thus this type of software
consumes much memory, internal of external. These free software also require additional
equipment for recording the electrocardiographic (ECG) signals, discriminating the peaks
of consecutive R waves and measuring the corresponding beat-to-beat intervals, since
they process the list of successive RR intervals.
Our aim has been to develop a small stand-alone software (VFC32) that can be used in
most of the current personal computers without the need of installing special hardware
neither other software components. This is a self-contained software for doing HRV
studies since it allows to digitize ECG signals, discriminate the R-wave peaks, measure
automatically the RR intervals and process their values with both time and frequency
domain analyses. Another of its advantages is its portability, because it can be used in
almost any PC with a commercial sound card.
Background
Our research group has developed software for studying different biological phenomena
that can be considered as point processes. We have designed a package of hierarchies of
object oriented classes, named PointProcess, to represent the mathematical tools used in
the quantification of point processes. Starting from this package we developed software
to quantify spike unitary neuronal activity, both spontaneous and under stimulation, and a
system for HRV analysis initially programmed over the MS operating system.®-DOS
This was our first version of a program for HRV analysis that receives through the
parallel port of a personal computer TTL pulses corresponding to each heart beat.
Starting from this signal, the software calculates the RR intervals (described in [4]) and
allows to apply different methods to quantify the HRV. This software requires external
equipment for detecting the R-wave peak and converting it to a TTL pulse. To avoid
these inconveniences, and to be able to operating system, we developed the software
VFC32.®use Microsoft Windows
Design considerations
VFC32 is a software developed on Borland Delphi 6.0 which allows the calculation of a
series of indexes commonly used to study HRV in humans using the nomenclature and
the definitions settled down in [1]. These time and frequency domain indexes are
calculated from the values of the beat-to-beat intervals. Previous installation of any
libraries of functions is not necessary; all its functionality is included in an executable of
333 KB. Optionally a help file and a user’s manual can be installed.
All the algorithms included in VFC32 have been optimized in such way that their
efficiency will be appropriate. Special emphasis was made in the study of the complexity
of the methods used in the spectral analysis, as well as in those related with the
construction of the interval histogram.
For the estimation of the RR interval power spectral density a non parametric method
based on the fast Fourier transform (O(n log n)), well-known as Welch’s periodogram
[5], was used. On the other hand, the algorithm Bin Sort (O(n)) is used to sort the
intervals and for the calculation of the frequency distribution in order to estimate the
probability density function of the intervals by means of its histogram.
System Description
This program allows the user to compare visually results of different HRV indexes from
two or more recordings. The user also has the possibility to simulate experiments of the
type “what happens if…?”, since one can modify the initial data and directly observe the
changes evoked in the HRV indexes.
VFC32 includes a special module for direct data acquisition, which allows digitizing an
ECG signal by using conventional audio cards present in most PC nowadays. Using lowlevel Waveform Audio Input and Output functions [6], the [7], the program
automatically®most utilized multimedia feature of Windows detects the configuration of
the audio card or cards of the PC that will be used for digitizing on-line the ECG
recordings. It will properly setup the parameters of the audio card for digitizing the
analog output signal from conventional electrocardiographic equipment. After the ECG
recording is digitized, the user may discriminate by amplitude the R waves and the
program will automatically measure the consecutive RR intervals, the values of which
may be stored in a file.
The values of the RR intervals may be processed using 3 different types of statistical and
graphical procedures: non-sequential, sequential and spectral analyses. VFC32 has a data
editor by which the user may make changes to the files with the RR-interval values, and
that includes the Cut and Paste . The program also offers the possibility of
“filtering”®operations of Windows the RR intervals to detect, remove or correct wrong
data values (described in [8]). The user observes the changes evoked by this filtering
procedure in the HRV indexes instantaneously.
Validation of the method to digitize the ECG signal and measure the RR
intervals
The Analog-to-Digital converters used to digitize the ECG must have a sampling
frequency between 250Hz and 500Hz [1] ( although some Holters system use 128Hz) and
a bandwidth of 0.5Hz-100Hz is accepted as valid, although it is recommended to be of
0.05Hz-100Hz [9].
The sound cards are Analog-to-Digital converters of specific purpose designed to digitize
signs with frequencies inside the range of audible frequencies. They usually have
sampling frequencies starting from 4KHz and bandwidth of 30Hz-100KHz, although the
best ones have a bandwidth of 10Hz-100KHz.
For HRV analysis it is necessary to calculate with the highest possible precision and
accuracy the RR intervals but it is not indispensable to record faithfully the low
frequencies of the QRS complex. The deformations that occur digitizing the ECG by
means of a sound card, with a minimum cut off frequency higher than that recommended
by the ECG norm [9], does not avoid detecting faithfully the fiducial point of the R wave,
therefore calculating the RR intervals with an error smaller than 1 ms when digitizing the
ECG with a sampling frequency of 4KHz, which is the minimum possible with sound
cards.
To validate the methods of acquiring an ECG signal and of measuring the RR intervals
implemented in the VFC32 software, comparisons of ECG recordings and of RR interval
values were done using simultaneously our system and either of two methods previously
validated in the literature.
A group of researchers headed by MD Eduardo Migliaro carried out 7 ECG recordings
from different subjects using a Fukuda FJC-7110 electrocardiograph whose analogical
output was digitized in parallel by two personal computers. In one PC the digitalization
was made through an acquisition card DAQ 1200 (National Instrument Company) using
the software Axotape. Out of line another software (programmed in MatLab®) was used
to calculate the RR intervals (procedure described in [4]). In the other computer the
system VFC32 was used to digitize the ECG signal introduced through the line-in plug of
a sound card and to measure the RR intervals.
A similar test with ECG recordings from 10 different subjects was carried out at the
Department of Electromechanical Instrumentation of the National Institute of Cardiology
“Ignacio Chávez”, Mexico City. In this case the comparison was made using a device
developed at this department (described in [10]).
In each one of these tests, two lists of RR intervals were obtained from each of the ECG
recordings digitized in parallel and processed by different software to measure the beatto-beat intervals. The difference and its quadratic error (in %) for corresponding intervals
were calculated (Fig. 1). The mean (SD) of these comparison were 0.66 (0.35) %, with a
range from 0.20 to 1.35%. The number of RR intervals measured in each subject varied
between 321 and 797. The result of these comparisons indicates that the RR intervals
obtained by these different methods are equivalent.
The user's interface
This software has a main menu by which the user may access the different options
offered: Data, Windows and Help. In the Data menu one can open a previously saved
ASCII file with a sequence of RR intervals, or acquire an ECG signal through the line-in
plug of an audio card of the PC to digitize it and measure the RR intervals.
When a user chooses a file with RR-intervals, a so-called Tachogram (RR values vs.
Interval number, Fig. 2) is shown in the software’s main panel. Then, in the Data menu
the Filter, Editor and Export HRV Results options are shown. Also the options for
obtaining the time and frequency domain indexes of heart rate variability are activated
(Fig 2).
The Filter option allows to automatically detect, remove or correct wrong RR-interval
values according to the algorithm explained in [8]; the Editor allows the user to check
visually all the RR-interval values of the file, and to make changes manually. This option
includes the Cut and Paste . On the other hand, the Export HRV Results
allows®operations of Windows exporting all the numeric results calculated by VFC32 to
a file with comma separated values format (.csv).
Acquire an ECG option
This option allows to digitize the output analog signal of any ECG amplifier that is
introduced through the line-in plug of a commercially available and conventional audio
card of the PC been used. An ECG recording digitized using VFC32 and the audio card
Sound Blaster PCI 128 is shown in Fig. 3.
When the Acquire an ECG option is selected, a window showing a tool bar with several
buttons will appear (Fig. 3). These buttons allows selecting the sound card settings (Fig.
4), to digitize an ECG, to save or open the signal in an .ecg file (a proprietary format).
They also allow editing and measuring on the digitized ECG recording, select parts of the
recording to be saved independently, export the digitized signal to files with ASCII
formal, and to measure the RR intervals and save them in ASCII file format. The
procedure to digitize an ECG signal is fully described in the user’s manual and the Help
of the program.
In the VFC32 last functional version, the discrimination procedure of the R wave and the
measurement of the RR-intervals are done automatically by amplitude discrimination.
For this, the user must displace horizontally an amplitude discrimination level to be sure
that all the peaks of the R waves in the ECG recording are above this level. Afterwards,
the system automatically calculates the RR-interval between the successive peaks
detected and shows them numbered sequentially in a window. These values may then be
saved.
During the discrimination procedure the program uses the value set by the user in the
“Refractory Time” window (Fig. 4). This so-called “Refractory Time” is the time during
which the software will not recognize as valid a second peak in the recording after having
detected a previous one. This procedure eliminates some ectopic beats.
Non-sequential Menu
By this option of the main menu it is possible to quantify the HRV through the
Probability Density Function of the RR-interval series, which is estimated by the Interval
Histogram of the beat-to-beat measurements [11]. The Non-sequential analysis includes
the following options:
•
•
•
•
•
Intervals: Shows a table with the values of the frequency distribution of the RRinterval values. Each of the interval classes present in the series, its frequency and
corresponding probability are shown in this table.
Statistics: Shows central tendency and dispersion statistical indexes, together
with other values of the RR-interval data distribution.
Time Interval Histogram: Shows the graph of the Interval Histogram of the
beat-to-beat measurements.
Survival Function: Shows the graph of the way to estimate the Survival Function
[12], which is constructed from the histogram of the intervals between heartbeats.
A window shows the time that should elapse with 95% probability before the next
heartbeat appears.
Distribution comparison: Shows the analytical and graphical results of applying
a hypothesis test to compare the real RR-interval distribution with the
corresponding normal theoretical distribution. The hypothesis test used is the
Kolmogorov-Smirnov test applied at p=0.05. A window shows the maximal
differences, both real and theoretical, a comment saying if the RR-interval
distribution does or does not differ significantly from the corresponding Gaussian
theoretical distribution, as well as the values of the Skewness and Curtosis of the
real distribution.
Sequential Menu
This menu allows making a sequential analysis of the RR-interval series by both
analytical and graphical methods for studying the possible temporal dependencies
between successive RR intervals or between those even farther away. This menu includes
the following options:
•
•
•
•
Joint Interval Histogram [12]: Shows a graph of joint intervals, in which each
RR-interval value is plotted against the previous one; it is also called a Poincaré
[13] plot or a Phase Diagram.
Serial Correlogram [14]: Shows a graph with the results of the calculation of 50
serial correlation coefficients.
Autocorrelogram [14]: Shows a graph with the Autocorrelogram of the analyzed
recording.
Statistical Indexes: RMSSD[1]; NN50 count[1]; pNN50[1]; pNN5%Mean
(number of consecutive intervals that differ by more than 5% of the mean-interval
value divided by the total number of RR intervals in the recording); SD1 [13];
SD2 [13]; SD1/SD2; SD1 in normalized units (SD1/mean RR interval * 1000);
SD2 in normalized units (SD2/mean RR interval * 1000).
Spectral Menu
This menu offers 3 options:
•
•
•
FFT Spectrum: Allows graphing the Welch’s Periodogram [5] based on the FFT
algorithms. This method is applied to a signal constructed from the RR-interval
values after resampling them at a fix frequency using the Berger algorithms [15].
FFT Bands: Shows the power by frequency band that have been shown to
correlate with known physiological mechanisms [1], which influence heart rate
variability. The bands analyzed are the Very Low Frequency (VLF), the Low
Frequency (LF) and the High Frequency (HF) components of the power spectrum,
together with the Total Power (TP) of the spectrum. The energy values of these
bands appear in ms2, in percentage values and also in normalized units (n.u.),
calculated by the following relations [1]: LF/(TP-VLF)x100 and HF/(TP-VLF) x
100. The peak frequencies in Hz and the ratio LF/HF are also calculated.
Settings: Allows selecting the values of the parameters that will be used to
estimate the power spectrum (Fig. 5).
Status report and Future plans
The present software version (1.5.1) is fully functional. VFC32 runs on operating
systems 9x or higher. The® Windows®personal computers with Microsoft program
requires at least about 350 KB of hard disk memory (about 900 KB including the help
system and the user’s manual), 64 MB of RAM and an audio card appropriately installed
on the PC.
This software has already been used in the following institutions: -Faculty of Medicine,
University of the Republic, Montevideo, Uruguay; -Faculty of Psychology, Warsaw
University, Poland; -Faculty of Biology, Havana University, Cuba; -National Institute of
Cardiology “Ignacio Chávez”, Mexico City; -Faculty of Sciences, UNAM, Mexico City
and recently in the Centro de Investigaciones y Rehabilitación de Ataxia Hereditaria,
Holguin, Cuba. VFC32 can be used both for clinical research and for normal population
studies.
The next version of the software VFC32 will contain a database module that will allow
creating, access, manipulating and recovering information using ActiveX Objects®
compatible databases through the Microsoft®Microsoft’s Access framework (ADO).
This database system will store the HRV indexes obtained with VFC32 and will facilitate
HRV studies because the information will be processed in different ways.
We also plan to include the possibility to store the digitized ECG signal in audio files
format (.wav) and to compress them. On the other hand, the next version will include the
creation of custom reports that facilitate the printing of the processed results.
Sample of Runs
In this selection we present an example of the VFC32’s main options execution using the
same data showed in the figures 2 and 3.
By means of the VFC32’s acquisition module we digitize an ECG register made through
a conventional electrocardiograph (Cardiofax, Nihon Kohden) to a young female
volunteer person. This subject was asked to sit comfortably in an armchair and was
connected leads to her arms and to the left leg.
The obtained record (Fig. 3) was saved in an .ecg file and then the RR intervals was
calculated and stored in an ASCII file. Starting from this file the corresponding
Tachogram can be shown (Fig. 2) as the first HRV index.
The figures 6, 7 and 8 shown some of the main HRV index that software offers calculated
from the previous mentioned RR intervals. The Fig. 6 shown the Interval Histogram of
the beat-to-beat measurements and a table that contain some of the statistical results of
the non-sequential analysis.
The sequential analysis includes, among others tests, the Joint Interval Histogram, also
called Poincare or Phase Diagram. This graph is presented in the Fig. 7 jointed with a
table that contains all the analytical results obtained through this type of analysis.
A Welch’s Periodogram is shown in the Fig. 8 using the Hann window and including
1024 points in the frequency domain. The RR intervals were previously interpolated at 4
Hz using the Berger’s algorithm; also be shown a table with some of the numerical
results of the VFC32’s spectral analysis option.
Mode of availability
It is possible to obtain this software in a free way sending an electronic mail to the
authors to the following address: [email protected]. This email must include the
applicant’s data and explain shortly the use that will be given to the software.
Acknowledgements
The authors thank the decisive collaboration in several topics of Dr. Eduardo Migliaro
and his research group at the Physiology Department, Faculty of Medicine, University of
the Republic, Montevideo, Uruguay. We also thank the help given in the validation of the
acquisition and measurement of intervals module to Profr. Oscar Infante and to Eng.
Salvador Cortés of the Electromechanical Instrumentation Department, National Institute
of Cardiology “Ignacio Chávez”, Mexico City.
References
1. Task Force of the European Society of Cardiology and North American Society of
Pacing and Electrophysiology, Heart rate variability. Standards of measurement,
physiological interpretation, and clinical use, Circulation, 93 (1996) 1043-1108
2. G.G. Berntson, J.T. Bigger, Jr, D.L. Eckberg, P.G. Crossman, P.G. Kaufmann, M.
Malik, H.N. Nagaraja, S.W. Porges, J.P. Saul, P.H. Stone M.W. Van der Molen,
Heart rate variability: Origins, methods, and interpretative caveats,
Psychophysiology, 34 (1997) 623-648
3. J. Niskanen, M.P. Tarvainen, P.O. Ranta-aho P.A. Karjalainen, Software for
advanced HRV analysis, Computer Methods and Programs in Biomedicine, 76
(2004) 73-81
4. E.R. Migliaro, R. Canetti, P. Contreras M. Hakas, Heart Rate Variability: ShortTerm Studies are as Useful as Holter to Differentiate Diabetic Patients from
Healthy Subjects, Annals of Noninvasive Electrocardiology, 8 (4) (2003) 313–
320
5. S. Marple, Digital Spectral Analysis with Applications, Englewood cliffs,
Prentice-Hall International, New Jersey, 1987
6. A.C. Moore, Working with Waveforms, Delphi Informant Magazine, (2002)
7. C. Petzold, Sound and Music, in Programming in Windows: The definitive
developer’s guide to the Windows 98 API, eds. pp. 993-1089 (Microsoft Press,
1998)
8. A. Machado, E.R. Migliaro, P. Contreras F. Coro, Automatic filtering of RR
intervals for heart rate variability analysis., Annals of Noninvasive
Electrocardiology, 5 (3) (2000) 255-261
9. J.J. Bailey, A.S. Berson A.J. Garson, Recommendations for standardization and
specifications in automated electrocardiography., Circulation, 81 (1990) 730-739
10. C. Lerma, O. Infante M.V. José, Sistema de captura y análisis de la variabilidad
de la onda del pulso arterial y de la frecuencia cardiaca, ELECTRO 2002, (2002)
447-450
11. M.C. Teich, S.B. Lowen, B.N. Jost, K. Vibe-Rheymer C. Heneghan, Heart Rate
Variability: Measures and Models, Ch. 6, in Nonlinear Biomedical Signal
Processing, eds. Akay M., pp. 159-213 (IEEE Press, New York, 2000)
12. G.P. Moore, D.H. Perkel J.P. Segundo, Statistical analysis and functional
interpretation of neuronal spike data, Ann. Rev. Physiol, 28 (1966) 493-522
13. M. Brennan, M. Palaniswami P. Kamen, Do Existing Measures of Poincare’ Plot
Geometry Reflect Nonlinear Features of Heart Rate Variability?, IEEE
Transactions on biomedical engineering, 48 (11) (2001) 1342-1347
14. D.R. Cox V. Isham, Point Process, in eds. pp. (Chapman and Hall, 1980)
15. R.D. Berger, S. Akselrod, D. Gordon R.J. Cohen, An efficient algorithm for
spectral analysis of heart rate variability, IEEE Trans Biomed Eng, 33 (1986)
900–904