1
ECG2HRV: A NEW TOOL FOR THE
RESEARCH IN HEART RATE
VARIABILITY
PROYECTO DE SISTEMAS INFORMÁTICOS
Miguel Ángel Menárguez García
Facultad de Informática
Universidad Complutense de Madrid
Julio 2013
ECG2HRV: A NEW TOOL FOR
THE RESEARCH IN HEART
RATE VARIABILITY
Project report
IT/2013/07
Supervised by Drs:
Jose Ignacio Hidalgo
(Universidad Complutense de Madrid)
John Dyer
(University of Oklahoma)
Facultad de Informática
Universidad Complutense de Madrid
Julio 2013
c Miguel Ángel Menárguez García
Copyright Special Regards
En el estudio no existe la saciedad
Erasmo de Rotterdam (1469-1536)
Intelligence is the ability of sorting and interlacing all acquired knowledge
and possible resources, in order to eciently solve problems that may arise
during our lives. Education is the cornerstone of such process; each learned
concept entails a new tool to solve such matters.
Firstly, I want to aknowledge all the time, eort, and support that my
parents have brought me during these past years. In second place I would like
to thank the Complutense University of Madrid (UCM) for oering me the
opportunity to improve the tools I am able to use today, as well as to bring
me the chance to learn similar contents from dierent points of view thanks
to study abroad scholarships. The year I studied at Bordeaux (France), made
my curiosity bloom to learn from other cultures and their methods. It was
not until this year when I studied in the University of Oklahoma that my
brain developed a research way of thinking. Without that cultural exchange
I would probably had not even thought about building something like this
project or other I am working on, but thanks to that European scholarship,
I was able to adapt to a dierent University system and blend it with the
Spanish one in order to get best of both.
I hope that this kind of opportunities will never disappear from the educational budget of Spain or any other country. If they are given to students
with thirst of knowledge, they will make those seeds grow along with the
prosperity of the nation.
To nish, I would like to credit my directors Dr John and Dr. Hidalgo
for their guidance an continuous help in this project.
Education is the most powerful weapon
which you can use to change the world.
v
vi
Special Regards
Nelson Mandela
Abstract
Man is a tool-using animal. Without
tools he is nothing, with tools he is all.
Thomas Carlyle
Heart Rate Variability (HRV) is a non invasive and simple source of markers
that have been proved to be clinically relevant in studies to predict patient
evolution like survival after Myocardial Infarction (Buccelletti et al., 2009)
and classication of others like Diabetic Neuropathy (Pagani, 2000). Furthermore, Medicine is not the only eld it has being applied. Transition from one
emotional state like happiness to other like sadness have been successfully
detected and predicted by correlating various HRV markers (Wu et al., 2010).
Despite all the applications and studies in which HRV has utilized, its
usefulness as research tool remains unexploited in many elds in which relations between the investigation and HRV parameter have not been explored.
We noticed that there was no software allowing the possibility of storing all
ECG recordings in order to make sense of extracted HRV data, and so we
have created a tool to encourage researchers to discover new lines of inquiry.
In this report we present the development of a new clinical tool , ECG2HRV,
based on personal computing devices. This software allows the user to automatically analyze an electrocardiograph (ECG) for heart rate variability
(HRV) and store it in a database along with all the relevant non-demographic
patient information. For this purpose we developed a new QRS detection algorithm with low complexity and implemented it in order to give the user
a time and frequency domain HRV analysis. A transformation algorithm to
resample at 4 Hz, proposed by (Berger et al., 1986), is applied to the timeirregular signal, in order to convert the input to a time-continuous wave that
can be now subject of Fourier analysis in the frequency domain.This process
is transparent to the user showing only the visual RR detection and HRV
report, saving time in this way to the researcher and enabling storage of the
results with all the ECG relevant information so that it can be used to cross
search groups of patients with certain clinic features.
vii
viii
Abstract
Key Words
HRV
ECG
ECG2HRV
HEART
RATE
VARIABILITY
DATABASE
TIME
FREQUENCY
DOMAIN
Resumen
La Variabilidad de la frecuencia cardíaca (VFC) es una fuente de marcadores que ha demostrado una clara relevancia clínica en la predición del
Infarto de Miocardio (Buccelletti et al., 2009) y en la clasicación de otras
enfermedades tales como el trastorno neuropático (Pagani, 2000). Es mas,
la VFC no sólo se emplea únicamente en el campo de la Medicina. Diversos
marcadores de la VFC han sido correlacionados satisfactoriamente con diversas transiciones emocionales tales como el paso de la alegría a la tristeza
(Wu et al., 2010).
Independientemente de los estudios en los que la VFC ha sido empleada,
su potencial como herramienta de investigación está aun por desarrollar y
en muchos campos las correlaciones con la VFC permanecen inexploradas.
Al darnos cuenta de que no se disponía de software adecuado que permitiera
el almacenamiento de registros de Electrocardiogramas (ECG) para poder
extraer a partir de ellos datos útiles de VFC, creamos una herramienta que
permitiera impulsar a los investigadores hacia nuevas líneas de desarrollo .
En este trabajo, presentamos una nueva herramienta clínica, ECG2HRV,
capaz de ejecutarse en cualquier ordenador personal. Este software permite
al usuario analizar automáticamente resultados de un ECG parar averiguar
la VFC y almacenar la información en una base de datos junto con todos los
datos no demográcos relevantes del paciente. Para ello, hemos desarrollado
un nuevo algoritmo de detección de los complejos QRS de un ECG de baja
complejidad, que permite al usuario obtener un análisis de la VFC en el dominio del tiempo y de la frecuencia. Para efectuar el análisis del espectro de
la frecuencia se ha implementado un algoritmo prpuesto por (Berger et al.,
1986) que muestrea a 4 Hz la señal irregular en el tiempo transformándola
en continua para poder realizar análisis de Fourier. El proceso es transparente para el usuario, de tal forma que muestra únicamente la detección de
intervalos RR y el informe de la VFC, ahorrando de esta forma tiempo al investigador. Esto permite también el almacenamiento de los resultados junto
con toda la información relevante del ECG, con el n de que pueda ser utilizada en búsquedas cruzadas de pacientes con determinadas características
clínicas.
ix
x
Resumen
Palabras Clave
HRV
ECG
EKG
VFC
ECG2HRV
VARIABILIDAD
FRECUENCIA
CARDÍACA
BBDD
ANALISIS
Contents
Special Regards
v
Abstract
vii
Resumen
ix
1. Introduction
1.1. Introduction . . . . . . . . . . . . . . . . . . . . . . . .
1.2. What is ECG2HRV (Electrocardiogram to Heart Rate
ability )? . . . . . . . . . . . . . . . . . . . . . . . . . .
1.3. Who is intended to use ECG2HRV? . . . . . . . . . .
1.4. History example of a potential ECG2HRV user . . . .
1.5. Chapter Structure . . . . . . . . . . . . . . . . . . . .
2. Background
2.1. What is an ECG (Electrocardiogram )? .
2.2. What is an RR interval? . . . . . . . . .
2.3. What is HRV (Heart Rate Variability )?
In the next chapter . . . . . . . . . . . . . . .
3. Signal Processing
3.1. Process overview . . . . . . . .
3.2. Filtering Process . . . . . . . .
3.3. Preprocessing Filtered Signal .
3.4. NN-Interval Detection . . . . .
3.5. Time Domain HRV Parameters
3.6. Frequency HRV Parameters . .
In the next chapter . . . . . . . . . .
4. ECG2HRV User Guide
.
.
.
.
.
.
.
.
.
.
.
.
.
.
.
.
.
.
.
.
.
.
.
.
.
.
.
.
.
.
.
.
.
.
.
.
.
.
.
.
.
.
.
.
.
.
.
.
.
.
.
.
.
.
.
.
.
.
.
.
.
.
.
.
.
.
.
.
.
.
.
.
.
.
.
.
.
.
.
.
.
.
.
.
.
.
.
.
.
.
.
.
.
.
.
.
.
.
.
.
.
.
.
.
.
.
.
.
.
.
.
.
.
.
.
.
.
.
.
.
.
.
.
. . . .
Vari.
.
.
.
.
.
.
.
.
.
.
.
.
.
.
.
.
.
.
.
.
.
.
.
.
.
.
.
.
.
.
.
.
.
.
.
.
.
.
.
.
.
.
.
.
.
.
.
.
.
.
.
.
.
.
.
.
.
.
.
4.1. System Requirements . . . . . . . . . . . . . . . . . . . . . . .
4.2. First Run . . . . . . . . . . . . . . . . . . . . . . . . . . . . .
1
1
2
2
3
3
5
5
6
7
7
9
9
9
11
12
12
12
15
17
17
18
xi
xii
Content Table
4.3.
4.4.
4.5.
4.6.
4.7.
ECG Insertion . . . . . .
ECG Search . . . . . . . .
RR Detection . . . . . . .
HRV analysis . . . . . . .
Utilities . . . . . . . . . .
4.7.1. Change password .
4.7.2. Compact database
In the next chapter . . . . . . .
5. Architecture
.
.
.
.
.
.
.
.
.
.
.
.
.
.
.
.
.
.
.
.
.
.
.
.
.
.
.
.
.
.
.
.
5.1. Overview . . . . . . . . . . . . .
5.2. Denitions . . . . . . . . . . . . .
5.2.1. Use Case . . . . . . . . .
5.2.2. Class Domain . . . . . . .
5.2.3. Architecture . . . . . . . .
5.2.4. Component Diagram . . .
5.2.5. Use Case Diagram . . . .
5.2.6. Model View Controller . .
5.3. Use Case Document . . . . . . .
5.3.1. Login . . . . . . . . . . .
5.3.2. Exit . . . . . . . . . . . .
5.3.3. Search ECG . . . . . . . .
5.3.4. Insert ECG . . . . . . . .
5.3.5. Modify ECG . . . . . . .
5.3.6. Delete ECG . . . . . . . .
5.3.7. Import ECG . . . . . . .
5.3.8. DetectRR . . . . . . . . .
5.3.9. Modify RR-detection . . .
5.3.10. Save RR-detection . . . .
5.3.11. HRV Analysis . . . . . . .
5.3.12. Save HRV Analysis . . . .
5.3.13. Change Password . . . . .
5.3.14. Compact Database . . . .
5.4. Data Model . . . . . . . . . . . .
5.4.1. Class Description . . . . .
5.4.2. Database implementation
5.5. Visual Component Architecture .
5.6. Control Component Architecture
5.6.1. Login . . . . . . . . . . .
5.6.2. Main Menu . . . . . . . .
5.6.3. Insert ECG . . . . . . . .
.
.
.
.
.
.
.
.
.
.
.
.
.
.
.
.
.
.
.
.
.
.
.
.
.
.
.
.
.
.
.
.
.
.
.
.
.
.
.
.
.
.
.
.
.
.
.
.
.
.
.
.
.
.
.
.
.
.
.
.
.
.
.
.
.
.
.
.
.
.
.
.
.
.
.
.
.
.
.
.
.
.
.
.
.
.
.
.
.
.
.
.
.
.
.
.
.
.
.
.
.
.
.
.
.
.
.
.
.
.
.
.
.
.
.
.
.
.
.
.
.
.
.
.
.
.
.
.
.
.
.
.
.
.
.
.
.
.
.
.
.
.
.
.
.
.
.
.
.
.
.
.
.
.
.
.
.
.
.
.
.
.
.
.
.
.
.
.
.
.
.
.
.
.
.
.
.
.
.
.
.
.
.
.
.
.
.
.
.
.
.
.
.
.
.
.
.
.
.
.
.
.
.
.
.
.
.
.
.
.
.
.
.
.
.
.
.
.
.
.
.
.
.
.
.
.
.
.
.
.
.
.
.
.
.
.
.
.
.
.
.
.
.
.
.
.
.
.
.
.
.
.
.
.
.
.
.
.
.
.
.
.
.
.
.
.
.
.
.
.
.
.
.
.
.
.
.
.
.
.
.
.
.
.
.
.
.
.
.
.
.
.
.
.
.
.
.
.
.
.
.
.
.
.
.
.
.
.
.
.
.
.
.
.
.
.
.
.
.
.
.
.
.
.
.
.
.
.
.
.
.
.
.
.
.
.
.
.
.
.
.
.
.
.
.
.
.
.
.
.
.
.
.
.
.
.
.
.
.
.
.
.
.
.
.
.
.
.
.
.
.
.
.
.
.
.
.
.
.
.
.
.
.
.
.
.
.
.
.
.
.
.
.
.
.
.
.
.
.
.
.
.
.
.
.
.
.
.
.
.
.
.
.
.
.
.
.
.
.
.
.
.
.
.
.
.
.
.
.
.
.
.
.
.
.
.
.
.
.
.
.
.
.
.
.
.
.
.
.
.
.
.
.
.
.
.
.
.
.
.
.
.
.
.
.
.
.
.
.
.
.
.
.
.
.
.
.
.
.
.
.
.
.
.
.
.
.
.
.
.
.
.
.
.
.
.
.
.
.
.
.
.
.
.
.
.
.
.
.
.
.
.
.
.
.
.
.
.
.
.
.
.
.
.
.
.
.
.
.
.
.
.
.
.
.
.
.
.
.
.
.
.
.
.
.
.
.
.
.
.
.
.
.
.
.
.
.
.
.
.
.
.
.
.
.
.
.
.
.
.
.
.
.
.
.
.
.
.
.
.
.
.
.
.
.
.
.
.
.
.
.
.
.
.
.
.
.
.
.
.
.
.
.
.
.
.
.
.
.
.
.
.
.
.
.
.
.
.
.
.
.
.
.
.
18
21
23
23
24
24
24
25
27
27
27
27
28
28
28
28
28
28
29
30
31
31
32
33
33
34
34
35
36
36
37
38
38
38
42
42
45
45
46
47
Content Table
5.6.4.
5.6.5.
5.6.6.
5.6.7.
In the next
Search ECG .
RR-Detection
HRV Analysis
Utilities . . .
chapter . . . .
xiii
.
.
.
.
.
.
.
.
.
.
.
.
.
.
.
.
.
.
.
.
.
.
.
.
.
.
.
.
.
.
.
.
.
.
.
.
.
.
.
.
.
.
.
.
.
.
.
.
.
.
.
.
.
.
.
.
.
.
.
.
.
.
.
.
.
.
.
.
.
.
.
.
.
.
.
.
.
.
.
.
.
.
.
.
.
.
.
.
.
.
.
.
.
.
.
.
.
.
.
.
.
.
.
.
.
.
.
.
.
.
.
.
.
.
.
48
49
50
51
52
6. Discussion
53
References
57
Acronym List
59
In the next chapter . . . . . . . . . . . . . . . . . . . . . . . . . . .
55
Figure Index
2.1. Anatomic structure of the heart. QRS compex . . . . . . . . .
2.2. Example of RR-interval . . . . . . . . . . . . . . . . . . . . . .
6
7
3.1. Signal proccessing steps for ECG segment . . . . . . . . . . .
3.2. REsampling algorithm . . . . . . . . . . . . . . . . . . . . . .
11
14
4.1.
4.2.
4.3.
4.4.
4.5.
4.6.
4.7.
Login Dialog Frame . . .
Insert ECG Frame . . .
Search ECG Frame . . .
RR detection Frame . .
HRV Analysis Frame . .
Utilities Frame . . . . .
Change Password Frame
.
.
.
.
.
.
.
.
.
.
.
.
.
.
.
.
.
.
.
.
.
.
.
.
.
.
.
.
.
.
.
.
.
.
.
.
.
.
.
.
.
.
.
.
.
.
.
.
.
.
.
.
.
.
.
.
.
.
.
.
.
.
.
.
.
.
.
.
.
.
.
.
.
.
.
.
.
.
.
.
.
.
.
.
.
.
.
.
.
.
.
.
.
.
.
.
.
.
.
.
.
.
.
.
.
.
.
.
.
.
.
.
.
.
.
.
.
.
.
.
.
.
.
.
.
.
.
.
.
.
.
.
.
.
.
.
.
.
.
.
.
.
.
.
.
.
.
18
19
21
24
25
26
26
5.1. Global Use Case diagram . . . . . . . . . . . . .
5.2. Class Domain First part . . . . . . . . . . . . .
5.3. Class Domain second part . . . . . . . . . . .
5.4. Database Schematic Diagram . . . . . . . . .
5.5. Visualization Component Model . . . . . . . .
5.6. Component Diagram of Login control . . . . .
5.7. Component Diagram of Main Menu control .
5.8. Component Diagram of InsertECG control . .
5.9. Component Diagram of SearchECG control .
5.10. Component Diagram of RRDetection control
5.11. Component Diagram of HRV Analysis control
5.12. Component Diagram of Login control . . . . .
.
.
.
.
.
.
.
.
.
.
.
.
.
.
.
.
.
.
.
.
.
.
.
.
.
.
.
.
.
.
.
.
.
.
.
.
.
.
.
.
.
.
.
.
.
.
.
.
.
.
.
.
.
.
.
.
.
.
.
.
.
.
.
.
.
.
.
.
.
.
.
.
.
.
.
.
.
.
.
.
.
.
.
.
.
.
.
.
.
.
.
.
.
.
.
.
.
.
.
.
.
.
.
.
.
.
.
.
29
39
40
43
45
46
47
48
49
50
51
52
xv
Table Index
3.1. Selected time-domain measures for HRV from Camm et al. (1996)
3.2. Selected frequency-domain measures for HRV from Camm et al.
(1996) . . . . . . . . . . . . . . . . . . . . . . . . . . . . . . .
13
14
xvii
Chapter 1
Introduction
This chapter will introduce the importance of Heart Rate
Variability and depict the structure of this document.
Abstract:
1.1. Introduction
ECG is well known to be a marker for various pathologies of the cardiac
excitation cycle. When the ECG is collected from multiple leads in the classic 12- lead arrangement, a number of mechanical heart pathologies can also
be detected and diagnosed (Geiger, 1939; Einthoven, 1925). More recently, HRV is a secondary parameter that has been extracted from the ECG,
which helps dierentiate the clinical diagnosis of heart and lung diseases,
such as COPD (Chronic Obstructive Pulmonary Disease ) and CHF (Congestive Heart Failure ), (Volterrani et al., 1994; Huikuri, 1995). HRV is closely
related to the activity of the autonomic branch of the body's central nervous system (Pomeranz et al., 1985), and is also predictive of potential heart
rhythm pathologies in elderly patients.
ECG measurement devices have built-in implementation of the HRV parameters, but those values are dicult to extract and relate with a desired
ECG time segment. Without this skill, testing any hypothesis using HRV
markers based on obtained data, becomes a tedious task that obliterates future research by shadowing data we already have, not allowing the physician
to easily correlate that information. In this reality it was our main purpose
to prevent looses of that precious content as well as promoting HRV future
research.
The second reason that led us to start this task was the fact that many
health professionals do not have the required knowledge, time, or experience
1
2
Chapter 1.
Introduction
to extract those values from a raw ECG signal. This application enables any
non related signal processing user to import a single lead ECG with any valid
sampling frequency as input, and get it ltered, processed, and analyzed by
following three simple steps. To ensure user condence, this procedure is
backed up with visual feedback, so that he can guess what is being worked
out in the background.
1.2. What is ECG2HRV?
The work presented in this report implements industry-standard measurements of HRV within the construct of a platform-independent utility
coded in JAVA that allows the clinician to immediately assess a patient HRV
status and store this information along with other relevant clinical features.
HRV parameters are computed in both the time domain and the spectral
domain based on a ve minute, single channel ECG recording. The values
are presented to the clinician, as well as the ECG itself, providing an opportunity for the user to override or exclude any part of the ECG determined
not acceptable for the analysis. This mobile device-based tool is useful because it supports a new paradigm in clinical diagnosis that joins the power of
computer and database analysis helping to work out a dierential diagnosis
for each patient.
1.3. Who is intended to use ECG2HRV?
If you are a physician or researcher that deals everyday with 5 minutes
ECG info, this may be the perfect tool for you. It enables you to safely store
all the collected data while maintaining its order. ECG2HRV should not only
be used as a data management tool, but also as a source of research ideas or
for research itself.
In-built ECG2HRV capacity to automatically detect all the NN intervals,
allows to calculate all the HRV parameters with a single click, instantly
translating them to a time gain for the user. No more complex programs or
software will be needed to get the desired HRV markers. In addition to this
comfortable advantage, this software allows to perform dierent searchs in
which any eld can be crossed with each other so that ECG groups can be
isolated to identify potential research lines, or to select a particular block of
patients.
The only requirement this software needs is having a reliable source of
ECG measurement. Technology is evolving in this eld and many devices are
being approved by the FDA (US Food and Drug Administration ) and can
be obtained at a quite reasonable prize, this is, less than 200 $. This new
1.4. History example of a potential ECG2HRV user
3
hardware pieces have simplied clinical information gathering by enabling
research to move through dierent paths easily without high budget requirements. Taking safe ECG measurements from patients now becomes as easy
as to let them hold a phone with a piece of hardware for ve minutes.
Not only researchers are the only sector designated for the use of ECG2HRV,
but anyone with access to any of these devices curious enough about HRV
and their conditions is also a perfect target. They could even conduct research taking ECG of themselves at dierent situations and scenarios.
1.4. History example of a potential ECG2HRV user
Paul is a fty-three years old cardiologist that worked for twenty years
diagnosing diverse abnormalities related to heart diseases. He has always
dreamed on conducting research on HRV but never had enough evidence
of where to start in. After twenty years of work he has realized that there
may be a link between Vagus nerve stimulation and improvement in heart
rate variability. He came to that hypothesis after taking ve minutes ECG
recordings from patients that used listening aid devices. His guess is that a
small intensity of the electric eld generated from this hardware is conducted through Tragus and absorbed by the parasympathetic Vagus nerve. In
his observations, patients with reduced high frequency HRV improved their
numbers by more than ten times when being tested while using those devices.
Paul had a good guess, and it took him around twenty years of eld work
to do it so. Can you imagine if he could check if that hypothesis was correct
with past twenty year patient data? What is more, can you think of how
easy it could be for him to perform a simple search in order to discover if he
may be right by comparing all the data he had from all his patients? This
functionality may not only lead him to check if an hypothesis may be correct,
but to discover new possible research lines by isolating patient groups with
certain characteristics associated to each ECG.
ECG2HRV is intended to promote research in Heart Rate Variability by
oering the user required tools to store, process, and search HRV for a raw
ECG detaching the user from signal processing. If Paul had started using
this tool twenty years ago, he would probably had arrive to that intuition or
another way before than he did.
1.5. Chapter Structure
This document is structured with the following sections:
4
Chapter 1.
Introduction
Chapter 2 will dene the required concepts to understand what this
application does and the physiological proporties that lay behind ECG.
Chapter 3 explains in detail the algorithms developed to get the industrystandard HRV measurements along with all the process description.
Chapter 4 spans the end-user manual describing how to use the application. If the reader is not a developper, he will probably only be
interested in this section.
Chapter 5 presents the architecture of the application following the
standard UML (Unied Modeling Language ) notation. This part is
conceived for other developpers to diminish the burden of modifying it
to include new features.
Chapter 6 Will disscuss advantages and shortcomings of ECG2HRV.
Chapter 2
Background
One's mind has a way of making itself
up in the background, and it suddenly
becomes clear what one means to do.
A. C. Benson
This chapter will explain the required concepts to understand what concepts and tools are used by the application as well
as the relevant physiological information that is attached to them.
Abstract:
2.1. What is an ECG?
From the body's perspective, the heart's function is that of a hydraulic
pump, moving blood through the vessels that course through the body. In
order to accomplish this, the heart has both mechanical and electrical structures that have important characteristics related to health and illness.
The heart consists of four chambers: two upper chambers, left and right
atriums, and two lower chambers, right and left ventricles. From a mechanical standpoint, the muscle mass of the two atria contracts when the SA
Node rst excites the local myocardial tissue. There is a delay point between
the upper and lower chambers called the AV Node. This node delays the
electrical excitation to ensure that the atria fully contract and fully charge
the ventricles with blood. Subsequently, the electrical signal travels down
two major bundle branches through the center wall of the heart (called the
ventricular septum). These bundle branches are insulated so that the electrical signal does not excite local septum myocardium. As the bers reach
the tip (called the apex) of the heart, they exit the insulating sleeves and
electrically excite the ventricular muscle mass.
5
6
Chapter 2.
Background
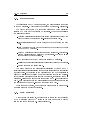
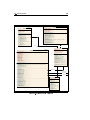
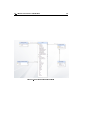
Figure 2.1: The graphic on the upper left shows the outer structure of the heart, for
anatomical reference, with part of the heart wall cut away to show the location of
the electrical bers. The graphic on the lower right is a schematic of the activation
sequence for these bers and their electrical manifestation on the body surface.
Excitation wave starts at the apex and moves up towards the upper part
of the ventricles. In this fashion, the ventricles squeeze the blood out into the
body. The key to ensure that the atria and ventricles operate in the proper
sequence, and with appropriate timing, is the electrical system of bers in
the heart. But, it is the mass of contractile muscle tissue that produces
the electrical signal that can be recorded from the body surface. The body
surface recording of the cardiac electrical signal is the electrocardiogram,
often referred to as the ECG.
2.2. What is an RR interval?
The time lapsed from one QRS complex to the next is called RR interval.
The ducial mark we have used to determine the QRS complex is the end
of the rising edge, this is the R peak, due to its easily recognizable pattern.
This duration is measured in miliseconds and can be used to calculate the
heart rate frequency. An example is shown below in 2.2
An special case of RR interval is the normal-to-normal Interval or NN
Interval. Synus RR intervals whose neighbours follow synus rhytm too, are
considered to be Normal. Only normal intervals are taken into account to
calculate the Heart Rate Variability of the pacient; the remaining beats are
discarded.
2.3. What is HRV?
7
Figure 2.2: Example of RR-interval
2.3. What is HRV?
The change in duration between NN intervals due to physiological factors
is called Heart Rate Variability. In 1996 the European Society of Cardiology along with the North American Society of Pacing and Electrophysiology
standarized the 5 minutes and 24 hours ECG recording markers for HRV, in
order to prevent incorrect conclusions from excessive or unfounded extrapolations of such measures.
There are several domains when it comes to HRV, each of them with
its own marker. In this project we only consider 5 minutes ECG recordings.
The time domain markers are shown in Table 3.1 and the frequency domain
domain markers are at Table 3.2
In the next chapter. . .
Once we have explained the required concepts, we will proceed to explain
how we lter the signal to remove artifact, process it to detect R-peaks,
and describe the transformations required to perform PSD (Power Spectral
Density ) of the series of NN intervals to obtain all HRV parameters.
Chapter 3
Signal Processing
The process of scientic discovery is, in
eect, a continual ight from wonder.
Albert Einstein
This chapter describes the process that was developed in
order to get HRV analysis from a single lead ECG raw signal at any
sampling rate.
Abstract:
3.1. Process overview
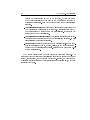
This procedure can be divided into the following subsequent tasks:
Filtering the signal to remove artifact.
Preprocessing the ltered signal for the next step.
Detecting NN intervals disregarding abnormal ones.
Convert irregular time function of intervals to a regular
output.
Calculate
time domain HRV parameters.
Calculate
frequency domain HRV parameters.
continuous
3.2. Filtering Process
ECG signal can be misinterpreted due to dierent kind of artifacts. Removing them to get a clearer signal is vital to get neat results. The main
artifact sources of ECG are:
9
10
Chapter 3.
Signal Processing
AC interference : Alternating Current is the power source used for all
electronic equipment can cause the signal to look like thick and "hairy".
Baseline Wonder : When the isoelectric line changes its position, a roller
coaster like behavior is observer in the output, changing the level that
is considered to be the ground. This interference usually is the low
frequency band of the ECG
Muscle artifact : Movement of the muscles generate electric impulses
that are recorded by the leads and can obscure ECG output. When
muscle tremors occurs, continuous random values are passed to the
leads making sometimes the signal unintelligible.
To remove most of the artifacts described above we followed part of
the process proposed at (Pan y Tompkins, 1985) with some modications.
They propossed a bandpass lter composed by a high pass andd low pass
sequential ltering process. Instead, we used a butterworth lter of 6th order
to allow only frequencies in the range of 2-20 Hz. This procedure gets rid of
two artifacts: baseline wondering dissapears because it is below the low cut
frequency, and AC interference of 50 or 60 HZ gets removed too from the
output because of the fact that it exceed he high cut-o frequency. Muscle
artifact is removed at high frequencies, but random generated tremors that
lay in the frequency of 2-20 Hz can not be separated from the original signal.
Not all artifact can be removed, ECG segments can be targeted by unexpected patient movements, lead misplacements, or muscle tremors. Even
though, the algorithm described later will not count RR intervals that are
not considered as normals, which solves this issue.
The lter was implemented in JAVA using an Innite Impulse Response
(IIR) algorithm shown in formula 3.1, where P is the lter order,bi are the
numerator lter coecients, ai are the denominator lter coecients, x[n] is
the input signal, and y[n] is the output signal. The coecients for a and b
c and stored staticaly in te source code.
where calculated using Matlab
To remove the delay from the lter, the output of the bandpass IIR Butterworth lter was reversed, then ltered again with the same parameters,
and reversed again.
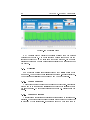
Figure 3.1(a) shows the ltered ECG signal. Note that the AC artifact
that made the signal go up and down at high frequencies is removed as well
as baseline wonder. Now we can fully apreciate all the features of the ECG:
P-wave at the beggining, QRS complex in the middle, and T-wave at the
3.3. Preprocessing Filtered Signal
11
end of each beat.
1
∗
y[n] =
a0
X
0≤i≤P
bi x[n − i] −
X
bj x[n − j]
(3.1)
1≤j≤P
3.3. Preprocessing Filtered Signal
The second part of this process consists in creating an integrated moving
average window. The size of the window has to be wide enough to create
hill-like waves as shown in Figure 2 (c), but not as big as to merge R peak
and T waves. A default size of 0, 2 ∗ Fs (Sampling Frequency), as suggested
in ??, ensures optimality based on all the empirical tests that were made.
The results for this processing are shown for a three QRS complex example
illustrated in Figure 3.1(c).
The last step of the preprocessing part is to derivate the output of the
moving average window. A single and not computationally expensive algorith
was used based on formula 3.2. The purpose of this last part is to detect
the rising and the falling edge of the hill so that pattern can be recognized
in the following step. The output of this part is shown in Figure 3.1(d).
y[n] = y[n + 1] − y[n]
(3.2)
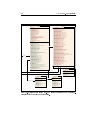
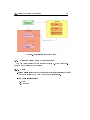
Figure 3.1: ECG Preprocessing: a) Original ECG. b) ECG after bandpass lter.
c) Bandpass lter output after applying the moving integration window. d) Dierentiation from the moving integration window.
12
Chapter 3.
Signal Processing
3.4. NN-Interval Detection
Dierentiated signal allowed us to recognize the QRS complex with the
unique feature described above, but it is not enough to create a simple decision maker in some case scenarios like abnormal QRS due to heart diseases or
very noisy segments. These situations prompted us to develop a NN-Interval
detection algorithm.
The approach is to nd the rst biggest valley within time threshold
THRESHOLD1, then detect if there exists a peak within a second time
threshold THRESHOLD2 that meets the requirements; these are, being a
peak with one of the highest heights in the dierentiated waveform, and
having a peak with an acceptable height in the original waveform.
To prevent bigger T-waves to be detected, all data from last positive
QRS detection to 200 ms later is not used, given that it is physiologically
impossible to have another QRS in such small time lapse.
To classify the dierent type of RR intervals, we chose to implement the
same approach used in [6]. We have a NN-Average calculated with the last
eight valid and normal beats and another RR-Average of the last eight beats.
A beat is considered to be normal if its duration exceeds 0.92*NN-Average
but do not surpass 1.16*NN-Average. All intervals that lay out of normality
are disregarded. If last eight RR detections are normal then NN-Average
becomes RR-Average 2.
A last threshold THRESHOLD3 was used for the dierentiated input
to prevent small valleys originated from noise or other sources from being
detected as possible beats. This value is initialized with the rst detections
and is updated with the average value of the last eight positive R peaks.
A simple check is used to detect if it is a valid candidate for R peak: if
the current valley exceeds k*THRESHOLD3 then the algorithm checks that
possible R peak; if not, it skips that value.
3.5. Time Domain HRV Parameters
The selected time domain HRV parameters are displayed in Table 3.1.
The values are calculated from the NN-interval output explained before.
3.6. Frequency HRV Parameters
To obtain frequency domain parameters, a more complicated process is
required. The NN-interval function is composed of a succession of time values
3.6. Frequency HRV Parameters
Variable
Units Statistical measures
RMSSD
ms
SDNN index
ms
SDSD
ms
NN50 count
ms
pNN50
%
SDNN
SDANN
ms
ms
13
Standard deviation of all NN intervals.
Standard deviation of the averages of NN intervals
in all 5 min segments of the entire recording
The square root of the mean of the sum of the
squares of dierences between adjacent NN intervals.
Mean of the standard deviations of all NN intervals
for all 5 min segments of the entire recording
Standard deviation of dierences between adjacent
NN intervals.
Number of pairs of adjacent NN intervals diering
by more than 50 ms in the entire recording. Three
variants are possible counting all such NN intervals
pairs or only pairs in which the rst or the second
interval is longer.
NN50 count divided by the total number of all NN
intervals.
Table 3.1: Selected time-domain measures for HRV from Camm et al. (1996)
associated with a duration. These values are not equally distributed along
time axis. That is the reason to need to re-sampling data at a rate that will
not miss any beat.
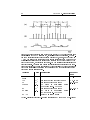
For the re-sampling process we used a linear interpolation approach with
a sampling rate of 4 Hz (Berger et al., 1986). The fact that it is physiologically
impossible to have a beat with length smaller than than 0.25 seconds ensures
that there is no NN-interval value missed.
The re-sampling values depend on which NN-intervals are comprised between its current values and the next. If all the NN interval is inside that
500 ms time span, then the value of the NN interval is taken. On the other
hand, if the time span contains two segments of dierent NN intervals, a
linear interpolation with a window size of 500 ms is made to calculate each
re-sampling point. Figure 3.2 shows an example of how the process works
obtained from (Berger et al., 1986).
Now we have an evenly time-spaced signal whose spectrum can be easily
recognized by using FT (Fourier Transform ). For this purpose we decided
to compute the FT by using a FFT (Fast Fourier Transform ) algorithm
implemented by the library Eichelberger y Ii (2002). The power spectrum is
extracted from the FFT output and added to get the parameters displayed
on Table 3.2.
14
Chapter 3.
Signal Processing
Figure 3.2: Figure extracted from Berger et al. (1986) (b) The heart rate samples
corresponding to the ECG signal in (a), determined using our algorithm.The number of RR intervals within the local window centered at t, is a/I2, and at t2 is b/I3
+ C/I4. The value of the heart rate at each sample point is taken to be the number
of intervals that fell within the local window centered at that point divided by the
width of the window, as described in the text. (c) The corresponding instantaneous
heart rate signal. The value held during each interval is the reciprocal of the duration of that interval. The sample values in (b) are equivalent to those of the signal
that would result from convolution of the signal in (c) with a rectangular window
that is two sample intervals wide.
Variable
Units Description
total spectrum
power
VLF
LF
LF norm
ms2
Power in all spectrum
ms2
ms2
n.u.
HF
HF norm
ms2
n.u.
Power in very low frequency range
Power in low frequency range
LF power in normalised units
LF/(Total Power-VLF) x 100
Power in low frequency range
HF power in normalised units
HF/(Total Power-VLF) x 100
Ratio LF [ms2]/HF [ms2]
HF /LF
Frequency
range
<= 0.4 Hz
<= 0.04 Hz
0.04-0.15 Hz
0.15-0.4 Hz
Table 3.2: Selected frequency-domain measures for HRV from Camm et al. (1996)
In the next chapter. . .
15
In the next chapter. . .
In this sections we have explained the process in which the HRV parameters is calculated so that the user can verify that the output ECG2HRV is
giving is correct.
The next chapter contains a guide detailing the program functions with
visual reference so that the end user can check if he has any questions on its
use..
Chapter 4
ECG2HRV User Guide
It is my fervent wish and my greatest
ambition to leave a work with a few
useful instructions for the pianists after
me.
Franz Liszt
This chapter will present ECG2HRV dierent functionalities and will detail those features. This section is intended to be
read by new users or individuals with questions about a particular
characteristic of the application.
Abstract:
4.1. System Requirements
ECG2HRV is a desktop cross-platform application that can run in difc
c
ferent software architectures like Windows
,Mac
, an any Linux-GNU disc
tribution if they have JAVA virtual machine installed. This feature frees
the user from being forced to use a particular operating sysem which may
be unfamiliar for him.
This application is not intended to run on mobile phones and it will
c
probably not work properly on any of those even if they are JAVA
enabled.
The visual interface was build with a default desktop screen size.
If your operating system does not have JAVA installed, the required les
can be downloaded and isntalled from Oracle webpage.
To install ECG2HRV simply download the zip le and extract its content
to the desired isntallation folder. Do not touch any of the contents of that
folder. If desired, a shortcut can be created to ECG2HRV.jar.
17
18
Chapter 4.
ECG2HRV User Guide
Regarding the execution of the program, right click on ECG2HRV.jar or
its shortcut and right click it, then select your installed JVM (Java Virtual
Machine). After a few seconds the program will start.
4.2. First Run
The rst time the program is executed will be like the rest. Run the
program as described in 4.1, a window like the picture shown in Figure 4.1
will appear. To access in the Login dialog, introduce the default password:
myPassword
We strongly reccomend selecting Utilities in the Main Menu and the click
on change password option, in order to prevent malicius users fron accessing
any of the future contents that the database will have
There is nothing more that is required to be done dierently than the
rest of the runs. Now you are ready to start ECG insertion.
Figure 4.1: Login Dialog Frame
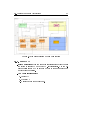
4.3. ECG Insertion
Once the user has logged in, he will be able to insert new ECGs to the
database by selecting Insert ECG option in the main menu. Then, a screen
4.3. ECG Insertion
19
like depicted in Figure 4.2 will be shown.
Figure 4.2: Insert ECG Frame
In this window, we will be able to associate all relevant information of the
patient to the ECG entry without giving away any important demographic
details. This prevents any intruder, if he was able to decrypt and access
database data, to match any of the recorded information to the physical
patient. The options we thought that were relevant are shown in the window.
None of the options are mandatory except for the data of the ECG itself.
To add a new ECG the import process must be successful. Below a more
detailed explanation of the meaning for each eld is shown:
Gender : If the patient is Male or Female.
Age : Age of the patient when the ECG was recorded. If it is unknown
set it to -1.
Date : Date the ECG was recorded. Its default value is the current day.
If it is not known you can click on it and then select none.
Heart Failure : Select the value if the patient has suered of a heart
20
Chapter 4.
failure following NYHA (New
sication ) Classication.
ECG2HRV User Guide
York Heart Association Functional Clas-
Mitral Valve Prolapse : Select if the patient suers from this disease and
pick its degree between Mild, Modere, or Severe. If it does not have
MVP or it is not know leave selected NONE.
Smoker : Check if the patient is a smoker.
Caeine : Check if the patient has ingested caeine in the past 24 hours.
Alcohol : Check if the patient has ingested alcohol in the past 12 hours.
Sport : Check if the patient has practised sport in the past 24 hours.
Sinus : Check if the ECG is mostly following Sinus Rhytm.
Cardiomyopathy : Check if the patient suers from a known cardiomyopathy.
Hypertension : Check if the patient suers from uncontrolled hypertesion.
Vaso-Vagal : Check if the patient suers from recurrent vaso-vagal syncopal episodes that made him faint.
Depression : Check if the patient suers a depression that is not being
currently under treatment.
Diabetic neuropathy : Check if the patient has received a diagnosis of a
diabetic neuropathy.
Myocardial infarction : Check if the patient has experienced a myocardial infarction in the last year.
Keywords : This part will allow you to associate any other feature
that is not in the ones introduced above so that the researcher does
not loose any relevant information he may want to attach to each
inserted ECG If the word is not on the database, click on the green
cross and a new dialog will allow you to add the desired keywords with
a small description. Then you will be able to relate any new ECG to
that keyword. Removing any keyword from the database is possible,
but doing so will also delete any relationship between any other ECG
to that keyword.
To import an ECG, you need to have the data in a (CSV (Comma Separated Values )) le using the following format: each value will represent the
voltage output for the ECG at the specied time position. The time will
4.4. ECG Search
21
be recreated with the sampling frequency (Fs ). Once the data follows the
restricted format, click on the folder button and select the le location. ITs
contents will be loaded and ready to be stored at the database.
When all the desired inputs are lled and the ECG has been succesfully
loaded, the user will be able to save and insert a new one or to detect the
RR intervals in order to perform the HRV analysis. If the user decides not
to perform RR analysis, this option will be available selecting in the search
mode the ECG and clicking on RR analysis. Note that a specic ECG can
be hard to distinguish from others except for its identication number, so we
strongly reccomend detecting the RR intervals and subsequent HRV analysis
right after the ECG insertion. In this way, HRV parameter will be stored
along with the ECG data and related information.
There are two more options we have not mentiones yet: Reset elds and
Main menu. The rst one will roll back all elds to its default value while the
second one will return to the last menu without saving any changes made to
the information.
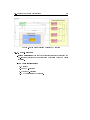
4.4. ECG Search
Once the user has logged in, he will be able to search any of the inserted
ECGS by selecting Search ECG option in the main menu; then a window
like shown in Figure Figure 4.3 will be displayed.
Figure 4.3: Search ECG Frame
22
Chapter 4.
ECG2HRV User Guide
In the frame we can observe a top panel, where all the possible actions
are displayed, a white table where search results will be displayed, and a
tabbed panel with ltering options for the search. The rst one allows the
following actions:
Search : Perform the search on the database using as lter the currently
selected options. If nothing is in the lter, the full database will be
displayed.
New Search : Selecting this action will reset all the search parameters
to its default value and erase previous results.
Modify : If a search has been performed, and an ECG has been selected
in the table, this will show a frame that will let the user modify any of
the chosen ECG properties.
Open ECG : As with modify, if a search has been performed, and an
ECG has been selected in the table, a new window will appear displaying the stored signal and the NN intervals. In case the NN intervals
were not detected before, an automatic process will do it.
Delete : This will delete the currently selected ECG on the table from
the database.
HRV Report : This click will show detailed information of the HRV
parameters for the selected ECG in the table. If no NN detection was
made for this record, RR detection will be performed and shown to the
user.
Exit : This action will close Search Frame and show again the main
menu.
HRV Report : This option will allow the user to export the results of
the search along with all the ECG properties, except for the ECG data,
to a CSV le.
The middle table can be reordered by clicking on any of the headers. It also
allows selection of any of the visible rows so that operations like modify or
HRV report generation can be done on that chosen record.
The tabbed panel at the bottom allows the user to lter the search by
changing any of the elds. Every eld is deactivated by default so that the
search has no lters. To enable a particular eld just click on it and set its
value. If it is an input eld like age, click on the button on its left to activate
or deactivate it. To set HRV analysis parameter ltering click on the HRV
Analysis parameter tab and set the desired values. All changed properties
will be included for the search. This means that all elds that haven't got its
default value will be concatenated in the search with conjunctive condition
(AND) except for the keywords, which follow disjunction (OR) logic.
4.5. RR Detection
23
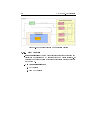
4.5. RR Detection
When inserting an ECG or after a search, the user can select the option
to view RR intervals. A window like the one shown at Figure 4.4 will appear.
The window is composed by a top option panel and a Graph displaying
selected ECG data and the obtained RR intervals. The upper panel allows
the following options:
Previous Misdetection : Clicking this action will navigate through the
graph to display the previous miss-detection or ectopic beat.
Next Misdetection : Same as the option above but showing the next
one.
Save Changes : Use this button to store in the database the changes
made to the NN detection.
Reset RR detection : This procedure runs the default RR-detection al-
gorithm disregarding any performed modications. The data will not
saved until Save button is clicked.
HRV report : Shows the HRV report for current NN intervals.
Rollback : RR intervals will be reseted to las stored value on the database.
Back : Returns to the search frame.
The graph under the top panel allows visualizing ECG's RR and NN
intervals overlaying its signal using red and green rectangles with its duration
as height value. Modication of the beginning and end of the intervals is
allowed by clicking on the desired R peak and dragging it to the new position.
If the dragging process ends near another RR interval, the selected peak will
disappear. Clicking on a segment far enough from any R-peak will create a
new R-peak detection where the user releases the mouse if it is in between
the previous and the next R-peak and far enough from both.
After doing any changes, do not forget to press on save in order to permanently store the modied detections.
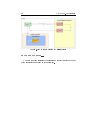
4.6. HRV analysis
Once the user has logged in, he will be able to search any of the inserted
ECGs by selecting Search ECG option in the main menu; then a window
like the one shown in Figure 4.5 will be displayed.
24
Chapter 4.
ECG2HRV User Guide
Figure 4.4: RR detection Frame
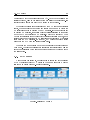
HRV Analysis window displays the results obtained from the process
described in Chapter 3. The power spectrum density is shown on the top
left chart while the LF to HF ratio is on the bottom left one. Time domain
results and frequency domain parameters are displayed on the right side of
the window.
4.7. Utilities
Some database options are available through the Utilities option of the
main menu. A window like the one illustrated in Figure 4.6 will be displayed.
Two options are available: Change passwod and Compact database.
4.7.1.
Change password
This option permits the user to set a password of his choice. We strongly
recommend to do this after the installation or wherever the integrity of such
key is not ensured. A window like displayed in Figure 4.7 will appear in the
screen.
4.7.2.
Compact database
After several modications or deletions database size may increase considerably. This option will compress the information to reduce the size that
is occupied by that information. It is recommended to do it from time to
In the next chapter. . .
25
Figure 4.5: HRV Analysis Frame
time or after big database changes. It does not take a long time to execute
and it may improve its integrity.
In the next chapter. . .
This chapter may be useful for users of the application, but developers
require much more information than a simple guide. The next chapter will
explain he architecture of the application so that the coder is willing to
modify this piece of software byto adding a new feature or improving it, he
won't face to a hard task.
26
Chapter 4.
ECG2HRV User Guide
Figure 4.6: Utilities Frame
Figure 4.7: Change Password Frame
Chapter 5
Architecture
Structure is one of the things that I
always hope will reveal itself to me.
Richard Russo
This section will describe the architecture the application
has followed and its relations following UML notation and standard
diagrams.
Abstract:
5.1. Overview
This chapter is not intended to explain how the project was developed,
but to detail its functionalities and inner structure. The purpose is to relieve
the diculty of modifying this program for unknown coders.
First we will introduce the denitions of several concepts that will be
used during this section. Then the Use Case section will describe each of
the implemented functionalities at a high concept level. Next section will
deal with applications's data model and last part will describe ECG2HRV
component architecture and the relations that each module has.
5.2. Denitions
5.2.1.
Use Case
Fragment of functionality of the system that enables the user to perform
an important action in the application. They are detailed in the Use Case
Document.
27
28
5.2.2.
Chapter 5.
Architecture
Class Domain
Description of the structure of ojects that the program uses to exchange
and store information, as well as their connections, associations, and compositions. It is represented by a Diagram class in UML 2.5.
5.2.3.
Architecture
Essential organization of a system, expressed in its components, the relations between them in the application environment and the principles that
guide his design and evolution.
5.2.4.
Component Diagram
Visual depiction of the relations that a component has with the rest of
the architecture using UML 2.5 standards.
5.2.5.
Use Case Diagram
Visual depiction of the segmented functionalities of an application following UML 2.5 standards.
5.2.6.
Model View Controller
MVC refers to the software architecture pattern that divides the visualization from the control agents and the data model used within the application. This structure separates each component in dierent parts so that can
be reused and easily modied to correct bugs or to integrate new features.
5.3. Use Case Document
This section will explain the functionality of the application dividing each
part in Use Cases. The general overview is shown in Figure 5.1. There are
two possible actors, a Validated user, this is the one that has already logged
in, and the rest. A normal user beccomes validated when successfully inputs
the proper identcation.
In general, the application Use Cases allow insertion, modication, search,
deletion of the data the applicaiton stores. The second functionality is to
permit automatic HRV analysis, which needs NN-Interval detection. We also though that visualization could be useful to gain the trust of the users by
showinf them what is being done and included it as requirement.
The following subsections will present each Use Case with more detail.
Each part will contain a brief description to explain its functionality and
5.3. Use Case Document
29
importance, event ow ennumeration, special requirements, preconditions,
and postconditions.
Figure 5.1: Global Use Case diagram
5.3.1.
Login
Brief Description:
this Use Case encapsulates the functionality required to start the application and make sure that the user is the
owner of the data contained in the persistence by validating with a
password dialog or other methods. IT is also responsible for starting
the required components that will make the application work after its
identity success.
Event ow ennumeration:
1. The application starts and shows an input dialog
2. The application receives correct input and validates the user
30
Chapter 5.
Architecture
3. The application start the next component to show program options and closes the login dialog.
Alternate event ow enumeration:
1. The application starts and shows an input dialog
2. The application receives wrong input and validates the user
3. If it is not the third try, the application will let the user validate
again, if it is the third program will terminate execution.
Special requirements: the user must have Java Virtual Machine installed in order to launch.
Preconditions: User must know the password
Postconditions: If successful, the actor User will mutate to Validated
User and start the next module and the database model interface.
5.3.2.
Exit
Brief Description: this Use Case describes how to exit and what to
do depending upon the actor that requests this feature.
Event ow ennumeration:
1. User requests exit.
2. Program closes visualization and terminates.
Alternate event ow enumeration:
1. Validated User requests exit.
2. Database gets shut down.
3. Program closes visualization and terminates.
Special requirements: None.
Preconditions: Application must be running
Postconditions:
Application will shut down, memory will be freed,
database will be safely closed, and all processes related to ECG2HRV
will be terminated.
5.3. Use Case Document
5.3.3.
31
Search ECG
Brief Description: This Use Case may be the most important feature
of the application. It enables multi-eld cross related search so that
any stored characteristic can be subject to lter the results obtained.
This enables Validated User to nd potential groups with common
markers that may lead to new lines of inquiry. HRV analysis results
and ECG associated information will be responsible for the ltering.
If the parameter is numeric or it can be ordered in time or quantity,
range search with ≥ and or ≤ will be available.
Event ow enumeration:
1. Validated User inputs the desired ltering parameters and requests the search
2. Database performs the search and returns the results
3. Results are visually displayed and record selection is allowed
Alternate event ow enumeration:
1. Validated User inputs the desired ltering parameters and requests the search
2. Database performs the search, but has an error
3. An error dialog is shown to Validated User with a plausible reason.
Special requirements: None.
Preconditions: Being Validated User, connected to the database, and
have a visual interface open to allowing search ltering.
Postconditions: If successful, results for the search will be displayed
and the following new options will be available: modify ECG, delete
ECG, RR detect, HRV analysis.
5.3.4.
Insert ECG
Brief Description: ECG insertion will permit the user to associate an
ECG to the desired characteristics. Default properties will be oered
to ll, but will not be required. Additionally, key words will b available
to create and associate in order to add any other non-static eld.
Event ow enumeration:
1. Visual input is oered to the user
2. Validated User enters the desired associations with the only requirement of correctly imported ECG data.
32
Chapter 5.
Architecture
3. Validated User decides to save and detect RR intervals.
4. Data is saved, Visualization hides, and RR detection is started.
Alternate event ow enumeration:
1. Visual input is oered to the user
2. Validated User enters the desired associations with the only requirement of correctly imported ECG data.
3. Validated User decides to save and enter a new ECG.
4. Data is saved, and state transitions to the rst.
Special requirements: Visual input methods will be oered to simplify this part of the process.
Preconditions: Being Validated User, connected to the database, and
request of the user to insert ECG.
Postconditions: If successful, saves the ECG and oers the next selected option.
5.3.5.
Modify ECG
Brief Description: After an ECG has been inserted the data is stored
in the database. This feature will enable the user to modify that information using a visual interface.
Event ow enumeration:
1. Validated User selects an ECG and requests its modication
2. A new visualization window appears like the one that inserts
ECGs but with the values stored in the database.
3. Validated User changes the desired information and saves.
4. Data is updated and the selected action, back to search or view
RR intervals, is requested.
Alternate event ow enumeration:
1. Validated User selects an ECG and requests its modication.
2. A new visualization window appears like the one that inserts
ECGs but with the values stored in the database.
3. User decides to cancel the modications.
4. Data is not saved, visualization is closed and the program goes
back to the previous window.
Special requirements: Being Validated User.
5.3. Use Case Document
33
Preconditions:
A uniquely identied ECG that still exists in the
Database, and the request of the user to modify it.
Postconditions: If successful, update the database content with the
input.
5.3.6.
Delete ECG
Brief Description:
This feature will enable the permanent removal
of any inserted ECG from the database.
Event ow enumeration:
1. Validated User selects an ECG and requests its deletion.
2. Its content gets successfully deleted from the persistence.
Alternate event ow enumeration:
1. Validated User selects an ECG and requests its deletion.
2. An error message is shown to the user and application continues
its run. ECG reamins recorded in dataabse.
Special requirements: Being Validated User
Preconditions:
A uniquely identied ECG that still exists in the
Database, and the request of the user to delete it.
Postconditions: If successful, deletes the selected ECG from the presistence.
5.3.7.
Import ECG
Brief Description: This characteristic will be responsible of importing ECG data from the selected source.
Event ow enumeration:
1. Validated User selects ECG le data location from any operating
system drive disk and inputs sampling rate.
2. The program veries the format of the le and imports its data.
Alternate event ow enumeration:
1. Validated User selects ECG le data location from any operating
system drive disk.
2. The program fails to validate le format.
3. An error message is shown to Validated User
34
Chapter 5.
Architecture
Special requirements: Being Validated User
Preconditions: Being inserting or modifying an ECG record. Having
a CVS le with the required format, this is, sampled voltage values
separated by commas and the knowledge of the recording sampling
rate.
Postconditions: If successful, adds data content from the le to the
current ECG model. Data will not be stored until save Use Case is
selected.
5.3.8.
DetectRR
Brief Description: This functionality will enable automatic detection
of RR-Intervals and its classications as normal (NN) or not normal.
Event ow enumeration:
1. Validated User requests RR-interval detection for a particular
ECG from Search or new Insert.
2. The program checks that ECG has no RR-Interval detection stored
in database and performs it
3. RR-detection is saved to the database and displayed andmodication of RR-inervals is called.
Alternate event ow enumeration:
1. Validated User requests RR-interval detection for a particular
ECG from Search or new Insert.
2. The program checks that ECG has already an RR-Interval detection stored in database
3. RR-detection is retrieved and ,odication of RR-inervals is called.
Special requirements: Being Validated User
Preconditions: Being inserting or modifying an ECG record. ECG
data and Sampling rate is known.
Postconditions: RR detection is made and stored in database if needed. A -ew window is then shown allowing its modication.
5.3.9.
Modify RR-detection
Brief Description: This option will oer the required visual tools to
modify the detections obtained to correct possible miss detections.
Event ow enumeration:
5.3. Use Case Document
35
1. User request RR-interval detection
2. When it is done a new window appears with a chart containing
ECG data.
3. User presses the mouse left button near the beginning or the end
of an interval inside the chart.
4. RR interval is modied where the user releases the mouse. If the
mouse is further away than previous or next RR interval, the R
peak disappears and the new RR interval is considered to be from
past RR interval to the next.
Alternate event ow enumeration:
1. User request RR-interval detection
2. When it is done a new window appears with a chart containing
ECG data.
3. User presses the mouse left button far enough from any interval
extreme inside the chart.
4. RR interval is modied where the user releases the mouse. If the
mouse is released far enough from previous and next intervals, a
new RR interval is created.
Special requirements: Being Validated User
Preconditions: Having an ECG with the RR-interval detection done.
Postconditions:
Modicacions on the RR-Interval detection will be
stored to the data model. This will not permanently save information,
clicking the save RR option will be required.
5.3.10.
Save RR-detection
Brief Description:
This feature brings the possibility of saving the
RR-detection after any modication made.
Event ow enumeration:
1. User request to save RR-interval detection
2. RR detection is saved in the database
3. An information message is displayed to the user saying that it
was successfully saved.
Alternate event ow enumeration:
1. User request to save RR-interval detection
2. RR detection fails to be saved in the database
36
Chapter 5.
Architecture
3. An error message is displayed to the user saying what happened.
Special requirements: Being Validated User
Preconditions: Having an ECG with the RR-interval detection done.
Postconditions:
Modicacions on the RR-Interval detection will be
stored to the database permanently.
5.3.11.
HRV Analysis
Brief Description: This is the second most important Use Case of
the application. It is responsible for converting the NN-intervals from
the RR-detection to HRV parameters in time and frequency domain
using the techniques explained in Chaptter 3.
Event ow enumeration:
1. User request HRV analysis for an already RR-Interval detected
ECG
2. Program runs required algorithms to obtain time and frequency
parameters.
3. Results are displayed with charts and text inside a new a frame
Alternate event ow enumeration:
1. User request HRV analysis for an ECG without RR-detection
made.
2. RR detection Use Case is executed for that algorithm
Special requirements: Being Validated User
Preconditions: Having an ECG from the database selected.
Postconditions: HRV is done if RR-detection is too.
5.3.12.
Save HRV Analysis
Brief Description: This feature allows to store calculated HRV parameters in the database
Event ow enumeration:
1. HRV analysis is performed on an ECG.
2. data is saved in the database.
Alternate event ow enumeration:
5.3. Use Case Document
37
1. HRV analysis is performed on an ECG.
2. data fails to save in the database.
3. An error message is shown with the reason of failure.
Special requirements: Being Validated User
Preconditions: Having an HRV analysis performed on an ECG stored
in the database.
Postconditions:
if successful, HRV analysis is associated to the selected ECG permanently.
5.3.13.
Change Password
Brief Description: This feature permits to change the current password of encryption and access for the database.
Event ow enumeration:
1. Validated user inputs correct old password and a new alphanumeric chain bigger than eight characters.
2. Database password is changed to the new password
Alternate event ow enumeration I:
1. Validated user inputs incorrect old password and a new alphanumeric chain bigger than eight characters.
2. Database password is not changed and a message is shown
Alternate event ow enumeration II:
1. Validated user inputs correct old password and a new alphanumeric chain bigger than eight characters.
2. Database password fails to change
3. An error message is shown with the reason of failure.
Special requirements: Being Validated User. Having enough memory to remember a new password.
Preconditions: Know the new password
Postconditions: if successful, password is changed
38
Chapter 5.
5.3.14.
Architecture
Compact Database
Brief Description: This feature allows to compress the database in
order to safe disk space. Persistence may span more size than required
after severe changes like modication of ECG data or deletions.
Event ow enumeration:
1. Validated user requests compression.
2. Database is compressed
3. Information dialog is displayed with a message of success.
Alternate event ow enumeration
:
1. Validated user requests compression.
2. Database fails to compress compressed
3. Error message is displayed with failure reason.
Special requirements: Being Validated User.
Preconditions: None.
Postconditions: if successful, database size is reduced to its minimum.
5.4. Data Model
Every application uses data storage in order to work. Some static programs rely in volatile memory because they do not require permanent storage, but this is not our case. ECG2HRV needs to record ECG information
as well as its signal and other data in the disk so that they can be queried
and accessed later.
In rst place we will describe the structure that ECG2HRV handles, this
is its class domain. In Figure X and Figure Y all the classes and its relations
are represented using a class Diagram. The following subsection will explain
the use and importance of each illustrated object.
5.4.1.
Class Description
ChangePassword: Stores the value of the old and new password in
an array of characters so that the contained information can be safely removed after use. Be aware that strings are deleted using JAVA
garbage collector and may remain in memory until they are no longer
needed and other object overwrites its content.
5.4. Data Model
39
Serializable
RRDetection
Serializable
ECGData
-
Fs: double
time: double ([])
value: double ([])
+
+
+
+
+
+
+
+
+
+
ECGData(double[], double[], double)
ECGData()
getTime() : double[]
getValue() : double[]
isEmpty() : boolean
loadObject(InputStream) : void
recalculateTime() : void
saveObject(String) : void
setTime(double[]) : void
setValue(double[]) : void
setValues(double[], double[]) : void
«property get»
+ getFs() : double
-
duration: List<Double>
from: List<Integer>
normal: List<Boolean>
to: List<Integer>
+
+
+
+
+
+
+
+
+
+
+
+
+
+
getDuration() : List<Double>
getFrom() : List<Integer>
getNormal() : List<Boolean>
getNormalDurations() : double[]
getTo() : List<Integer>
getTotalCorrectDuration() : double
loadObject(InputStream) : void
RRDetection()
RRDetection(List<Integer>, List<Integer>, List<Double>, List<Boolean>)
saveObject(String) : void
setDuration(List<Double>) : void
setFrom(List<Integer>) : void
setNormal(List<Boolean>) : void
setTo(List<Integer>) : void
«property set»
+ setFs(double) : void
-rrIntervals
-data
ECG
Serializable
HRVAnalysys
-
frequency: double ([])
HF: double
HFNorm: double
LF: double
LFHFRatio: double
LFNorm: double
NN50Count: int
pNN50: double
RMSSD: double
SDNN: double
SDSD: double
spectrum: double ([])
VLF: double
+
+
+
+
+
+
getFrequency() : double[]
getSpectrum() : double[]
HRVAnalysys(double, double, double, int, double, double, double, double, double, double, double)
HRVAnalysys()
setFrequency(double[]) : void
setSpectrum(double[]) : void
data: ECGData
ecgInfo: ECGInfo
hRVAnalysis: HRVAnalysys
keywords: List<KeyWord>
rrIntervals: RRDetection
+
+
+
+
+
+
+
+
+
+
ECG(ECGInfo)
getData() : ECGData
getEcgInfo() : ECGInfo
getKeywords() : List<KeyWord>
getRrIntervals() : RRDetection
setData(ECGData) : void
setEcgInfo(ECGInfo) : void
setKeywords(List<KeyWord>) : void
setRrIntervals(RRDetection) : void
setValues(Double[], Double[]) : boolean
«property get»
+ gethRVAnalysis() : HRVAnalysys
«property set»
+ sethRVAnalysis(HRVAnalysys) : void
«property get»
+ getHF() : double
+ getHFNorm() : double
+ getLF() : double
+ getLFHFRatio() : double
+ getLFNorm() : double
+ getNN50Count() : int
+ getpNN50() : double
+ getRMSSD() : double
+ getSDNN() : double
+ getSDSD() : double
+ getVLF() : double
«property set»
+ setHF(double) : void
+ setHFNorm(double) : void
+ setLF(double) : void
+ setLFHFRatio(double) : void
+ setLFNorm(double) : void
+ setNN50Count(int) : void
+ setpNN50(double) : void
+ setRMSSD(double) : void
+ setSDNN(double) : void
+ setSDSD(double) : void
+ setVLF(double) : void
-
-hRVAnalysis
ECGSearch
-analysisFrom
ECGSearch
-analysisTo
KeyWord
-
description: String
id: int
value: String
+
+
+
+
+
+
+
+
+
+
equals(Object) : boolean
getDescription() : String
getId() : int
getValue() : String
hashCode() : int
KeyWord(int, String, String)
setDescription(String) : void
setId(int) : void
setValue(String) : void
toString() : String
Figure 5.2: Class Domain First part
40
Chapter 5.
ECGInfo
ECG
-ecgInfo
ECGSearch
-
age: int
alcoholPasdt12h: boolean
caffeinePast24h: boolean
cardiomyopathy: boolean
dateImported: Date
diabeticNeuropathy: boolean
exercisePast24h: boolean
heartFailure: HeartFailure
hypertension: boolean
id: int
male: boolean
mitralValveProlapse: MitralValveProlapse
recentMyocardiacInfarction: boolean
recurrentVasoVagalSincopalEpisodes: boolean
sinusRhythm: boolean
smoker: boolean
untreatedDepression: boolean
+
+
+
+
+
+
+
+
+
+
+
+
+
+
+
+
+
+
+
+
+
+
+
+
+
+
+
+
+
+
+
+
+
+
+
ECGInfo()
getAge() : int
getDateImported() : Date
getHeartFailure() : HeartFailure
getId() : int
getMitralValveProlapse() : MitralValveProlapse
isAlcoholPasdt12h() : boolean
isCaffeinePast24h() : boolean
isCardiomyopathy() : boolean
isDiabeticNeuropathy() : boolean
isExercisePast24h() : boolean
isHypertension() : boolean
isMale() : boolean
isRecentMyocardiacInfarction() : boolean
isRecurrentVasoVagalSincopalEpisodes() : boolean
isSinusRhythm() : boolean
isSmoker() : boolean
isUntreatedDepression() : boolean
setAge(int) : void
setAlcoholPasdt12h(boolean) : void
setCaffeinePast24h(boolean) : void
setCardiomyopathy(boolean) : void
setDateImported(Date) : void
setDiabeticNeuropathy(boolean) : void
setExercisePast24h(boolean) : void
setHeartFailure(HeartFailure) : void
setHypertension(boolean) : void
setId(int) : void
setMale(boolean) : void
setMitralValveProlapse(MitralValveProlapse) : void
setRecentMyocardiacInfarction(boolean) : void
setRecurrentVasoVagalSincopalEpisodes(boolean) : void
setSinusRhythm(boolean) : void
setSmoker(boolean) : void
setUntreatedDepression(boolean) : void
-
-info
-mitralValveProlapse
id: int
value: String
+
+
+
+
+
+
+
+
equals(Object) : boolean
getId() : int
getValue() : String
hashCode() : int
MitralValveProlapse(int, String)
setId(int) : void
setValue(String) : void
toString() : String
ageFromEnabled: boolean = false
ageTo: int
ageToEnabled: boolean = false
alcoholPasdt12hEnabled: boolean = false
analysisFrom: HRVAnalysys
analysisTo: HRVAnalysys
caffeinePast24hEnabled: boolean = false
cardiomyopathyEnabled: boolean = false
dateImportedFromEnabled: boolean = false
dateImportedTo: Date
dateImportedToEnabled: boolean = false
diabeticNeuropathyEnabled: boolean = false
exercisePast24hEnabled: boolean = false
heartFailureEnabled: boolean = false
HFFromEnabled: boolean = false
HFNFromEnabled: boolean = false
HFNToEnabled: boolean = false
HFToEnabled: boolean = false
hypertensionEnabled: boolean = false
info: ECGInfo
LFFromEnabled: boolean = false
LFHFRatioFromEnabled: boolean = false
LFHFRatioToEnabled: boolean = false
LFNFromEnabled: boolean = false
LFNToEnabled: boolean = false
LFToEnabled: boolean = false
maleEnabled: boolean = false
mitralValveProlapseEnabled: boolean = false
NN50CountFromEnabled: boolean = false
NN50CountToEnabled: boolean = false
noHRVAnalysis: boolean = false
pNN50FromEnabled: boolean = false
pNN50ToEnabled: boolean = false
recentMyocardiacInfarctionEnabled: boolean = false
recurrentVasoVagalSincopalEpisodesEnabled: boolean = false
RMSSDFromEnabled: boolean = false
RMSSToEnabled: boolean = false
SDNNFromEnabled: boolean = false
SDNNToEnabled: boolean = false
SDSDFromEnabled: boolean = false
SDSDToEnabled: boolean = false
sinusRhythmEnabled: boolean = false
smokerEnabled: boolean = false
untreatedDepressionEnabled: boolean = false
VLFFromEnabled: boolean = false
VLFToEnabled: boolean = false
words: List<KeyWord>
ChangePassword
MitralValveProlapse
-
Architecture
-
newP: char ([])
oldP: char ([])
+
+
+
ChangePassword(char[], char[])
getNewP() : char[]
getOldP() : char[]
HeartFailure
-heartFailure
-
id: int
value: String
+
+
+
+
+
+
+
+
equals(Object) : boolean
getId() : int
getValue() : String
hashCode() : int
HeartFailure(int, String)
setId(int) : void
setValue(String) : void
toString() : String
Figure 5.3: Class Domain second part. ECGSearch does not show any of its func-
tions in order to be able to t in this page.
5.4. Data Model
41
ECG: This class represents the core of class domain. It stores the value
of a single ECG record. It contains an ECGInfo object as well as a list
of keywords representing the associations of that particular ECG to
clinical or other features. This object also stores the value of the raw
ECG, RR-detection and HRVAnalysis. If any of those have not been
made yet, its value will be null.
ECGData:
This container will store the raw ECG data. It contains
two array of double with the time and the values for each sampling
point. It is serializable, this means than can be easily saved in JAVA
object format. This was implemented in order to store the full ECG in
the database in a single record instead of thousands. By doing that, we
prevent database size from growing exponentially and permit accessing
data faster too. Time is not saved in the database in order to occupie
less space. Instead, it is recreated from the sampling frequency starting
by zero.
ECGInfo: Contains all relevant medical characteristics detailed in the
Userguide section4.3.
ECGSearch:This class was created so that all the search ltering variables where included in a single class. It contains an ECGInfo variable
for the value of default properties, two HRVAnalysis items to store the
value of ≥ and ≤ parameters. A list of keywords with no length restriction is also included for the search. The rest of boolean variables
are indicators of whether the represented value is going to be used for
the search or not.
HeartFailure: Class representing the dierent values of heart failures
following NYHA convention.
HRVAnalysis: This class will store the results of the Heart Rate Variability analysis in time and frequency domain.
KeyWord: Represents the associations the doctor want to include for
and ECG but is not able to because it is not included by default in its
properties.
MitralValveProlapse:Object representing the dierent stages of Mitral Valve Prolapse.
RRDetection: This class contains the information required to recre-
ate the RR-Interval detection done by the application and probably
modied by the user. As in the case of ECGData, this class implements serializable for eciency reasons
42
Chapter 5.
5.4.2.
Architecture
Database implementation
Relational databases oer exceptional characteristics for data storage including security, information coherency, ease of use, and many other properties. We decided to use this paradigm so that searches could be executed rapidly and to avoid dealing with information corruption. Relational
database operations are usually subject to good properties such as ACID,
which stands for Atomicity, Consistency, Isolation, and Durability.
Between all the available options we chose Apache Derby database for
its embeddable simplicity, which frees the user form installing third party
software, and for its easy encryption properties.
Database normalized model is shown in Figure 5.4. As we explained
in last section, ECGData and ECGInfo are stored as objects in a BLOB
(Binary Large Object) eld to accelerate queries and updates as well as to
reduce database size. Our rst approach was to create a separate table with
ECGData and its values, but after some runs, we observed t hat the size was
increasing too fast. In fact, it was more than a hundred times bigger than it
is now. Same happens with RRDetection.
The result is a simple model with three tables that is ecient in disk
usage. Even though, compression could be made in the serialized object in
order to reduce more object space. We left this feature to be developed in
future versions.
5.5. Visual Component Architecture
So far, we have explained what functionalities we require and what structure the utilized information has, but we still need to implement Use Cases
from their abstract denition to well-dened components.
As we mentioned in the begging of the chapter, the MVC paradigm has
guided our steps for the implementation. The visual part is separated from
the control so that it could be easily modied, improved or replaced without
the need of rewriting the controller or vice-versa.
Visual Components follow the structure illustrated in Figure 5.5. Each
visualization will have dierent implementations based on its needs. They
are composed by the following objects:
Communication: This class is the link between the graphic content
and control. Any important operation must be called by using this
object functions. We would like to remark that this class does not
5.5. Visual Component Architecture
Figure 5.4: Database Schematic Diagram
43
44
Chapter 5.
Architecture
contain any information on how to do anything, it just has a link
to the control interface that is used as communication mechanism to
access its functionality. It is on the root package of each visualization
resource.
Visualization Interface: This object will contain the functions that
the Visualization will require to implement. This interface is used by
the control agent to interact with the visualization. It is under the
package imp of each visualization.
Visualization implementation: This class is responsible for implementing all the functions dened in the Visualization Interface. It will
also initialize the required resources.
Resources: Final implementation for the visualizations. In this cate-
gory lay all designed frames, panels, dialogs, or any other visual component that the visualization requires. It is under the package imp.gui
of each visualization.
We will not describe each of the implemented visual components. Our
reason for this behavior is that visualization is subject to current component
library, functionality, and developer Dependant. Instead, we will focus on
explaining control agents and their interactions and requirements, which are
less likely to change.
5.6. Control Component Architecture
45
Figure 5.5: Visualization component model
5.6. Control Component Architecture
The Use Cases described in this chapter at section 5.3 have been implemented with the following components:
5.6.1.
Login
Brief Description: This component is responsible for initializing database
Component interface and Main Menu upon successful login.
Use Cases implemented:
Login
2. Exit : User
1.
46
Chapter 5.
Architecture
Figure 5.6: Component Diagram of Login control
5.6.2.
Main Menu
Brief Description: This component is responsible for giving the us-
er the option to start any of the three following options: InsertECG,
SearcECG, or Utilities. It also initializes those components and gives
the interfaces they require. It needs a Validated User so that database
is connected and can perform any search in the rest of the components.
Use Cases implemented:
InsertECC : Just the request part.
2. SearchECC : Just the request part.
3. Utilities : Just the request part.
4. Exit : Validated User
1.
5.6. Control Component Architecture
47
Figure 5.7: Component Diagram of Main Menu control
5.6.3.
Insert ECG
Brief Description: This component is responsible for giving the user
the option to InsertECG or ModifyECG. successful login. The component requires Search ECG in order to go back to the same search upon
modication completion.
Use Cases implemented:
InsertECC
2. ModifyECG
3. DetectRR : just the request part.
1.
48
Chapter 5.
Architecture
Figure 5.8: Component Diagram of InsertECG control
5.6.4.
Search ECG
Brief Description: This component is responsible for giving the user
the option to SearchECG and any related ECG selection action.
Use Cases implemented:
1.
2.
3.
4.
5.
6.
SearchECG
ModifyECG : just the selection and request.
DeleteECG
ModifyECG : just the selection and request.
HRVAnalysis : just the selection and request.
DetectRR : just the selection and request.
5.6. Control Component Architecture
49
Figure 5.9: Component Diagram of SearchECG control
5.6.5.
RR-Detection
Brief Description: This component is responsible for performing the
RR-Interval detection and enabling its modication through a visual
interface.
Use Cases implemented:
DetectRR
2. Save RR-detection
3. Modify RR-detection
4. HRVAnalysis : just the request.
1.
50
Chapter 5.
Architecture
Figure 5.10: Component Diagram of RRDetection control
5.6.6.
HRV Analysis
Brief Description: This component is responsible for performing and
displaying the results of HRV analysis through a visual interface. It
contains the implementation of the signal processing Section described
in Chapter 3.
Use Cases implemented:
HRVAnalysis
2. Save HRVAnalysis
1.
5.6. Control Component Architecture
51
Figure 5.11: Component Diagram of HRV Analysisl control
5.6.7.
Utilities
Brief Description: This component is responsible for allowing database
utilities to be requested and performed. The only two options alowed
are database compression and password changing.
Use Cases implemented:
Change Password
2. Compact Database
1.
52
Chapter 5.
Architecture
Figure 5.12: Component Diagram of Utilities control
In the next chapter. . .
The enxt chapter will present the results and depict the state of the art
of the application compared to other software.
Chapter 6
Discussion
Don't fear failure so much that you
refuse to try new things. The saddest
summary of a life contains three
descriptions: could have, might have, and
should have.
Louis E. Boone
This section will summarize what objectives we have
obtained with ECG2HRV and suggest future lines of work that could
improve what has being developed.
Abstract:
ECG2HRV brings a new paradigm in HRV research eld that may seed
new ideas for time and frequency domain parameter correlation for clinical
diagnosis. This feature reliefs the user from the heavy task of carrying about
storage format while enabling same functionalities other programs have in a
single binary. This is not the rst application that is conceived to calculate
HRV. A web survey conducted reveals that ECG2HRV is the only one that
allows ECG information to be related to HRV analysis, while oering automatic calculation of required information within a single interface. Next we
will discuss some examples supporting these statements.
HRV Toolkit (Goldberger et al., 2000): The application from Physionet
is composed by a set of C les that permit obtaining HRV analysis
using the command line in time and frequency domain from MIT-BIH
database les. Its interface is complicated to handle and many potential
users are discouraged by this fact. If we add the point that it does not
oer any system to store ECGs we realize that ECG2HRV is far more
useful.
53
54
Chapter 6.
Discussion
LabView HRV Analysis (XU et al., 2003) : The application from National Instruments has a rich visual and easy to use interface with
comprehensive on line tutorials. The shortcoming is that it does not
allow to store ECGs nor to associate them with patient background.
Our application may not have some of the functionality oered here like
SDNN graph correlation yet, but our data structure makes ECG2HRV
more powerful and comfortable for the user by giving away some parameter analysis in exchange of patient background association. It is
also subject to be used by buying the required software while our solution is free and open source.
Software for advanced HRV analysis (Niskanen et al., 2004): This C
application includes visual libraries and has same functionality as (XU
et al., 2003). It lacks from the same database characteristic explained
before and may not be compiled to work an dierent operating systems.
Kubios HRV (Tarvainen et al., 2009): This software is an easy to use
HRV report generator. It is useful to get isolated ECG reports, but not
to be used as daily basis. It works under Linux/GNU and Windows,
but not under Mac computers.
Many other applications exist to satisfy HRV calculation and reporting
requirements, but none to relate obtained results to patient background. We
have conceived, designed, and implemented an ECG data management tool,
that permits automatic analysis of HRV allowing modication of RR interval detections due to ectopic beats, noise, or miss-detections. This software
is platform independent so same program is able to run under Windows,
Linux/GNU, Mac, Solaris, or any operating system that is able to run Java Virtual Machine in a desktop platform. The fact of being open source
enables the community to carry on with improvements and additional tools
that could expand its user impact. This condition also makes the application perfect for low budget research give that it is free to use. We hope that
ECG2HRV does not stop growing and that the community will continue
improving its available features.
In the next chapter. . .
55
In the next chapter. . .
Like every day has a night, or every yin has a yang, every beginning has
an end. This chapter nalizes the documentation for the project ECG2HRV.
We hope that its contents have helped you to understand how it works, how
to use it, and how to improve it. The next sections will show the bibliographic references used, the appendix, and a list containing all the acronyms
employed.
References
Y así, del mucho leer y del poco dormir,
se le secó el celebro de manera que vino
a perder el juicio.
Miguel de Cervantes Saavedra
Berger, R. D., Akselrod, S., Gordon, D.
y Cohen, R. J. An ecient algorithm for spectral analysis of heart rate variability. Biomedical
Engineering, IEEE Transactions , vol. 9, páginas 900904, 1986.
Buccelletti, E., Gilardi, E., Scaini, E., LeonardaGaliuto, Persiani, R., Biondi, A.
y Silveri, N. G. Heart rate variability and myocardial infarction: systematic literature review and metanalysis. Eur Rev
Med Pharmacol Sci , vol. 13(4), páginas 29930, 2009.
Camm, A. J., Malik, M., Bigger, J., Breithardt, G., Cerutti, S.,
Cohen, R., Coumel, P., Fallen, E., Kennedy, H., Kleiger, R. et
Heart rate variability: standards of measurement, physiological interpretation and clinical use. task force of the european society of cardiology
and the north american society of pacing and electrophysiology. Circulation , vol. 93(5), páginas 10431065, 1996.
al.
y Ii, L. Jtransform-a java source code transformation framework. Informe técnico, TR 303, Institute for Computer Science,
Wurzburg University, 2002.
Eichelberger, H.
The string galvanometer and the measurement of the action
currents of the heart. Nobel Lecture, December , vol. 11, 1925.
Einthoven, W.
Uses and limitations of electrocardiography in the diagnosis
of acute coronary occlusion: With particular reference to the latency of
changes*. The Yale Journal of Biology and Medicine , vol. 11(6), página
619, 1939.
Geiger, A. J.
Goldberger, A. L., Amaral, L. A., Glass, L., Hausdorff, J. M.,
Ivanov, P. C., Mark, R. G., Mietus, J. E., Moody, G. B., Peng,
57
58
References
y Stanley, H. E. Physiobank, physiotoolkit, and physionet: Components of a new research resource for complex physiologic signals. Circulation , vol. 101(23), páginas e215e220, 2000.
C.-K.
Huikuri, H.
Heart rate variability in coronary artery disease.
internal medicine , vol. 237(4), páginas 349357, 1995.
Journal of
Niskanen, J.-P., Tarvainen, M. P., Ranta-aho, P. O.
y Karjalainen,
Software for advanced {HRV} analysis. Computer Methods and
Programs in Biomedicine , vol. 76(1), páginas 73 81, 2004. ISSN 01692607.
P. A.
Heart rate variability and autonomic diabetic neuropathy.
nutrition & metabolism , vol. 13(6), página 341, 2000.
Pagani, M.
abetes,
Di-
y Tompkins, W. J. A real-time qrs detection algorithm. Biomedical
Engineering, IEEE Transactions , vol. 3, páginas 230236, 1985.
Pan, J.
Pomeranz, B., Macaulay, R., Caudill, M. A., Kutz, I., Adam, D.,
Gordon, D., Kilborn, K. M., Barger, A. C., Shannon, D. C.,
Assessment of autonomic function in humans by
heart rate spectral analysis. American Journal of Physiology-Heart and
Circulatory Physiology , vol. 248(1), páginas H151H153, 1985.
Cohen, R. J. et al.
Tarvainen, M. P., Niskanen, J.-P., Lipponen, J., Ranta-Aho, P.
Karjalainen, P.
y
Kubios hrv-a software for advanced heart rate variabil-
4th European Conference of the International Federation
for Medical and Biological Engineering , páginas 10221025. Springer, 2009.
ity analysis. En
Volterrani,
M.,
Scalvini,
S.,
Colombo, R., Clark, A. L.
Mazzuero,
G.,
Lanfranchi,
P.,
y Levi, G. Decreased heart rate variability in patients with chronic obstructive pulmonary disease. CHEST
Journal , vol. 106(5), páginas 14321437, 1994.
Wu, M.-H., Wang, C.-J., Yang, Y.-K., Wang, J.-S.
y
Chung, P.-C.
Emotional quality level recognition based on hrv. En Neural Networks
(IJCNN), The 2010 International Joint Conference on , páginas 16. IEEE,
2010.
XU, X.-t., LU, G.-w., YI, W.-j.
y ZHOU, W.-b. The application of
labview techniques in hrv research [j]. Chinese Journal of Medical Physics ,
vol. 2, página 020, 2003.
Acronym List
CHF
..........
COPD
........
Congestive Heart Failure
Chronic Obstructive Pulmonary Disease
CSV
..........
Comma Separated Values
ECG
..........
Electrocardiogram
ECG2HRV . . . .
Electrocardiogram to Heart Rate Variability
FDA
..........
US Food and Drug Administration
FFT
..........
Fast Fourier Transform
FT
............
HRV
..........
NYHA
PSD
........
..........
UML . . . . . . . . . .
Fourier Transform
Heart Rate Variability
New York Heart Association Functional Classication
Power Spectral Density
Unied Modeling Language
59
60
References
Autorizo a la Universidad Complutense a difundir y utilizar con nes
académicos, no comerciales y mencionando expresamente a sus autores, tanto la propia memoria, como el código, los contenidos audiovisuales incluso
si incluyen imágenes de los autores, la documentación y/o el prototipo desarrollado.
Fdo: Miguel Ángel Menárguez García