1
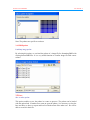
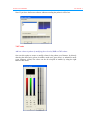
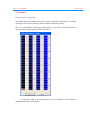
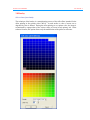
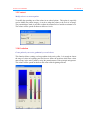
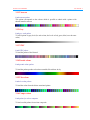
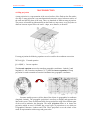
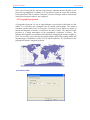
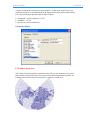
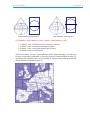
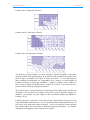
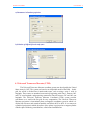
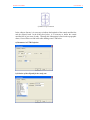
SAVAMER 9.02
©IRD 1998-2005
PALETTE
SAVAMER
9.02
18
Menu - 3
Savamer 9.02 ©IRD/MS
User manual - 3
PALETTE
The software SAVANE contains several types of palettes. A colour can be
expressed in combination levels of red, green, and blue or in levels of cyan, magenta, and
yellow, black or in levels of gray, or levels of brightness, clearness, saturation. If the
palette is active (the set of themes or imagery is displayed in the window in bottom of the
screen SAVANE). The menu offers a series of options making it possible to create or
modify the palette of current colour, as well as certain number of preset palettes which can
be loaded easily.
3.1 Thematic
This option makes it possible to select the palette set of themes which makes
current palette. The palette set of themes contains 122 colours. If you select this palette, all
the operations of handling or layout will use the set of palette themes.
3.2 Imagery
When you select this option, it is the palette imagery which changes into the
standard palette. All the operations of handling or layout will use the palette imagery
except for certain operations which are reserved for the palette set of themes.
Certain layouts use the palette imagery automatically, even if it is not active layout
of a digital model of ground, layout of a satellite image.
3.3 Load
This option makes it possible to load a specific palette. It has two options
•
•
Savane palette
BMP palette
3.4.1 Savane palette
Load or delete an existing savane palette
This enables you to load a palette which already exists. It is enough to select the palette to
be opened to charge it as a current pallet.
Savamer 9.02 ©IRD/MS
User manual - 3
Note: The palettes are specific to each user
3.4.2 BMP palette
Load bmp image palette
By selecting this option, we can load the palette of a image file for formatting BMP with
existing known BMP files. It is a very useful function to visualize image file with correct
colours.
3.5 Save
Save a colour palette
This option enables to save the palette in a name to preserve. The palette can be loaded
with the option load. If another user wants to open the palette, it is necessary to close the
base and after we have to reopen and load it with the name of the other user. He will be
able to record it in their file.
Savamer 9.02 ©IRD/MS
User manual - 3
Note: If you leave the Savane software without recording the palette it will be lost.
3.6 Create
Add new colours in palette by modifying direct levels of RGB or CMY scheme.
One uses this option to create or modify colours in the palette set of themes, by directly
choosing the three basic colours in additive mode (red, green, blue), or subtractive mode
(cyan, magenta, yellow).The colour can also be recopied in another, by using the right
button of the mouse
Savamer 9.02 ©IRD/MS
User manual - 3
3.7 Permute
Permute colours in the palette.
This option makes it possible to permute two colours within the same palette. It is initially
necessary to click on the colour to permute and then click desired colour.
Note: It is preferable to use this option rather than to create when you want to remain in
the same palette without having to seek new colours.
To select the colour to be permuted, then to move towards the color wished by
maintaining the cursor of the mouse
Savamer 9.02 ©IRD/MS
User manual - 3
3.8 Benday
Select colours from benday
The technique of the benday is a manufactoring process of the offset films intended for the
offset printing in four primary inks CMJ+N. At each surface a value of screen one or
degraded by color is allotted. During the offset printing or on a printer color, the image is
reconstituted by superposition of the various values of screen in each primary ink. In the
software Savanna, this option allows only the modification of the pallet set of themes.
Savamer 9.02 ©IRD/MS
User manual - 3
3.9 Contrast
Modify colour in a contrast palette
To modify the spreading out of the colours in an ordered palette. This option is especially
used to modify the palette imagery, in order to adapt the palette to the level of an image.
The potentiometers make it possible to adjust the minimum level and the maximum level.
The colours will be spread out between these two levels
3.10 Gradation
Create palette by successive gradation by several colours
This function allows creating a colour gradation in the active pallet. It is enough to choose
the range of colour at beginning and end, then to define the positions which these colors
must occupy in the active pallet by using the potentiometers of the principal stringcourse.
The colours will be spread out between the colour of the beginning and end.
Savamer 9.02 ©IRD/MS
User manual - 3
3.11 Tetascan
Load tetascan palette
This palette corresponds to the colours which is possible to obtain with a printer with
thermal transfer tetascan
3.12 Grey
Load grey scale palette
To load a palette in gray level (for each colour, the levels of red, green, blue, have the same
value)
3.13 NTSC
Load NTSC palette
To load the palette of the Normal
3.14 Pseudo colour
Load pseudo colour palette
To load the palette pseudo-colour that resembles like rainbow in sky
3.15 Tele colour
Load tele colour palette
To load the colour from the below mentioned palette
3.16 Compo colour
Load palette for colour composite
To load a useful palette from colour composite
SAVAMER 9.02
©IRD 1998-2005
Map projections
SAVAMER 9.02
Menu - 4
Savamer 9.02 ©IRD
User manual - 5
MAP PROJECTION
4.0 Map projection
A map projection is a representation of the curved surface of the Earth on the flat surface
of a map. A map projection is any transformation between the curved reference surface of
the earth and the flat plane of the map. There are hundreds of different map projections.
The process of transferring information from the Earth to a map causes every projection to
distort at least one aspect of the real world – shape, area, distance, or direction
For map projection the following equations are to be used for the coordinate conversion.
X, Y = f (j, l)
Forward equation
j, l = f (X,Y )
Inverse equation
The forward equations are used to transform geographic coordinates - latitude (j) and
longitude (l) - into Cartesian coordinates (X, Y), while the inverse equations of a map
projection are used to transform Cartesian coordinates into geographic coordinates
Savamer module preserves all the data of the objects in geographical co-ordinates
(longitude, latitude). The geographic projection is necessary to display and represent the
data on the screen. There are different kinds of map projections using in the different parts
of the world to minimise the distortion. The menu projection allows us to choose the
projection which we need. SAVANE has several types of projections to use which are
Geographical, Mercator, Lambert and UTM. These projections cover the whole of the
needs for representation with average and great scales.
Savamer 9.02 ©IRD
User manual - 5
In the case of image data the selection of projection is important because the data are not
preserved in geographical co-ordinates. If it is possible to represent vector data according
to the projections UTM or Lambert or Mercator, a mosaic of images could be restored only
in the plan of projection where it was readjusted.
4.1 Geographic projection
A Geographic projection is a way of representing the curved surface of the Earth on a flat
surface as a projection onto rectangular lines of latitude and longitude. The common
coordinate system widely in use is Geographic Coordinate System, which uses degree of
latitude and longitude to describe a location on the earth’s surface. The adoption of this
projection is a simple transcription of the geographical co-ordinates in meters. The
latitudes and longitudes are transformed into meters by multiplying the minutes roughly by
1852. It is not really a projection, but the graphical figure obtained by plotting latitude and
longitude degree coordinates as if they were Y and X coordinates. It is also known as the
geographical latitude / longitude projection.
a).Central meridian
Savamer 9.02 ©IRD
User manual - 5
A degree of longitude is equivalent to approximately 111 km on the equator, but is not
worth any more that 74 km with latitude of 48 degrees and becomes 0 km with the North
Pole. By considering a spherical earth of radius 6360 km
1° of longitude = cosine (latitude) * 111 km
1° of latitude = 111 km.
1° specifies the central meridian line
b) Select the ellipsoid
4.2 Lambert projection
The Lambert Projection produces conformal maps with very low distortion of area, and
hence produces maps with some of the lowest overall distortion parameters possible. In
Lambert projection the surface of projection is a tangent or secant cone.
Savamer 9.02 ©IRD
Representation of tangent cone
User manual - 5
Representation of secant cone
4.2.1 Lambert 1 Nord, Lambert 2 Centre, Lambert 3 Sud, Lambert 4 Corse
¾
¾
¾
¾
Lambert 1, zone, covering the north-western part of France
Lambert 2, zone covering the central part of France
Lambert 3, zone covering the southern part of France
Lambert 4, zone covering Corsica
The French Lambert 1, 2 and 3 system still being used in France nowadays, it is quite easy
to locate a point whose coordinates are expressed in the old "Modified British System", by
reproducing the calculation above and consulting an adequate map produced by the IGN
(French National Geographical Agency).
Savamer 9.02 ©IRD
User manual - 5
Lambert Zone 1 (North part of France)
Lambert zone 2 (Central part of France)
Lambert zone 3 (Southern part of France)
The definition of the parameters are rather numerous, ellipsoid, longitude of the prime
meridian, latitude of the parallel tangent or the parallel secant, latitude of the parallel of the
point of origin, co-ordinates of the point of origin, scale factor. To avoid specifying all
these parameters systematically, the cartographers gave a name to a certain number of
Lambert projections by fixing the parameters: Lambert I (Northern zone), Lambert II
(zone Centres), Lambert III (Southern zone), Lambert IV (Corsica). You can thus choose a
known Lambert without specifying its parameters.
The point of origin is always located at the intersection of the tangent prime meridian and
the parallel. One chooses the co-ordinates in the plan in order to avoid the negative coordinates. For example, the point origin has like co-ordinates 600000 and 200000 for
Lambert I, II, III.
Lambert projection is valid only on one restricted space, approximately 6 degrees to avoid
a great deformation of the distances. It is the system more used in Metropolitan France. If
you choose in the menu map lambert tangential , you have to define the central meridian
line parallel tangent, the scale and the co-ordinates of the point of tangency. You find this
information on topographic chart of your zone in Lambert.
Savamer 9.02 ©IRD
User manual - 5
a) Parameters in Lambert projection:
b) Selection of ellipsoid for the study zone:
4.3 Universal Transverse Mercator (UTM)
The Universal Transverse Mercator coordinate system was developed by the United
States Army in 1947. The system was based on an ellipsoidal model of the Earth. . In this
grid, the world is divided into 60 north-south zones, each covering a strip 6° wide in
longitude. These zones are numbered consecutively beginning with Zone 1, between 180°
and 174° west longitude, and progressing eastward to Zone 60, between 174° and 180° east
longitude. The Universal Transverse Mercator Coordinate (UTM) system provides
coordinates on a world wide flat grid for easy computation. The Universal Transverse
Mercator projection is international plane (rectangular) coordinate system in which it is
divided into 60 zones and extends around the world from 80°N to 80°S. It is a transverse
cylindrical projection in which the surface of the sphere is projected on a tangent cylinder
with the sphere following a meridian line, called central meridian line.
Savamer 9.02 ©IRD
User manual - 5
Cylindrical representation
In the software Savane, it is necessary to indicate the longitude of the central meridian line
and the ellipsoid used. In the dialog box below, it is necessary to define the central
meridian line of your zone of study. Generally this information is noted on the topographic
charts; if not will have to find in the table defining zones UTM below.
a) Parameters in UTM Projection
b) Selection of the ellipsoid for the study zone
Savamer 9.02 ©IRD
Table: UTM Zones
User manual - 5
UTM Zones