1
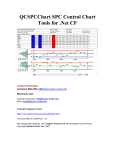
46 Class Architecture
SPC Analysis Charts
Frequency Histograms
Probability Charts
Pareto Charts
•
Minimal programming required – create SPC charts with a few lines of code
using our SPC chart templates.
•
Integrated frequency histograms support – Display frequency histograms of
sampled data, displayed side-by-side, sharing the same y-axis, with the SPC chart.
•
Charts Header Information – Customize the chart display with job specific
information, for example: Title, Operator, Part Number, Specification Limits,
Machine, ect.
•
Table display of SPC data – Display the sampled and calculated values for a SPC
chart in a table, directly above the associated point in the SPC chart, similar to
standardized SPC worksheets.
•
Automatic calculation of SPC control limits – Automatically calculate SPC
control limits using sampled data, using industry standard SPC control limit
algorithms unique to each chart type.
•
Automatic y-Axis scaling – Automatically calculated the y-axis scale for SPC
charts, taking into account sampled and calculated data points, and any control
limit lines added to the graph.
•
Alarms – When monitored value exceeds a SPC control limit it can trigger an
event that vectors to a user-written alarm processing delegate.
•
SPC Process Capability Calculations -Variable Control Charts include Cp, Cpl, Cpu,
Cpk, Cpm, Pp, Ppl, Ppu, and Ppk process capability statistics
•
Notes – The operator can view or enter notes specific to a specific sample
subgroup using a special notes tooltip.
•
Data tooltips – The operator can view chart data values using a simple drill-down
data tooltip display. The Data tooltips can optionally display sample subgroup
data values and statistics, including process capability calculations (Cp, Cpl, Cpu,
Cpk, Cpm, Pp, Ppl, Ppu, and Ppk) and customized using notes that have been
entered for the sample subgroup.
•
Data logging – SPC data (time stamp and/or batch number, sample values,
calculated values, control limit values, and notes can be logged to disk in a CSV
(commas separated value) file format.