1
Save Energy with Intelligence
HOW DOES IT PERFORM?
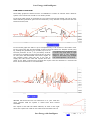
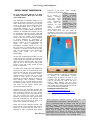
These daily graphs are taken from an I2 installation in London in summer with a 3kW PV
system. The vertical axis is kWh in a 5 minute period.
In the first graph export is controlled to a low value until the thermostat cuts out at 4pm.
About half the generation goes into the immersion, a tiny amount is exported and the rest
feeds the house load.
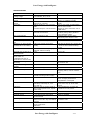
In the second graph the water is up to temperature by 12.30 as there is less water used.
For the rest of the day the thermostat cycles to keep the water hot. Despite clouds going
by, making the generation very variable, up to 12.30
“I purchased a pre production box
the fast processor in the I2 very accurately controls
it works very well with no light
the export to a steady minimum and carries on doing
flickering and a low switching
so every time the thermostat cuts back in again. It
margin. I find them very straight
only imports power when the sun is too dim to
and knowledgeable.” JU of Herts
supply the entire house load and exports when the
water is hot. With a simple wiring change this export could be directed to a second load
like a second immersion or a house heater.
980kWh was delivered into this immersion in a year. With the
more common 4kW PV system it would have been around
1500kWh.
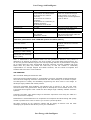
The export is less with the latest software, as seen on the right
where the export line is flat at zero until the thermostat cuts out.
Save Energy with Intelligence
7/12