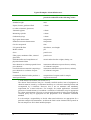
1
9.5
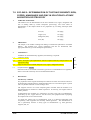
4.5 L/minute respectively and the burner height must be 30 mm.
A9
Aspirate the highest concentration standard of the range and the one that is designated for
instrument set-up. The take up rate is 4.6 mL/minute.
A9
9.6
Adjust the instrument conditions, tuning each emission source to give maximum
sensitivity to noise ratio, according to the instrument makers instructions.
10
INSTRUMENT CALIBRATION AND SAMPLE ANALYSIS
10.1
Working standard iron solution (100 µg Fe/mL)
R6
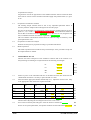
Dilute the standard solution (5.1) 1+9 with water (4.1).
A5
Working standard copper solution (10µg Cu/mL)
R6
Dilute the standard solution (5.2) 1+9 with water (4.1) and then dilute the resulting
solution 1+9 with water (4.1).
A5
A5
Working standard manganese solution (10 µg Mn/mL)
R6
Dilute the standard solution (5.3) 1+9 with water (4.1) and then dilute the resulting
solution 1+9 with water (4.1).
A5
A5
Working standard zinc solution (10 µg Zn/mL)
R6
Dilute the standard solution (5.4) 1+9 with water (4.1) and then dilute the resulting
solution 1+9 with water (4.1).
A5
A5
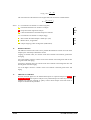
Mix by inversion each standard solution in the calibration line and aspirate in turn,
beginning with the highest concentration standard and working down to lower
concentrations. Wait for 10 seconds before recording the absorbance reading.
G2
10.2
10.3
10.4
10.5
10.6
When all the standard solutions in the range have been run, begin aspirating the sample
solutions in the same way. After every 10 sample solutions aspirate the highest
concentration standard in the range and check for instrument drift. If the absorbance
reading for a sample solution is above the highest concentration standard in the range
then dilute the sample with 0.5 mol.L-1 hydrochloric acid (4.3). If the reading for a
sample solution is lower than that for the lowest standard in the range, run the sample
solution on a lower range calibration line. Aspirate the 0.5 mol.L-1 hydrochloric acid
(4.3) used for dilution as a blank value. Note that this is in addition to the '0 mg/kg'
original sample blank.
10.7
When all the sample solutions have been run, repeat the aspiration of the standards and
check that the absorbance value of the highest concentration standard in the line is
consistent with that obtained at the beginning of the run.
Place aspiration take-up tube in the beaker of glass distilled water.
Carry out each measurement four times.
11
CALCULATION OF RESULTS
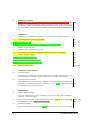
For each element and each standard range used, construct a calibration graph of
absorbance versus concentration (mg/mL). Carry out a linear regression analysis of the
calibration data to obtain the slope (m) and intercept (c).
From the observed absorbance (y) determine the concentration of each element of
interest in the extract solution using the expression:
LGC/VAM/Traceability Guide
XXXVII