1
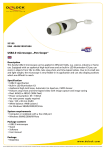
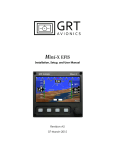
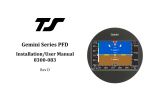
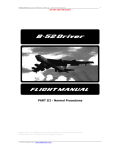
Flight Instrumentation
2.1 Primary Flight Display Overview
The HXr Primary Flight Display, or PFD, is a digital representation of the traditional flight instruments
such as airspeed, altimeter, heading, and attitude indicator, enhanced by features that help ease pilot
workload and give a more intuitive feel to the instrument scan. The flight instrumentation of HXr was
designed to minimize pilot workload by maintaining consistency in layout and design of critical elements
for aircraft control. Supplemental information, such as map and engine data, is provided in pilotselectable “inset” windows that do not rearrange the basic flight instrumentation; this allows a pilot to
always maintain the same scan even though he or she may need different types of information on the
screen as the flight progresses. A a split-screen PFD view is also available that displays a large PFD next
to a detailed moving map and engine instrumentation strip.
WARNING: The magnetometer and pitot/static system must be calibrated before the first flight to
ensure correct instrument indications on the PFD. See Section 9 of the HX User Manual for instructions.
WARNING: A PFD offers much more information and requires a different instrument scan than a
traditional "6 pack" grouping of analog flight instruments. It is imperative that you develop proficiency
using the PFD and become accustomed to the different instrument scan needed for a PFD before flying
in actual instrument conditions. Dual instruction from a CFI experienced with EFIS systems is highly
recommended.
The basic PFD Home screen consists of the primary flight instruments:
Ÿ Full-width Artificial Horizon with 30-mile Synthetic Vision
Ÿ Altimeter Tape with trend marker and sensitive baro setting
Ÿ Airspeed Tape with programmable V-speeds, color strips and trend marker
Ÿ 360° Heading Indicator with HSI and heading bug
Ÿ Vertical Speed Indicator with programmable range, visual needle and digital readout
Ÿ Pitch Ladder, Bank Angle indictors, Turn Coordinator, and Slip/Skid indicator
Secondary information on the PFD covered in this section includes:
Ÿ Wind vectors, true airspeed, GPS groundspeed & waypoint information
Ÿ Sky Pointer and Flight Path Marker to add awareness of aircraft position and motion in space
Ÿ Synthetic vision terrain, course ribbons and waypoint markers to make enroute navigation easy
Ÿ G-Meter programmable for individual aircraft limits
Ÿ Trim and flap indicators (optional trim/flap position sensor required)
Revision A1
Horizon HXr User Manual Draft
2-1
Flight Instrumentation
Slip/Skid
“Brick”
Airspeed
Indicator
Sky
Pointer
Attitude
Indicator
Turn Rate
Indicator
Flight Path
Marker
Vertical
Speed
Indicator
Height AGL
Altimeter
Altimeter
Setting
Wind
Slip/Skid “Brick”– Slides under Sky Pointer triangle to represent coordination. Replaces traditional skid-ball;
“Step on the brick.”
Sky Pointer– Always points toward sky, perpendicular to Earth.
Turn Rate Indicator– Place Sky Pointer on green triangle for standard rate turn.
Vertical Speed Indicator- White band is visual, digital block on bottom is actual vertical speed.
Altimeter– Tape with color-coded bands for terrain awareness.
Wind Vector– Displays Headwind/Tailwind and L/R crosswind components.
Altimeter Setting– Traditional barometric pressure setting.
Height AGL- Derived from GPS altitude and terrain database. Visible on Synthetic Approach only.
Flight Path Marker– Airplane’s path through space in relation to the ground.
Attitude Indicator– Traditional attitude indicator markings; uses entire screen as a horizon.
Airspeed Indicator– Airspeed tape with configurable V-speeds, colored bands, and trend indicator
2-2
Horizon HXr User Manual Draft
Revision A1
Flight Instrumentation
2.2 Attitude Indicator/Artificial Horizon
The Artificial Horizon is just that, a pictorial representation of the earth. The blue portion represents the
sky; the green or brown portion represents the ground. The HXr displays a computer generated
representation of the “view out the window” using GPS-based technology known as synthetic vision
to enhance the artificial horizon and make it more realistic. By adding details such as mountain peaks,
runways, and obstacles to the pilot’s instrument scan field of view, the system adds intuitive situational
awareness even in low visibility and instrument conditions. Other instruments add motion sensing,
trend vectors and environmental information to the scan as well, providing an intuitive feel for the pilot.
The total picture offered by the artificial horizon consists of several components working together.
Attitude Reference Index
The Attitude Reference Index is always the in the same
position relative to the aircraft. The horizon line, pitch
ladder and sky pointer move in relation to it, providing
the indications of pitch, roll, and “which way is UP.”
The traditional attitude “bars” or “wings” can be replaced
by a “nose” indicator (shown at right). This small indicator concisely displays the nose
position of the aircraft relative to the horizon.
To select Nose or Bars (wings):
1. Access Set Menu > Primary Flight Display > Attitude Reference Index.
2. Select NOSE or BARS.
NOTE: When ILS CDI crosshairs are displayed on the PFD, they replace the
Attitude Reference Index. The crosshairs are always in the same position as
the Attitude Reference Index, so they provide an effective replacement.
Displaying both would unnecessarily clutter the screen.
Pitch Ladder Offset
The Pitch Ladder is a portion of the artificial horizon that depicts the pitch
angle of the aircraft in relation to the horizon. It consists of horizontal lines
above and below the neutral “zero-pitch” line, which is a thin white line
stretched across the entire screen. Most of the ladder rungs are in 5-degree
increments. Small horizontal lines below the zero-pitch line are in 1-degree
increments for precise pitch control during landing approach. In the
screenshot above right, the pitch angle of the aircraft is about 1 degree
nose-low, as shown by the Attitude Reference Index (bars) crossing the first
rung below the zero-pitch line. In the screenshot below it, note the white
circle that marks the 90-degree pitch rung. This is visible during a loop or
hammerhead.
Revision A1
Horizon HXr User Manual Draft
2-3
Flight Instrumentation
Adjusting Pitch Ladder Offset
During straight and level unaccelerated flight at the normal cruise power setting, the pitch ladder
should be set so that the Attitude Reference Index is aligned with the zero-pitch line. The object is to
set the pitch ladder for the easiest possible instrument scan during cruise.
1. Press MORE > Set Menu > Primary Flight Display.
2. Scroll to Pitch Ladder Offset. Adjustments are made in positive or negative 1-degree increments;
a positive setting will move the Attitude Reference Index up, and a negative setting will move
it down.
3. Adjust it in small increments until the Attitude Reference Index and the zero-pitch line are
aligned during level normal cruise flight.
be used to compensate for the tail-down attitude of a taildragger
NOTE: Pitch Ladder Offset should
on the ground. When you are on the ground in a taildragger, the view out the virtual EFIS window
should look toward the sky, just as it looks out the windshield. Pitch ladder offset is ONLY for calibrating
straight-and-level flight.
It should also never be used to adjust the attitude indication for varying airspeeds or other flight
conditions. Once it’s set for your particular airframe/engine/propeller combo, the Pitch Ladder Offset
should not normally be moved. Adjusting this for varying flight conditions can be dangerous when
those conditions change again, potentially leading to spacial disorientation in instrument conditions.
Paying attention to a consistently-placed pitch ladder indication will result in greater understanding
of the pitch changes that occur with changing airspeeds, power settings and cargo loading.
Sky Pointer & Slip/Skid Indicator
The Sky Pointer is the white triangle in the middle of the bank indicator
hash marks. This simply points UP at all times. If you roll inverted, it will
point at the sky and thus appear as if it’s pointed at your floorboards. This
is displayed as an aid for unusual attitude recovery and also serves as the
bank angle pointer.
The small rectangular bar that slides under the Sky Pointer is the Slip/Skid
Indicator; thus, the modern instructor’s command for coordinated turns
has become “Step on the Brick!” At the request of some of our aerobatic
HXr pilots, the traditional ball-type slip/skid indicator is now available as
a choice on the HXr under the Set Menu > Primary Flight Display > Slip
indicator setting. When “ball” is selected, the bar disappears and the
electronic ball is prominently displayed above the heading indicator.
2-4
Horizon HXr User Manual Draft
Revision A1
Flight Instrumentation
Flight Path Marker
The flight path marker shows where the aircraft will go if all conditions of motion and
wind stay the same. Shown as a circle with three spikes, it is a projection of the
aircraft’s flight path. It combines many data factors including attitude, airspeed, and
wind vectors calculated from GPS ground track, ground speed, airspeed and magnetic
heading. The flight path marker will appear to float about the display as the aircraft
pitches and rolls. This movement is most evident in strong crosswind or unusual attitudes. For example,
during a properly-flown crabbed crosswind approach, the heading (nose) will point to the upwind
side, but the flight path marker (center of mass) will be superimposed on the virtual runway because
that is where the airplane is going at that particular instant in time.
2.3 Turn Coordinator
The turn coordinator is depicted at the top of the pitch ladder and below the heading window as a pair
of inverted green triangles. The HXr calculates the angle of bank required to make a standard rate turn
at the current airspeed. The turn coordinator triangles spread out or in as the airspeed increases or
decreases. To make a standard rate turn, align the sky pointer with the green triangle.
The turn coordinator can be turned off to declutter the display. To turn it on or off:
1. Press MORE > Set Menu > Primary Flight Display.
2. Scroll to Turn Rate Indicator
3. Select ON or OFF as appropriate.
Revision A1
Horizon HXr User Manual Draft
2-5
Flight Instrumentation
2.3 Airspeed Tape
The primary function of the airspeed tape is to display indicated airspeed and its associated color bands,
all of which are fully programmable according to the aircraft design limitations. It also has several
supplemental sources of information to provide the pilot with an intuitive sense of airspeed change, as
well as true airspeed and groundspeed.
True Airspeed
Digital Airspeed
Readout
Trend Arrow
Speed/Distance
Units
Groundspeed
The instantaneous airspeed readout is contained in the black box with large, bold numbers. The digits
appear to “roll by” smoothly as speed changes. The units of distance/speed are displayed below the
digital readout. True airspeed (TAS) is displayed in the upper left corner, while GPS groundspeed is
displayed in the lower left corner, as shown below.
Trend Arrow
The trend arrow points to the predicted speed of the aircraft in 5 seconds at the current rate of acceleration.
V-Speed Reference Markers
The airspeed tape also features three programmable V-speed reference
markers that appear as magenta triangles with letters X, Y, & G; these
stand for for VX, VY and VG (best glide).
2-6
Horizon HXr User Manual Draft
Revision A1
Flight Instrumentation
Colored Airspeed Bands
The colored band on the airspeed tape follows the standard airspeed color scheme. The digital airspeed
value turns yellow or red when it is within the yellow or red ranges for additional emphasis.
Red/Black
(optional)
Zero to VS (full-flap stall speed). Airspeed values too low to register on the EFIS will
appear as a red dash (- -) in the digital readout window. Option: Red or clear.
White
Full-flap stall speed (VS0) to flap extension upper airspeed limit (VFE)
Green
Stall speed (VS0) to maximum structural cruise speed (VNO)
Yellow
Maximum structural cruise speed (VNO) to never-exceed speed (VNE)
Red/Black
Never-exceed (VNE) and beyond
Customizing the Airspeed Tape For Your Aircraft
The airspeed indicator settings are programmed in SET Menu > General Setup > Primary Flight Display.
They should be programmed before the first flight according to the design limitations of the aircraft,
and can be fine tuned during flight testing to match the individual aircraft’s flight characteristics.
2.4 Altimeter Tape
The Altimeter Tape displays altitude above mean
sea level (MSL) in hundreds of feet or meters. Even
thousands are depicted by a solid marker, either
a circle, triangle or rectangle. Five-hundred foot
increments are depicted by a hollow marker. The
baro setting is displayed in the lower right corner.
Terrain
Clearance
Color
Band
The terrain clearance color band on the edge of
the altimeter tape shows the Off-Route Obstacle
Clearance Altitude (OROCA) which provides 1000foot obstruction clearance in non-mountainous
terrain areas and 2,000-foot obstruction clearance Altitude Bug
in designated mountainous areas within the (set below the
United States. An altitude below the OROCA is tape range)
shown yellow, above the OROCA is shown green.
Revision A1
Horizon HXr User Manual Draft
Digital MSL
Altitude
Altimeter
Setting
(BARO)
2-7
Flight Instrumentation
To adjust the barometric pressure setting on the altimeter:
1. From any HOME screen, press the light blue BARO softkey.
2. Turn the right knob to the current altimeter setting.
Alternatively, press the 29.92 softkey for transition
into the flight levels.
3. Press the knob again to accept the new baro setting or CANCEL to abandon the changes.
NOTE: The difference between the pitot/static altitude and GPS-derived altitude is displayed in the
window behind the right knob while the BARO controls are active.
Using the Altitude Bug
The Altitude Bug has a window located above the altimeter tape and is marked on the altimeter tape
itself by a magenta rectangle with a notch. The altitude bug serves two functions:
Ÿ The commanded altitude for the autopilot to
climb/descend to and hold.
Altitude Preselect
Window
Ÿ A reminder for a cruise altitude or any other altitude the
pilot wishes to remember.
To set the altitude bug from any HOME page:
1. Turn the Right Knob to enter the desired altitude into the
Altitude Preselect Window.
2. Press the knob to set.
Altitude Bug
Marker
3. If an autopilot with vertical navigation capability is installed and engaged, the system will then
display a message to verify the speed or rate of the climb or descent desired to fly to the set
altitude. See Autopilot section of this manual for more information on coupled climbs & descents.
Altitude Intercept Arc (Map Screen)
The Altitude Intercept Arc appears as a variable green arc on the map
screen. It is a visual depiction of the place the aircraft will be when it
intercepts the altitude entered into the altitude preselect window. It is
calculated using the current rate of climb or descent and groundspeed.
During a climb or descent, adjust the rate of altitude change to place
the arc over the place you want to be when you get to your selected altitude. This can be very useful
in a cruise descent toward your destination if you set the altitude bug to pattern altitude or your next
IFR altitude. It can also be useful for planning climbs near high terrain. The more stable the descent
or climb, the more stable the arc will be. It shrinks as you get closer to the altitude intercept point.
2-8
Horizon HXr User Manual Draft
Revision A1
Flight Instrumentation
Altitude Deviation Alerts
An alert can be set to flash on the EFIS when the altitude specified in the Altitude Bug Window is
exceeded by a certain amount. To set an Altitude Alert:
1. Press MORE > Set Menu > Primary Flight Display
2. Scroll to Altitude Alerting and turn it ON.
3. Highlight Max Altitude Deviation. Set the altitude deviation alert threshold- typically 200 feet.
2.5 Vertical Speed Indicator
The vertical speed indicator (VSI) is along the left side of the altimeter. VSI
The tape is white and radiates upward or downward from the neutral digital
mark as the aircraft climbs and descends. It shows vertical speed in feet value
or meters per minute. The vertical speed is also presented digitally at
the bottom of the scale when descending and at the top of the scale
when climbing. The VSI tape’s upper limit can be programmed to fit the
VSI tape
climb performance capability of the aircraft for a more precise visual
representation.
To customize the VSI:
1. Press MORE > Set Menu > Primary Flight Display
2. Scroll to Max Indicator Vertical Speed. Choose the upper limit of
the VSI scale most appropriate for the aircraft’s climb performance.
The actual rate of climb will still be displayed numerically even if the visual indicator is maxed out.
2.6 Heading Indicator
The HXr magnetic heading indicator is presented in a Horizontal Situation Indicator (HSI) format on the
PFD screen and an arc format on the Map screen. This section of the manual covers the basic heading
functions of the HSI. Detailed information on how to use the bearing pointers and navigation functions
of the HSI are found in the Navigation section of this manual.
Using the Heading Indicator
The heading indicator gets its magnetic information from the magnetometer and is corrected with
internal calculations by the AHRS. After the magnetometer is calibrated, there is no need or provision
for manually adjusting it- it is all done automatically during AHRS boot-up and alignment. This eliminates
in-flight precession and forgetting to set it before takeoff, common issues with vacuum gyro instruments.
Revision A1
Horizon HXr User Manual Draft
2-9
Flight Instrumentation
Components of the HSI (Horizontal Situation Indicator)
The HSI overlays GPS and VOR/LOC courses onto a heading indicator. It functions as a standard HSI.
Vertical Compass Presentation- Presents all 360° with your aircraft in the center. Automatically sets
correct magnetic heading before flight using magnetometer information.
Magnetic Heading- The present magnetic heading is displayed in large numbers at the top.
Heading Bug- Small rectangle, either white or dark magenta, used as a reminder and to control the
lateral autopilot in heading mode. Controlled by the Left Knob.
Track Pointer- Small magenta diamond that points in the direction of the current ground track.
Bearing Pointers- Independent of the course pointer and always point at their corresponding nav
source. BRG 1 has a solid head and single tail/shaft. BRG 2 has a split head and double tail/shaft.
Course Selection Needle- Represents active nav course. The center segment of the GPS or VOR/LOC
course needle, or Course Deviation Bar, moves along a CDI scale when in range.
To/From Indicator: Green triangle appears when tracking a VOR radial; TO points toward Course
Selection Pointer head; From points toward Course Selection Pointer tail.
Magnetic
Heading
GPS Ground Track Pointer
Heading Bug
Bearing Pointer
Head (BRG 1)
Course Selection
Needle Head
Course Deviation
Bar
To/From
Indicator
Course Selection
Needle Tail
Course Deviation
Indicator (CDI)
Scale
Bearing Pointer
Tail (BRG 1)
2-10
Horizon HXr User Manual Draft
Revision A1
Flight Instrumentation
Arc and Tape Heading Presentations
While the 360° HSI presentation is straightforward, the heading tape and arc views have some unique
features. The tape view is present on the PFD Split Screen view if the EGT/CHT graphs are shown. The
160° arc or 360° non-HSI view can be shown on the map screen.
The heading tape covers a 70° span and is presented above the engine strip on the Split PFD screen. It
displays four parameters with the following white or magenta symbols:
Magnetic Heading
H
GPS Ground Track
T
Bearing or course to current GPS waypoint
Heading Bug
On both the Primary Flight Display and Moving Map Setup pages, there is a setting for Up Reference
on the very top of the page. This can be either Heading or Track. Most pilots prefer their PFD heading
indicator to be Heading Up so they can accurately follow ATC vectors. Track Up is usually preferred
for the moving map screen. The parameter that is set as the Up Reference is stationary at the top or
center of the heading presentation and labeled as shown below.
PFD Tape
Heading UP
Bearing to GPS
waypoint
Heading
Ground
Track
Heading
Bug
Map Arc
Track UP
The bearing and track symbols fit inside each other so they create a nice visual effect when the aircraft
is on course.
The symbols are magenta when they are selected for navigation; for example, if the autopilot is in
heading mode, the heading bug and heading triangle will be magenta, and the track and bearing
symbols will be white.
Revision A1
Horizon HXr User Manual Draft
2-11
Flight Instrumentation
In the tape and arc views, if one of the symbols runs off the edge of the screen, it becomes hollow and
stays on the side of the screen closest to it, as shown below.
Using the Heading Bug
To change the position of the heading bug from any HOME
screen, turn the left knob. The digital position of the heading bug
will display in the window above the left knob, and the visual bug
indicator rotates around (or slides across) the heading tape.
To immediately set the heading bug to the present heading,
simply push the left knob to “sync” it.
For more information about using the heading bug with the autopilot, please refer to the Autopilot
section of this manual.
WARNING: Moving the heading bug while the autopilot is engaged in Heading Mode will result in an
immediate turn to the new heading specified by the bug!
Split Screen PFD HSI Presentation
On the Split Screen PFD, pilots can choose between the straight heading tape with EGT/CHT graphs
or the full HSI presentation on the Split Screen PFD by pressing SCREEN > PFD Options > EGT/CHT or
HSI softkeys. This allows the most important information to be displayed in a minimum amount of space.
2-12
Horizon HXr User Manual Draft
Revision A1
Flight Instrumentation
2.7 Wind Vector & Crosswind Component
The wind vector is located to the right of the altimeter baro setting. It is calculated using GPS ground
track, ground speed, and heading and true airspeed data provided by the AHRS.
It consists of two main parts- a vector arrow with velocity and direction, and a headwind/crosswind
component. At its simplest, it is an arrow with a velocity number next to it. The wind blows from tail to
head. The velocity is given in the speed/distance units chosen for the EFIS system. In addition to the
vector arrow, a magnetic compass direction can also be displayed.
To turn on the wind vector:
1. Press MORE > Set Menu > Primary Flight Display
2. Scroll to Wind Indicator Mode. Choose OFF, Vector and Digital
Speed (shown above), or Vector and Digital Speed/Direction (adds
magnetic wind direction to the above display, shown at right).
Headwind/Crosswind Component
The headwind/crosswind component gives headwind (H) or tailwind (T)
first and left (L) or right (R) crosswind second. To turn on head/crosswind
component:
1. Press MORE > Set Menu > Primary FLight Display
2. Scroll to Digital Head/Crosswind Display and turn it ON or OFF.
NOTE: If insufficient data exists for calculation of winds, the wind information is not displayed. Accurate
winds require accurate magnetic heading and airspeed data, which are enhanced by performing proper
calibration of magnetometer and pitot/static systems as detailed in the HXr Installation Manual (also
the HX User Manual, Rev. C, Section 9).
Revision A1
Horizon HXr User Manual Draft
2-13
Flight Instrumentation
2.8 G-Meter
The G-meter measures the G-loading of the airplane based on forces measured by the accelerometers
inside the AHRS. It is displayed to the right of the airspeed tape on the Primary Flight Display.
G-Meter Settings
Press MORE > Set Menu > Primary Flight Display to access G-Meter settings.
G-Meter Mode- Choose if or how to display it on the Primary Flight Display.
G-Meter Maximum- Sets the maximum positive G-loading on the scale
G-Meter Minimum- Sets the minimum negative G-loading on the scale
G-Meter Caution Max-Positive G-load caution threshold-Turns yellow beyond this value
G-Meter Caution Min- Negative G-load caution threshold- Turns yellow beyond this value
Auto G-Meter High Threshold- Displays the G-meter on the PFD in “Auto” setting when this
positive-G value is exceeded
Auto G-Meter Low Threshold- Displays the G-meter on the PFD in “Auto” setting when this
negative value is exceeded
Turning On the G-Meter
1. Press MORE > Set Menu > Primary Flight Display.
2. Scroll to the G-Meter options near the bottom of the screen. Select an option on the G-Meter
Mode setting:
a. Off- Does not display. Note that even when the G-Meter Mode is set to “Off,” all G force data
is recorded during data logging.
b. On- Displays all the time
c. On with Min/Max- Displays all the time with the minimum and maximum Gs experienced during
the flight
d. Auto- Comes on if a preset Auto G-Meter High or Low Threshold is exceeded. This allows it to
replace Trim Indicators temporarily until the G limits settle below the threshold. (See Trim
Indicator notation.)
2-14
Horizon HXr User Manual Draft
Revision A1
Flight Instrumentation
Setting Up the G-Meter
Enter the maximum (positive limit) and minimum (negative limit) of your aircraft
in the G-Meter Minimum and Maximum settings. Set the Caution limits the
same way; the G meter turns red if the Max/Min limits are exceeded, and turns
yellow if the Caution limits are exceeded. Your aircraft designer may have
established caution levels, or you can choose your own.
Using the G-Meter with Trim Indicators
Space on the PFD is limited, and the best place for the flap and pitch trim indicators happens to be the
same place the G meter resides. The G-Meter Mode “Auto” setting will automatically make the G meter
appear in place of the trim indicator when the Auto G-Meter Max and Min Threshold limits are exceeded
in flight.
G-Meter Data Logging
G-force data is recorded with all of the other AHRS data during a demo recording. For instructions on
Feature of the
how to record a permanent record of your G readings, see the
Week on the GRT website for automatic recording of flight data.
G-Meter Limitations
The G-meter has the same limitations as the AHRS: +/- 10 G of acceleration.
2.9 Flap and Trim Indicators
If the aircraft is equipped with electronic flap and trim position sensors, they can be wired directly to
the HXr analogs and the indication programmed to appear on the screen, eliminating the need for
external LED indicator lights. See HXr Installation Manual for information on wiring and setup.
The indicators appear to the immediate lower right of the airspeed
indicator, as shown below.
To change the direction of the Pitch Trim indication (UP on top or
DOWN on top):
1. Press MORE > Set Menu > General Setup.
2. Scroll to Elevator Trim Orientation and choose Down trim
(D) at the top or UP trim (U) at the top.
Revision A1
Horizon HXr User Manual Draft
2-15
Flight Instrumentation
2.10 Angle of Attack Indicator (AOA)
Angle-of-Attack is calculated by the EFIS by
combining a variety of sensor data. It may be used
to drive two different indicators on the PFD screen.
Angle-of-attack is not of much value for most
phases of flight, but is useful for stall warning, and
to a limited extent, as a means of establishing an
approach speed that accounts for the current
weight of the airplane.
WARNING: The AOA must be activated in the
Primary Flight Display set menu and calibrated
before use. See HX User Guide, Section 9 for more
information.
WARNING: The use of this indication is purely at the judgment of the pilot. The accuracy of this AOA
indexer, and its stall warning, is affected by EFIS sensor errors and the accuracy of the calibration
procedure. The EFIS calculation of angle-of-attack, and the approach AOA indexer should not be used
as the only stall warning instrument. Some indication lag and error will occur when flying through areas
of rising and falling air; Do not rely on the indexer in turbulent conditions.
Approach AOA Indexer
This indicator appears just to the right of the airspeed tape, and
shows the angle-of-attack relative to the optimal for approach.
When the angle-of-attack too low (the airplane is flying faster than
optimal approach speed), yellow chevrons pointing up into a
yellow circle prompt the pilot to increase back pressure to reduce
speed, and similarly, red chevrons pointing down into a circle
prompt the pilot to push forward to increase speed. When stall is
imminent, the word "PUSH" appears above the AOA indexer. The
indexer will show a green circle, with no chevrons, when the
angle-of-attack is in the optimal range for approach. The approach
AOA indexer will not appear at low angles-of-attack.
Barber-Pole Stall Speed Indicator
A vertical red/black bar is displayed on the bottom half of the
airspeed tape. The top of this bar corresponds to the stall speed
at the current "G" loading, and is based on the stall speed entry
made in the EFIS, and the normal acceleration "G's" sensed by the
AHRS.
2-16
Horizon HXr User Manual Draft
Revision A1
Flight Instrumentation
Pitch Limit Indicator
When enabled on the PFD settings page, the pitch limit indicator appears on the PFD screen when the
angle-of-attack is less than 8 degrees from stall, and goes away when the angle of attack more than 9
degrees from stall. It resembles a red pair of antlers and is shown in the screenshot below. The indicator
moves downward toward the nose or bars pitch indicator as the angle of attack increases. Stall will
occur approximately when this indicator is on the nose or bar pitch indicator. This indicator is limited
to 30 degrees pitch to prevent chasing a pitch limit that could temporarily be at a very high pitch angle
due to high airplane speed.
The pitch limit indicator was originally created to give pilots a
maximum pitch angle reference when performing a windshear
escape maneuver. While this may be of little use for the typical
experimental aircraft pilot, it could be useful for assisting with
terrain avoidance in a low airspeed situation. In that case, the
pilot can use the pitch limit indicator as an approximate
reference of a pitch angle that will result in stall.
AOA Settings
To turn on or turn off AOA functions:
1. Press MORE > Set Menu > Primary Flight Display
2. Scroll to AOA. Select ON or OFF. This will activate more
settings just below the AOA setting.
3. Turn on the Pitch Limit Indicator if desired.
WARNING: AOA must be calibrated before use– See Section 9, HX User Manual.
Revision A1
Horizon HXr User Manual Draft
2-17
Flight Instrumentation
2.11 Synthetic Vision Features & Settings
Synthetic vision (SV) is standard on HXr. It displays a 30-mile “out the window” view on the PFD of
terrain, runways, obstacles, and traffic. It also provides a top-down terrain view on the Map pages. GRT
factory technicians load the synthetic vision terrain database appropriate for the area of the world in
which the EFIS system will be used prior to shipment.
NOTE: Synthetic vision is dependent upon GPS signal for proper depiction relative to the internal terrain
database.
NOTE: The synthetic vision terrain database does NOT need to be periodically updated, and is not
downloadable from the GRT website. Contact GRT for support if you encounter any problems with the
synthetic vision database or if you are flying in an area of the world that is different from the database
loaded in your system. To access synthetic vision database status for troubleshooting, press MORE >
Set Menu > Display Unit Maintenance >Database Maintenance page.
Terrain
Terrain features are presented on the primary flight display as they would appear out the window.
Mountains, rivers, lakes, valleys, and other features appear on the screen and help guide the pilot in
low-visibility situations.
In addition to the normal green-to-brown terrain shading, portions of the surrounding terrain that
are close to the aircraft’s present altitude can be colored yellow (500-1000 feet below the aircraft) and
red (within 500 feet of the aircraft’s altitude and higher).
NOTE: Turning terrain warning ON will color all terrain within 1000 feet of present altitude, even during
landing approach. Some passengers may find this to be alarming.
To turn on red and yellow terrain warning shading on the PFD:
1. Press SCREEN >PFD OPTIONS > TERRAIN.
To turn off terrain warning shading and go back to default SV:
1. Press SCREEN > PFD OPTIONS > SYN VIS.
Obstacles
Towers and other obstacles in the 56-day Navigation Database are displayed on the PFD as either
simple lines or chart-style graphic tower symbols. The same altitude color-coding as Terrain applies.
To choose how obstacles are depicted on the PFD screen:
1. Press MORE > Set Menu > Primary Flight Display.
2. Scroll to Obstacle Style and choose Line or Chart.
2-18
Horizon HXr User Manual Draft
Revision A1
Flight Instrumentation
Artificial Runways
Runways can be displayed on the PFD as a black strip with centerline and runway designation number.
This is extremely useful for spotting runways from the air and for flying into airports with multiple
runways.
NOTE: Turf runways will be depicted as black strips even though they
are not paved. Private runways can be added to the database by
adding them as User Waypoints. See Section 3, Adding User Waypoints.
To display runways on synthetic vision:
1. Press MORE > Set Menu > Primary Flight Display
2. Scroll to Artificial Runways and select ON.
Grid Overlay
The HXr can lay a grid onto the terrain of the PFD, creating an enhanced sense of depth, height and
direction to the synthetic vision. The grid is aligned with the cardinal true directions (N, S, E, and W). It
fades with height and distance to create an illusion of space. The squares are 12 arc seconds apart, or
about 1,215 feet, and follow the shape of the terrain. To display the grid on synthetic vision:
1. Press MORE > Set Menu > Primary Flight
Display
2. Scroll to Synthetic Vision Grid Overlay and
select ON.
Traffic
Traffic targets picked up by ADS-B or TIS can be
displayed “in space” on the PFD to mimic the view
out the windshield. The traffic vector line points from
the diamond-shaped target in the direction of motion.
See Traffic Alert inset or map for target altitude
relative to your position in hundreds of feet.
To display traffic on the PFD:
1. Press MORE > Set Menu > Primary Flight Display
2. Scroll to Traffic In View and select ON.
Revision A1
Horizon HXr User Manual Draft
2-19
Flight Instrumentation
Waypoint Balloons
Waypoint balloons are markers that highlight the next GPS waypoints in the
flight plan on the PFD. They have a “tether” that points directly downward to
the waypoint and are raised and lowered with the altitude bug. They are visible
beyond the 30-mile horizon line; in that case, they do not have a tether (as
shown to the right). In an enroute crosswind situation, keep the flight path
marker on the waypoint balloon to fly directly to the waypoint. The active
waypoint balloon is magenta. Subsequent waypoints in the flight plan are white.
To turn on waypoint balloons:
1. Press MORE > Set Menu > Primary Flight Display.
2. Scroll to Waypoint Balloons and select ON or OFF.
Course Ribbons
Course ribbons are a form of enroute Highway-In-The-Sky. They connect waypoint balloons and draw
a path in the sky that corresponds to the active flight plan leg- essentially, a 3D version of the course
lines drawn on the map screen. Course ribbons can take the form of a magenta course centerline or
dual magenta-shaded boundaries on each side of the course, starting at 200 feet apart and tapering
inward as the waypoint gets closer. Course ribbons beyond the next waypoint show as white centerlines.
In the example below, the next waypoint is after a right turn.
Magenta waypoint
balloon marks
RIPON, the active
waypoint
2-20
Active leg of flight
plan denoted by
course ribbon
(“boundary” is shown)
Horizon HXr User Manual Draft
The next
waypoint in a
sequential flight
plan is a white
balloon. This
example looks
pink because it
is behind the
transparent
course ribbon
boundary.
Revision A1
Flight Instrumentation
To turn course ribbons on and select their form:
1. Press MORE > Set Menu > Primary Flight Display.
2. Scroll to Course Ribbons. Select NONE, CENTER or BOUNDARIES.
Centerline
course ribbon
leading to
waypoint
balloon on the
horizon.
Revision A1
Horizon HXr User Manual Draft
2-21