1
Processing:
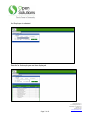
The Transaction Exception Trends screen can be accessed from the Security module within
DNA.
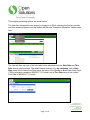
The application has four query choices: by Institution, by Branch, by Employee, and by
Overriding Employee. These four choices allow the User to look for overall Exceptions
(exceptions) that are raised across the Financial Institution, or to filter and drill down at the
Branch, Employee, or Overriding Employee level to obtain exceptions data at more granular
levels.
Once one of these four choices is selected, the User will then select a date range using the
Start Date and Thru Date selections to establish a query range. The Thru Date will default to
the current Post Date, and the Start Date will default to the value of the current Post Date
minus the value of the Number of Back Date Query Days (TEQD) calculation variable.
Note: when setting dates for the query, longer date ranges will result in longer query result
times.
When processed, the query will then return information in a four-column grid. The first row of
this grid will act as a summary row, and will list the total number of exceptions selected using
the query, based on the criteria selected. The second and subsequent rows will list a count of
each exception number in descending order of most frequent to least frequent.
Accompanying the count is a field for percentage, to show the User what percentage of the
total was for that particular exception.
For example, if the Institution choice was selected for the previous three months, and there
were 300 exceptions raised during that time for the Financial Institution, with the 300 among
three exceptions – 210 for Insufficient Funds (Exception #3), 60 for Uncollected Funds
(Exception #4), and 30 for Management Hold (Exception #87), there would be four rows
returned in the results grid.
The top/summary row would show a count of 300 and a percentage of 100.00. The second
row would show the exception number 3, a count of 210, and a percentage of 70.00. The
third row would show the exception number 4, a count of 60, and a percentage of 20.00. The
fourth row would show the exception number 87, a count of 30, and a percentage of 10.00.
The rows can be sorted in reverse order by clicking on the column headings. Note that if this
is done, the summary row and the detail rows will also be sorted.
Open Solutions Inc.®
455 Winding Brook Drive
Glastonbury, CT 06033-4335
860.652.3155
860.652.3156 fax
www.opensolutions.com
Page 2 of 22