1
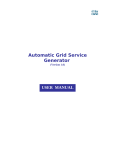
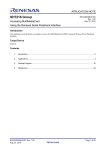
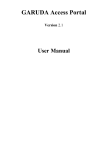
Grid Monitoring Tool - Paryavekshanam
Paryavekshanam 2.0
User Manual
Copyright @ 2008 C-DAC.
All rights reserved. No Parts of this document may be
reproduced, stored in a retrieval system or transmitted in
any form or by means, mechanical, photocopying,
recording, or otherwise, without the prior written
permission of Centre for Development of Advanced
Computing, C-DAC Knowledge Park, 1,Old Madras
Road, Byappanahalli, Bangalore, India -560038
User Manual, ver 2.1
i
Grid Monitoring Tool - Paryavekshanam
Project No: CDAC/B/SSDG/GMT/2004/025
Document No: SSDG/GMT/2004/025/USR-MAN/2.0
Control Status: Controlled
Author: Karuna
Distribution List: Project
1. SENG C-DAC Knowledge Park, Bangalore
2. Project File
Approved By
Ms. N. Mangala
Signature
Designation
Group Coordinator
Date of
approval
Release By: SSDG, C-DAC Knowledge Park, Bangalore
Date of Release:
Copy No.: 1
Document Revision History
Version
Date of Release
Pages Affected
1.0
07/07/06
All
Internal Release
2.0
2.1
26/06/08
14/08/08
All
All
New Release
Updated
Document
User Manual, ver 2.1
Reasons for
change
Signature
ii
Grid Monitoring Tool - Paryavekshanam
Contents
1
INTRODUCTION
1
2
PARYAVEKSHANAM OVERVIEW
2
3
PARYA DASHBOARD
4
4
CITY PAGE
9
5
CENTRE/NODAL PAGE
10
6
GOC DESK
11
7
GRID OVERVIEW
14
8
NETWORK INFO
15
9
DATA GALLERY
17
10 ALERT PAGE
19
11
SEARCH
20
12
ADMIN
21
13
JOB
21
14
SRB
23
15
FREQUENTLY ASKED QUESTIONS
24
User Manual, ver 2.1
iii
Grid Monitoring Tool - Paryavekshanam
1 Introduction
Grid Monitoring is an essential process of observing the critical entities
of the large distributed compute and data resources of the grid.
Monitoring
is
essential
fault
detection,
performance
analysis,
performance tuning and scheduling.
Paryavekshanam is a Grid monitoring tool which monitors the
heterogeneous resources of the grid. It gathers the health of all the
critical components of the grid as well as measures their status. It can be
used by grid administrators for fault detection, trouble shooting and
rectification, by grid users for resource availability information and by
managers for overall status of the grid.
Paryavekshanam is deployed as the grid monitoring tool on GARUDA
grid.
This document will outline how to use Paryavekshanam Version 2.0, the
tool’s important features and the parameters monitored by it. Chapters 3
to 14 describe the features of each of the web pages of Paryavekshanam.
User Manual
1
Grid Monitoring Tool - Paryavekshanam
2
Paryavekshanam Overview
Paryavekshanam monitors all major components of the grid – namely
computing nodes, network, globus components, jobs, storage and
software. It supports discovery, monitoring, logging and notification for
all the grid resources and services. The key features of Paryavekshanam
are:
rich user interface providing different outlooks - hierarchical drill
down, instant status, quick jump links or detailed graphs.
escalation of service failures / degradations through alert messages
archival of data for report generation and analysis
search facility
2.1 System Requirements
Browser: Internet Explorer 6.0 and above or Moziila Firefox 2.0 and
above.
2.2 URL
The tool can be accessed from the GARUDA Portal
or
invoked through a web browser on a machine connected to the
GARUDA grid by using the URL:
http://192.168.60.70/gridmon/GRID/gridmon.php
User Manual
2
Grid Monitoring Tool - Paryavekshanam
2.3 Important Web Pages
1.Paryavekshanam - Paryavekshanam home page.
2.GOC Desk - graphical representation of grid parameters.
3.Grid Overview – tabular information about the monitored parameters
of the grid.
4.Network Info – provides centrewise network information of the grid
5.Data Gallery – graphical representation of archived data
6.Alert page – detailed alert message listing
7.Search page – facility for searching of resources on the grid
8.Job page - search related to jobs
9.Admin page – facility for adding new resource provider sites.
10. About Us - information regarding GARUDA grid monitoring system
11. Contact Us -
contact information for reporting the bugs/queries
related to Paryavekshanam
2.4 Banner
The Banner contains links to the key pages of the tool that you will use
most frequently. The functions of each page is described in detail in the
following chapters. Each of the above pages are linked to the home page of
Paryavekshanam and other pages through the banner.
C-DAC
Home Page
GMMC Page
Network
Grid Summary
Site
Management
Paryavekshanam
Home
Portal
Home
Usage
help
Archive
About
tool
Search
Feedback &
contact
Fig 1: Banner
User Manual
3
Grid Monitoring Tool - Paryavekshanam
3 Parya DashBoard
This is the home page of Paryavekshanam tool. The home page consists of
a banner, India map, radar graph, alert box and status bar. The Banner is
explained in previous chapter (section 2.4).
Banner
Status
Bar
India
Map
Radar
Graph
Alert Box
Fig 2: Paryavekshanam Home Page
3.1 India Map
India map shows the various cities, connected by the GARUDA
communication fabric. The bullet at each city represents the strength of the
grid at that city using color codes explained in the legend.
User Manual
4
Grid Monitoring Tool - Paryavekshanam
Each bullet is a clickable link providing a drill down to the respective city
map showing the geographical location of the nodal centers in that city. In
turn each nodal center icon is also clickable to show the center details,
providing further drill down.
3.2 Radar Graph
The Radar graph represents the status of important parameters. Each
spoke of the radar graph represents a parameter. The parameters
monitored
by
Paryavekshanam
are
Node
Availability,
Memory
Utilization, CPU Load, Network Stability, Bandwidth Utilization,
Globus Strength, Active Users and Running Jobs respectively. These
parameters of the Grid are broadly a summation of the status of the
nodes, networks and jobs status submitted on GARUDA. The spokes of
the Radar Graph are calibrated (from 0% to 100%) representing the
parameter value in percentage. The Value of the parameter is marked by
a Blue Dot ‘.’. These dots on each of the spokes are connected to each
other to yield a graph which represents the status of utilization of
resources. The contour of an ideal graph on radar plot is a circle i.e.
each parameter at 100% utilization.
3.3 Alert Box
The Alert box highlights the recent error messages with the Error Id,
Center Name, Priority, and Status for the Corrective Action, at a glance.
3.4 Status Bar
The Status Bar gives the instantaneous information about working and
failed links, clusters, and nodes and utilization of Memory, CPU and
User Manual
5
Grid Monitoring Tool - Paryavekshanam
Storage in figures. A single click through the Status bar takes you to the
details of that resource. A closer look into the status bar follows.
Link
This shows the grid’s network connections that are up and down.
Clicking on “up” will display a page showing the centers whose network
link are working currently along with the uptime in days and hours.
Clicking on “down” will display a page showing the centers whose network
link are not working currently along with the city and downtime details.
Cluster
This depicts the number of clusters of the grid that are “up” and “down”
respectively.
Clicking these “up” / “down” links gives you details of clusters name, centre
name, OS, IP address, CPU speed, load, total RAM, free RAM and
uptime/downtime of the respective clusters.
Nodes
User Manual
6
Grid Monitoring Tool - Paryavekshanam
This category shows the total number of working and non-working nodes of
the entire grid.
Clicking on “up” link displays a page that lists the nodes which are up
presently. It gives information of node name, clusters name, centre name,
IP, CPU speed, load, total RAM, free RAM.
Similarly clicking the “down” link provides details of the nodes that are
down.
Memory
The sum of total free memory and total used memory of the entire grid is
displayed in GB.
The “free” and “used” are clickable links that take you to pages which detail
the name of centre, node, city and cluster, Total Memory and Free / Used
Memory, respectively, in MB.
Jobs
This category shows the total number of jobs submitted to the grid and the
number of jobs presently running on the grid.
Clicking on “total” displays a page that lists the total number of jobs on the
grid. It gives number of jobs submitted on a cluster and with respect to
every user.
User Manual
7
Grid Monitoring Tool - Paryavekshanam
Clicking on “run” lists the total number of jobs running on grid. It gives
statistics of jobs running on every cluster and with respect to every user.
CPU Load
The value displayed below is the average load on the whole grid.
Clicking the “CPU Load” link of status bar displays the “Grid Overview”
page (Chapter 7, Fig 6).
SRB
To access, click on “SRB” in the status bar. This will display the Storage
Resource Broker (SRB) status and the storage details as explained in
Chapter 14.
User Manual
8
Grid Monitoring Tool - Paryavekshanam
4 City Page
This page can be reached by clicking the city bullet
in the India map.
The color of the city bullet represents the strength of the grid as indicated in
the legend.
This page can also be reached from
Banner > Grid Overview > City Name in the Table.
This page displays the corresponding city map, locating the geographical
position of the nodal centers (GARUDA Partner institutions). The GARUDA
Partner institutions are represented by their institutions’ emblem. Each
emblem (nodal center) in turn can be clicked to provide the computing nodes
information on the nodal page. The text beneath the institution indicates the
total number of nodes in the centre, as shown in Fig 3.
Fig 3: City Page
User Manual
9
Grid Monitoring Tool - Paryavekshanam
5 Centre/Nodal Page
This page can be reached from the Paryavekshanam home page in just two
clicks through either method below:
City button
on India Map > institution emblem
on city page > resource provider site.
Or even by
Banner > Grid Overview > City Name in the Table
Fig 4: Nodal Center page
User Manual
10
Grid Monitoring Tool - Paryavekshanam
This page contains
1.
Computing Nodes information - Each nodes name, IP, speed, load, total
and free RAM. Status of nodes in the cluster and status of cluster.
2.
Middleware Components Status in tabular form and complete reason for
failure.
3. Software installed on that centre, available for use. The entire list of
software is displayed in a tree format. They are divided into 7 groups Application/Editor, Database, Debugger, Document, Graphical User
Interface, Libraries, Language, Security, System Environment, Utility
and Others.
User Manual
11
Grid Monitoring Tool - Paryavekshanam
6 GOC Desk
This page has been designed for the Grid Operations Center (GOC). The
GOC is responsible for coordinating the overall monitoring of Grid at
Garuda Monitoring and Management Center (GMMC).
GOC has the responsibility of monitoring the operation of the grid
infrastructure as a whole.
The important task of the Grid Operation
Center is to monitor all the critical components of the Garuda Grid on a
24X7 basis, and detect any malfunctioning. A first level fault analysis can
be carried out and the concerned local center will be informed / alerted to
rectify the problem immediately.
This page can be accessed from
Banner > GOC Desk
Fig 5: GOC Desk Page
User Manual
12
Grid Monitoring Tool - Paryavekshanam
This page will act as the central point of operational information and contact
details. It is a detailed graphical representation of all the major issues
relating to node, jobs, globus and network.
GOC Desk represents each of the critical grid parameter in a line graph. The
line graphs are ‘linked’ to center-wise graph representation for that
particular parameter. The graph plots percentage values for the parameters
against time for 23 hours (i.e. 12 am to 11 pm today).
The actual units for each of these parameters can be got by
‘gocCentrewiseUnits’, where the same values are represented centrewise in
their corresponding units. This page helps the GMMC to a keep close watch
on the critical components of the grid.
User Manual
13
Grid Monitoring Tool - Paryavekshanam
7 Grid Overview
Fig 6: Grid Overview page
You can reach from this page from the home page
Banner > Grid Overview
This is the percentage representation of eight parameters present in radar
graph in a tabular form. The values are grouped city and centerwise. Each
center is further clickable to drill down to various computing nodes
information (Fig 4). Each nodal center page lists the Globus Component
status and software packages installed.
User Manual
14
Grid Monitoring Tool - Paryavekshanam
8 Network Info
Fig 7: Network Overview Page
The above page can be reached from this page from the home page
Banner > Network Info
Network Info page (Fig 7) tabulates the various network parameters namely
Link Status, Bandwidth Available and Bandwidth Used in Mbps, and the
Packet Loss and Round Trip Time. These data are categorized city and
User Manual
15
Grid Monitoring Tool - Paryavekshanam
centrewise. The centers are further linked to a page where the above
mentioned parameters are graphically represented for every 10 minutes of
the present day i.e. 23 hours and the last hour is used for converting 10
minutes data into hourly average.
User Manual
16
Grid Monitoring Tool - Paryavekshanam
9 Data Gallery
This page can be reached from this page from the home page
Banner > Data Gallery
Fig 8: Data Gallery Page
‘Data Gallery’ page gives access to the archived data. The user can choose
to see the archive data for a particular date or for a specific period by
clicking on the appropriate option and selecting the date from the calendar
icon.
Grid Average for the chosen date/duration can be viewed with respect to
each centre.
User Manual
17
Grid Monitoring Tool - Paryavekshanam
You can also compare the grid average at different centers through the
Centerwise Grid Average option.
The Overall Grid Average displays the grid status with respect to the whole
grid for the various parameters monitored.
All these above options can be viewed in both tabular and graphical formats.
The Radar Graph Overall Grid Average option is useful for the grid
administrators to check the performance of the grid for a chosen date.
Data gallery page by default shows the grid summary for the last two days
in a radar graph.
User Manual
18
Grid Monitoring Tool - Paryavekshanam
10 Alert Page
Alert helps in finding and tracking all the error messages generated by the
system. The alerts are listed in a table along with details - status of the alert,
Error Id, date on which alert was raised etc.
This page can be reached from
Banner > Alert
Fig 9: Alert Page
User Manual
19
Grid Monitoring Tool - Paryavekshanam
11 Search
Resources and Software can be searched using this search facility as shown
in Fig 10 below. The users can select resources based on hardware criteria
like operating system, availability of memory, number of CPUs etc. and
software criteria like availability of particular debugger, libraries, databases
etc. Software can be searched depending on the categories like debugger,
libraries, database etc. for various operating systems.
This page is accessed by clicking the search tab on the banner.
Banner > Search
Fig 10: Search Page
User Manual
20
Grid Monitoring Tool - Paryavekshanam
12 Job
The job page helps in searching jobs. The jobs can be queried based on their
status i.e. running / completed / queued / suspended etc. Jobs running /
queued / completed / suspended on a particular cluster, during a specified
period of time, can be listed by filling up the appropriate query. This feature
is very useful for grid users and grid managers.
This page can be reached from
Banner > Job
Fig 11: Job Page
User Manual
21
Grid Monitoring Tool - Paryavekshanam
13 Admin
This page can be accessed from the second line of the Banner.
Banner (second line) > Admin
Fig 12: Admin Page
Addition of the new centers and resources can be done through this tool (Fig
11). Deletion of sites, editing of resource details, VO is also supported. The
site management is fully access controlled by authorized administrators.
This feature is very useful to the grid administrators.
User Manual
22
Grid Monitoring Tool - Paryavekshanam
14 SRB
Storage on GARUDA grid is handled by Storage Resource Broker (SRB).
This page gives the details of storage i.e. free, used and total space on the
grid as well as the SRB server status.
The user can fine tune the query to fetch storage details for a specified
duration, on a user basis or for the entire grid. The storage details are
available in both numerical quantification (tabular) and graphical forms.
The pie chart displays the used and free grid storage. The bar chart indicates
the SRB server status for past seven days.
This page is reached from
Paryavekshanam Home Page > Status Bar > SRB
Fig 13: SRB Page
User Manual
23
Grid Monitoring Tool - Paryavekshanam
15 Frequently Asked Questions
1.
How can the Grid Monitoring Tool be invoked?
The Garuda Grid monitoring Tool called “Paryavekshanam” can be invoked
in any web browser of a system which is connected to the grid by using the
following URL: http://192.168.60.70/gridmon/GRID/gridmon.php. It can
also be accessed from Grid Portal page
(http://192.168.60.40:8080/GridPortal/index.jsp)
by
clicking
on
the
Paryavekshanam link.
2.
Is a login required to use this tool?
No login is required to use this tool in order to observe the status of the grid
resources.
3.
Do administrators require special logins to use this tool?
Administrator logins need to be used when faults have to be rectified at the
local centers.
4.
Is login required to Add/Edit centers or clusters?
Yes, only authenticated users can add/edit the centers and cluster details
5.
What is the task of the Grid Operations Center (GOC)?
The important task of the Grid operation Center is to monitor (observe) all
the critical components of the Garuda Grid on a 24X7 basis, and detect any
malfunctioning. A first level fault analysis can be carried out and the
concerned local center will be informed / alerted to rectify the problem
immediately.
User Manual
24
Grid Monitoring Tool - Paryavekshanam
6.
How will the problems be communicated from the GOC to the
Administrators at the local centers?
When a fault is observed, the GOC will contact the system administrator of
the concerned local center by e-mail, telephone, SMS or fax. The local
administrator should acknowledge the same and correct the problem.
7.
What are the links available on gridmon page?
1.
In banner all the text are linked
2.
In India map all the operational buttons of the locations are linked
to respective city pages.
3.
The Links [Up and Down] text of Status Bar links to Network
Overview Page.
4.
The links of Nodes [Up and Down], Clusters [Up and Down] and
memory [free and Used] links to the tabular view the
8.
What is radar graph and what it signifies?
It is also known as star or spider graph, is laid out in circular fashion. Radar
graph consists of axis lines that start in the center of a circle and extend to
its periphery. First axis is always vertical. Each axis represents parameter to
be measured and they are expected to be positive in nature.
Radar graph is used to specify uniform utilization of the values. The ideal
graph on plotting the values is a circle at 100%. It represents the parameter
values in percent. Graph plotted represents the status of the utilization of
resources.
User Manual
25
Grid Monitoring Tool - Paryavekshanam
9.
What does the tool tip of the linked cities represent?
The tool tip on each city represents the centers and also queued and running
jobs attached to grid in that particular city.
10. What does the different colored buttons on India map represent?
The color represents the grid strength of the city.
11. What are the links available on GridSummary page?
1.
The text ‘Representation in units’ is linked to page that contains
the values in their respective Units.
2.
The Location names (E.g.: Bangalore, C-DAC Pune) are linked to
respective locations detailed report.
12. What are the values in the table?
This is the textual percentage representation of the parameters present in
radar graph.
It represents the values city and centerwise.
13. What are the links available on GridSummaryUnits page?
1.
The text ‘Representation in percent’ is linked to page that contains
the values in their respective Units.
2.
The Location names (Eg: Bangalore, C-DAC Pune) are linked to
respective locations detailed report.
14. What does the tables describe?
Grid Information:
User Manual
26
Grid Monitoring Tool - Paryavekshanam
This contains city or centerwise values in their respective Units as
mentioned .The factors monitored are bandwidth used, total bandwidth,
number of running and queued jobs, total number of jobs, cpu load, used
memory, total memory, number of active users, globus strength.
Nodal Information:
This contains city or centerwise count of nodes up and total number of
nodes for the grid. It monitors Solaris, Linux, and AIX cluster and total
number of nodes for that center or city.
15. How is Globus strength calculated in gridSummary page?
The four pillars of Globus that is Security, Resource management, Data
management and Information Services has been assigned a distinct weight
as follows which sums as 29:
Security
10
Resource management
8
Data management
7
Information Services
4
-----------------------------------------29
Example, if Globus Strength is 21, which means Security, Data
Management and Information Service are up and job submission, is not
possible.
User Manual
27
Grid Monitoring Tool - Paryavekshanam
16. What are the links available on City page?
The icons on the map are linked to their respective centers.
17. What does the text under the icon in the city page represent?
It contains number of nodes of each cluster available on grid from that
center.
Note: The map represented here is not to scale.
18. What are the links available on NodalCentre page?
1.
The text Computing Nodes is linked to ganglia page for that center.
2.
The text AIX Cluster, Linux Cluster and Solaris Cluster are linked
to ganglia page for that cluster.
3.
All the nodes that shows Node up icon in Computing Nodes is
linked to ganglia page of that particular node.
4.
The column headings (E.g.: Authentication) in Globus Component
Status table is linked to page which explains what name specifies.
19. What does Globus Component Status block describe?
It contains a table that summarizes the status of globus components for each
cluster in this center. Then it contains a detailed report of tests performed on
the head node of each cluster. Report contains the result of the test and
reason if the test has failed.
User Manual
28
Grid Monitoring Tool - Paryavekshanam
20. What is meant by Installed Packages?
This block contains the software packages installed on this center of the
grid. It contains the name and version of the package installed. This block is
refreshed daily once.
21. What is GOC page?
This page represents the aggregate value of the parameters like bandwidth
utilization, network stability, used memory, node availability, CPU
utilization, running jobs, queued jobs, active users, globus strength of the
resource provider centers.
22. What are resource providing centers?
Resource providing centers are the one, which provide computing resource
to grid.
23. What are the links available on GOC page?
Each of the line graphs is linked to centerwise graph representation for that
particular factor.
The text “Representation in Units” is linked to representation of the units in
line graphs.
24. What does the table in GOC page represents?
The table represents the values for every ten minutes, which is sampled. It
also represents the maximum and minimum values.
25. What does the graphs describe?
The graph plots percentage values for the parameters. The graph is plotted
against time for 23 hours (i.e. 12 am to 11 pm today).
User Manual
29
Grid Monitoring Tool - Paryavekshanam
26. What is the interval of time between two values?
1.
For network utilization, bandwidth Utilization, memory utilization,
cpu utilization, node utilization are plotted for every 10 minutes.
2.
Running jobs, queued jobs, active users are plotted for every 20
minutes.
3.
Globus strength is plotted hourly once.
27. Are there any links present on GocCentrewise page?
No.
28. Are there any links present on Archive or data Gallery page?
On clicking the calendar icon a calendar appears.
29. How to choose the options and which option for what?
The radio buttons duration and date are grouped together so they
complement each other. The Date To is enabled only for duration whereas
Date From is enabled for both duration and date.
Grid Average At Centers, Centerwise Grid Average, Overall Grid Average
are grouped together.
1.
Centerwise Grid Average represents all the parameters in graphical
way per center (i.e. one graph per center).
2.
Grid Average At Centers represents the percentage values in
tabular format for the center selected. For duration it gives values
per day and for date hourly.
3.
Overall Grid Average is similar to Grid Average At Centers but the
values represented for whole grid.
User Manual
30
Grid Monitoring Tool - Paryavekshanam
30. Is there any search facility available?
There are two types of search:
1.
Resource search: This gives information of the resources such as
free and used memory, CPU speed, Operating system, Number of
processors for each node.
2.
Software search: This gives information of the software packages.
Selecting the operating system and category, the software names
can be viewed which is installed on each head node.
31. What is the use of admin page?
The registered user can login through this page and if the login is successful,
admin page links to the page where the new center or cluster can be added.
The center or cluster details can be viewed/edited or updated from this page.
32. What is the use of Alert Page?
Alert overview helps in finding and tracking all the error messages
generated by the system. Based on the status of the messages, error Id, date
raised on etc can be tabulated.
33. What is the use of status bar?
The status bar gives the instantaneous figure of various resources like nodes,
cluster, link, memory, cpu load etc.
34. What is “New Alerts” box in the home page?
The “New Alerts” box in the home page gives the information of the recent
five alerts for which status is open along with the error code and center
name. The table is refreshed for each ten minutes.
User Manual
31
Grid Monitoring Tool - Paryavekshanam
35. What is Job page?
Job page shows the detail information of jobs running, queued and pending
jobs with respect to owners and the clusters.
36. What is the SRB link in the status bar??
The link takes to the page where SRB server status is shown with the disk
usage statistics.
37. What is view Alerts page?
This page gives the information of the alerts depending on the various
criteria’s like owner, status etc.
38. Does the information of nodes or cluster can be viewed in the
nodalCentre page?
The tool tip of each node gives the information about the Ip address, CPU
speed, Total RAM, free RAM available currently.
39. Which page takes to the NodalCentre page?
The link on the centers of the cities from grid Overview page takes to nodal
Centre page.
41. How can I know the Version of Paryavekshanam?
The version of Paryavekshanam can be viewed by clicking on About Us text
in the Banner.
User Manual
32