1
Data Analysis and Export
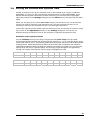
5.1.3 Graphing and Sorting Data
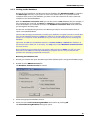
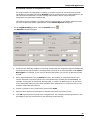
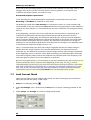
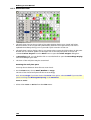
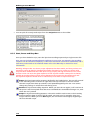
Selecting multiple sweeps and overlay
You can redefine the region of interest or add a comment for each recording separately, or for
multiple recordings at once.
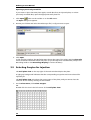
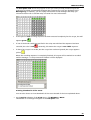
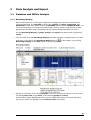
1. Select a recording by clicking on it in the result list.
Selected recordings are highlighted in blue.
2. Hold down the SHIFT key and press PAGE UP or PAGE DOWN to select multiple recordings, or
select multiple recordings with the mouse.
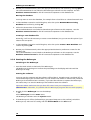
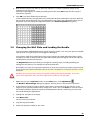
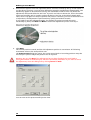
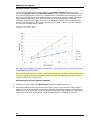
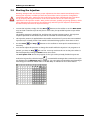
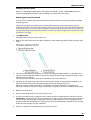
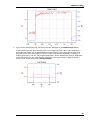
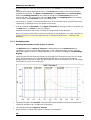
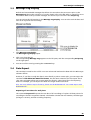
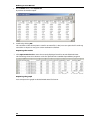
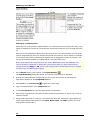
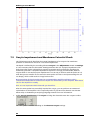
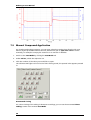
All selected recordings are overlaid in the graph, each sweep in a different color. Information
that is applicable to all selected recordings is displayed on the left pane. Other boxes appear
blank. You can now change the baseline or region of interest, or enter a comment for all
selected recordings at once.
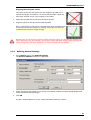
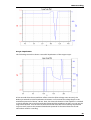
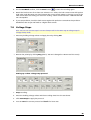
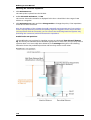
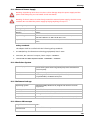
Displaying the holding potential
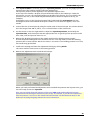
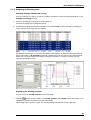
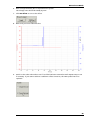
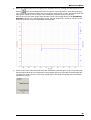
You can show the Clamp Control curve in the graph.
→ Click the
button on the toolbar or click Leak Control on the View menu. This option is not
available if you have selected more than one sweep.
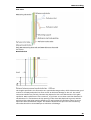
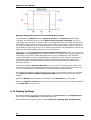
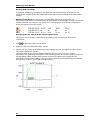
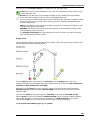
The voltage trace is shown in gray. The corresponding axis appears on the right side.
63