1
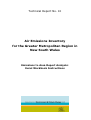
Technical Report No. 10 Air Emissions Inventory for the Greater Metropolitan Region in New South Wales Emissions to Area Report Analysis: Excel Workbook Instructions ACKNOWLEDGEMENTS This study was carried out with the assistance of organisations and individuals who should be recognised for their efforts. Many thanks to the NSW Environmental Trust and Commonwealth Department of the Environment and Water Resources for providing the Department of Environment and Climate Change NSW (DECC) with funding to complete the study. DECC would like to thank Mr. Nick Agapides (DECC) for preparing these instructions and the accompanying Microsoft® Excel™ 2003 workbooks. Published by: Department of Environment and Climate Change NSW 59–61 Goulburn Street PO Box A290 Sydney South 1232 Phone: (02) 9995 5000 (switchboard) Phone: 131 555 (environment information and publications requests) Phone: 1300 361 967 (national parks information and publications requests) Fax: (02) 9995 5999 TTY: (02) 9211 4723 Email: [email protected] Website: www.environment.nsw.gov.au In April 2007 the Department of Environment and Conservation NSW became known as the Department of Environment and Climate Change NSW. This material may be reproduced in whole or in part, provided the meaning is unchanged and the source is acknowledged. ISBN 978 1 74122 834 2 DECC 2008/260 May 2008 Air Emissions Inventory for the Greater Metropolitan Region in New South Wales Table of Contents Table of Contents 1 INTRODUCTION .................................................................................................... 1-1 2 USING THE EXCEL™ WORKBOOK .......................................................................... 2-1 2.1 DOWNLOAD AND INSTALL WORKBOOK AND INSTRUCTIONS .......................................................2-1 2.1.1 Create Directory .............................................................................................2-1 2.1.2 Download Workbook and Instructions ................................................................2-2 2.1.3 Extract Workbook ...........................................................................................2-2 2.2 USING THE WORKBOOK ..............................................................................................2-3 2.2.1 Open Workbook..............................................................................................2-3 2.2.2 Enable Macros ................................................................................................2-4 2.2.3 Macro Security Settings ...................................................................................2-5 2.2.4 Password Protection ........................................................................................2-8 2.2.5 Saving Changes..............................................................................................2-9 2.3 NAVIGATE THE WORKBOOK ........................................................................................ 2-11 2.3.1 Excel Workbook Structure .............................................................................. 2-11 2.3.2 Using Built-In Hyperlinks and Macros ............................................................... 2-12 2.3.3 Using Worksheet Tabs ................................................................................... 2-16 2.4 USING AND INTERPRETING EXISTING PIVOT TABLE REPORTS................................................... 2-17 2.4.1 Example 1 – Using Pivot Table Reports ............................................................ 2-17 2.4.2 Example 2 – Interpreting Pivot Table Reports.................................................... 2-22 2.5 CREATING NEW PIVOT TABLE REPORTS........................................................................... 2-24 2.5.1 2.6 USING AND INTERPRETING EXISTING PIVOT CHART REPORTS .................................................. 2-41 2.6.1 Example 4 – Using Pivot Chart Reports ............................................................ 2-41 2.6.2 Example 5 – Interpreting Pivot Chart Reports ................................................... 2-45 2.7 CREATING NEW PIVOT CHART REPORTS .......................................................................... 2-47 2.7.1 3 Example 3 – Creating Pivot Table Reports ........................................................ 2-24 Example 6 – Creating Pivot Chart Reports ........................................................ 2-47 REFERENCES......................................................................................................... 3-1 i Emissions to Area Report Analysis: Excel Workbook Instructions List of Tables List of Tables Table 1.1 Definition of Greater Metropolitan, Sydney, Newcastle and Wollongong regions ..1-1 Table 2.1 Example 3 – Formatted Word™ Table ......................................................... 2-40 ii Air Emissions Inventory for the Greater Metropolitan Region in New South Wales List of Figures List of Figures Figure 1.1 Definition of Greater Metropolitan, Sydney, Newcastle and Wollongong regions ..1-2 Figure 2.1 Create directory “C:\\nsw_gmr_aei_2003” ....................................................2-1 Figure 2.2 Extract “tr10aei08260cp.xls”.......................................................................2-2 Figure 2.3 Open Workbook “tr10aei08260cp.xls”...........................................................2-3 Figure 2.4 Select “Enable Macros”...............................................................................2-4 Figure 2.5 Select “Tools” and “Options” .......................................................................2-5 Figure 2.6 Select “Security” and “Macro Security” .........................................................2-6 Figure 2.7 Select “Security Level” and “Medium” ...........................................................2-7 Figure 2.8 Select “Read Only” ....................................................................................2-8 Figure 2.9 Select “File” and “Save As” .........................................................................2-9 Figure 2.10 Select “Save”.......................................................................................... 2-10 Figure 2.11 Select “Data Description” Worksheet .......................................................... 2-11 Figure 2.12 Select “Web” Toolbar ............................................................................... 2-12 Figure 2.13 Select “Table 1.1”.................................................................................... 2-13 Figure 2.14 Go Back using “Web” Toolbar .................................................................... 2-14 Figure 2.15 Select “Chart 1.1” ................................................................................... 2-15 Figure 2.16 Go Back using “Data Description” Worksheet Tab ......................................... 2-16 Figure 2.17 Example 1 - Navigate to “Table 7.1” Worksheet ........................................... 2-17 Figure 2.18 Example 1 - Select “LGA” ......................................................................... 2-18 Figure 2.19 Example 1 - Select “Substance”................................................................. 2-19 Figure 2.20 Example 1 - Pivot Table Report ................................................................. 2-20 Figure 2.21 Example 1 - Pivot Table Report with all LGAs Selected .................................. 2-21 Figure 2.22 Example 2 - Navigate to “Table 7.2” Worksheet ........................................... 2-22 Figure 2.23 Example 2 - Pivot Table Report with all LGAs Selected .................................. 2-23 Figure 2.24 Example 3 – Navigate to “2003 Annual Emissions” Worksheet........................ 2-24 iii Emissions to Area Report Analysis: Excel Workbook Instructions List of Figures Figure 2.25 Example 3 – Select “Data” and “PivotTable and PivotChart Report” ................. 2-25 Figure 2.26 Example 3 – Select “Microsoft Office Excel list or database” and “PivotTable” ... 2-26 Figure 2.27 Example 3 – Select “Range”...................................................................... 2-27 Figure 2.28 Example 3 – Select “No”........................................................................... 2-28 Figure 2.29 Example 3 – Select “Layout” ..................................................................... 2-29 Figure 2.30 Example 3 – Pivot Table Layout Wizard....................................................... 2-30 Figure 2.31 Example 3 – Drag “Field Button”................................................................ 2-31 Figure 2.32 Example 3 – Select “PivotTable Field” ......................................................... 2-32 Figure 2.33 Example 3 - Select “Options” .................................................................... 2-33 Figure 2.34 Example 3 – Uncheck “Format Options” ...................................................... 2-34 Figure 2.35 Example 3 – Select “Finish” ...................................................................... 2-35 Figure 2.36 Example 3 – Unformatted Pivot Table Report ............................................... 2-36 Figure 2.37 Example 3 – Select “Order”....................................................................... 2-37 Figure 2.38 Example 3 - Select “Format” and “Cells” ..................................................... 2-38 Figure 2.39 Example 3 – Select “Type”........................................................................ 2-39 Figure 2.40 Example 3 – Formatted Pivot Table Report .................................................. 2-40 Figure 2.41 Example 4 - Navigate to “Chart 7.1” Worksheet ........................................... 2-41 Figure 2.42 Example 4 - Select “LGA” ......................................................................... 2-42 Figure 2.43 Example 4 - Select “Substance”................................................................. 2-43 Figure 2.44 Example 4 - Pivot Chart Report ................................................................. 2-44 Figure 2.45 Example 5 - Navigate to “Chart 7.2” Worksheet ........................................... 2-45 Figure 2.46 Example 5 - Pivot Chart Report with all LGAs Selected .................................. 2-46 Figure 2.47 Example 6 - Navigate to “Table 1.1” Worksheet ........................................... 2-47 Figure 2.48 Example 6 – Select “View”, “Toolbars” and “PivotTable” ................................ 2-48 Figure 2.49 Example 6 – Select “Chart Wizard”............................................................. 2-49 Figure 2.50 Example 6 – Pivot Chart Report with no Selections ....................................... 2-50 Figure 2.51 Example 6 – Pivot Chart Report with Selections ........................................... 2-51 Figure 2.52 Example 6 - Select “Chart Type”................................................................ 2-52 iv Air Emissions Inventory for the Greater Metropolitan Region in New South Wales List of Figures Figure 2.53 Example 6 – Select “Add” ......................................................................... 2-53 Figure 2.54 Example 6 – Enter “Name” and “Description”............................................... 2-54 Figure 2.55 Example 6 – Select “Custom Types” and “User-defined” ................................ 2-55 Figure 2.56 Example 6 – Select “Pivot Chart v1” ........................................................... 2-56 Figure 2.57 Example 6 – Select “Format Axis” .............................................................. 2-57 Figure 2.58 Example 6 - Select “Scale”........................................................................ 2-58 Figure 2.59 Example 6 – Formatted Pivot Chart Report.................................................. 2-59 Figure 2.60 Example 6 – “Hide PivotChart Field Buttons” ............................................... 2-60 Figure 2.61 Example 6 – Formatted Word™ Chart......................................................... 2-61 v Air Emissions Inventory for the Greater Metropolitan Region in New South Wales 1. Introduction 1 INTRODUCTION The Department of Environment and Climate Change NSW (DECC) has completed a three year air emissions inventory project (DECC, 2007a; DECC, 2007b; DECC, 2007c; DECC, 2007d; DECC, 2007e; DECC, 2007f; DECC, 2007g; DECC, 2007h; & DECC, 2007i). The base year of the inventory represents activities that took place during the 2003 calendar year and is accompanied by emission projections in yearly increments up to the 2031 calendar year. The area included in the study covers greater Sydney, Newcastle and Wollongong regions, known collectively as the Greater Metropolitan Region (GMR). The study region defined as the GMR measures 210 km (east-west) by 273 km (north-south). The study region is defined in Table 1.1 and shown in Figure 1.1. Table 1.1 Definition of Greater Metropolitan, Sydney, Newcastle and Wollongong regions Region South-west corner MGA1 co-ordinates North-east corner MGA1 co-ordinates Easting (km) Northing (km) Easting (km) Northing (km) GREATER METROPOLITAN 210 6159 420 6432 SYDNEY 261 6201 360 6300 NEWCASTLE 360 6348 408 6372 WOLLONGONG 279 6174 318 6201 1 MGA = Map Grid of Australia based on the Geocentric Datum of Australia 1994 (GDA94) (ICSM, 2002). The air emissions inventory includes emissions from biogenic (i.e. natural) and anthropogenic (i.e. human derived) sources. The anthropogenic source groups included in the air emissions inventory are as follows: Commercial businesses (i.e. non-EPA-licensed); Domestic-commercial activities; Industrial premises (i.e. EPA-licensed); Off-road mobile (i.e. non-registered off-road vehicles and equipment); and On-road mobile (i.e. registered on-road vehicles). The pollutants inventoried include criteria pollutants specified in the Ambient Air Quality NEPM (NEPC, 2003), air toxics associated with the National Pollutant Inventory (NPI) NEPM (NEPC, 2000) and the Air Toxics NEPM (NEPC, 2004) and any other pollutants associated with state specific programs, including: Load Based Licensing (Protection of the Environment Operations (General) Regulation 1998 (PCO, 1998)); and Protection of the Environment Operations (Clean Air) Regulation 2002 (PCO, 2005). This document contains instructions that explain the navigation and use of the accompanying Microsoft® Excel™ 2003 workbooks. While the instructions specifically relate to the Excel™ workbook tr10aei08260cp.xls (which is based on an Emissions to Area Report for criteria pollutants in the GMR during 2003 that has been extracted from the Emissions Data Management System (EDMS v1.0) (DECC, 2008)), the principles can easily be applied to the Excel™ workbooks for other air pollutants groups. 1-1 Emissions to Area Report Analysis: Excel Workbook Instructions 1. Introduction The EDMS v1.0 is an overarching air emissions inventory database that links to individual sourcespecific databases comprising all the data necessary to service policy and technical related queries. The EDMS uses the Microsoft® SQL Server 2005™ relational database management system (Microsoft, 2008) which is a comprehensive, integrated data management and analysis software package. Figure 1.1 1-2 Definition of Greater Metropolitan, Sydney, Newcastle and Wollongong regions Air Emissions Inventory for the Greater Metropolitan Region in New South Wales 2. Using the Excel Workbook 2 USING THE EXCEL™ WORKBOOK This document contains instructions that explain the navigation and use of the accompanying Microsoft® Excel™ 2003 workbooks. While the instructions specifically relate to the Excel™ workbook tr10aei08260cp.xls (which is based on an Emissions to Area Report for criteria pollutants in the GMR during 2003 that has been extracted from the Emissions Data Management System (EDMS v1.0) (DECC, 2008)), the principles can easily be applied to the Excel™ workbooks for other air pollutants groups. 2.1 Download and Install Workbook and Instructions 2.1.1 Create Directory Open Windows Explorer and create a new directory on your computer hard drive (e.g. C:\\nsw_gmr_aei_2003\) by selecting “File”, “New” and “Folder” from the command menu as shown in Figure 2.1. Figure 2.1 Create directory “C:\\nsw_gmr_aei_2003\” 2-1 Emissions to Area Report Analysis: Excel Workbook Instructions 2. Using the Excel Workbook 2.1.2 Download Workbook and Instructions Download the .pdf file containing these instructions and the .zip file containing the Excel™ workbook from the following web links and save to the directory created: http://www.environment.nsw.gov.au/resources/air/tr10aei08260.pdf http://www.environment.nsw.gov.au/resources/air/tr10aei08260cp.zip 2.1.3 Extract Workbook Extract the following file from the .zip file to the directory created: tr10aei08260cp.xls - Excel™ workbook To extract the file, double left mouse button click the .zip file, highlight the file listed above, select “Extract” from the command menu, select the directory to “Extract to” in the window and select the “Extract” button as shown in Figure 2.2. Figure 2.2 Extract “tr10aei08260cp.xls” Ensure the Excel™ workbook and these instructions are contained in the same directory so you can navigate to the instructions from the Excel™ workbook. 2-2 Air Emissions Inventory for the Greater Metropolitan Region in New South Wales 2. Using the Excel Workbook 2.2 Using the Workbook 2.2.1 Open Workbook Open Windows Explorer and navigate to the Excel™ workbook at C:\\nsw_gmr_aei_2003\ tr10aei08260cp.xls. Double left mouse button click the Excel™ workbook file as shown in Figure 2.3. Figure 2.3 Open Workbook “tr10aei08260cp.xls” 2-3 Emissions to Area Report Analysis: Excel Workbook Instructions 2. Using the Excel Workbook 2.2.2 Enable Macros A “Security Warning” dialog box will now appear, which allows you to select from the following options: Disable Macros Enable Macros More Info Select “Enable Macros” as shown in Figure 2.4. Figure 2.4 2-4 Select “Enable Macros” Air Emissions Inventory for the Greater Metropolitan Region in New South Wales 2. Using the Excel Workbook 2.2.3 Macro Security Settings You may need to adjust your Excel™ macro security settings to run the macros built into the Excel™ Workbook. If necessary, follow the steps below: Step 1 - Select “Tools” and “Options” from the command menu as shown in Figure 2.5 Figure 2.5 Select “Tools” and “Options” 2-5 Emissions to Area Report Analysis: Excel Workbook Instructions 2. Using the Excel Workbook Step 2 - Select the “Security” tab and “Macro Security” button as shown in Figure 2.6 Figure 2.6 2-6 Select “Security” and “Macro Security” Air Emissions Inventory for the Greater Metropolitan Region in New South Wales 2. Using the Excel Workbook Step 3 - Select the “Security Level” tab and “Medium” radio button as shown in Figure 2.7 Figure 2.7 Select “Security Level” and “Medium” Step 4 - Select the “OK” button twice 2-7 Emissions to Area Report Analysis: Excel Workbook Instructions 2. Using the Excel Workbook 2.2.4 Password Protection The Excel™ workbook is write-protected to ensure the data cannot be overwritten and requires a password to modify it. When the “Password” dialog box appears, select the “Read Only” button as shown in Figure 2.8. Figure 2.8 2-8 Select “Read Only” Air Emissions Inventory for the Greater Metropolitan Region in New South Wales 2. Using the Excel Workbook 2.2.5 Saving Changes If you wish to save any changes to the Excel™ workbook, select “File” and “Save As” from the command menu as shown in Figure 2.9, use a different file name and select the “Save” button as shown in Figure 2.10. Figure 2.9 Select “File” and “Save As” 2-9 Emissions to Area Report Analysis: Excel Workbook Instructions 2. Using the Excel Workbook Figure 2.10 Select “Save” 2-10 Air Emissions Inventory for the Greater Metropolitan Region in New South Wales 2. Using the Excel Workbook 2.3 Navigate the Workbook 2.3.1 Excel Workbook Structure The Excel™ workbook is based on an Emissions to Area Report for the GMR in 2003 that has been extracted from the Emissions Data Management System (EDMS v1.0) (DECC, 2008). The Excel™ workbook contains a “Data Description” worksheet that includes in-built or macro hyperlinks to the following: Instructions: These instructions 2003 Annual Emissions: Emissions to Area Report for the GMR in 2003 Table x.x: 14 Interactive pivot table reports Chart x.x: 14 Interactive pivot chart reports The contents of the Excel™ workbook can be viewed by left mouse button clicking on the “Data Description” worksheet tab as shown in Figure 2.11. Figure 2.11 Select “Data Description” Worksheet 2-11 Emissions to Area Report Analysis: Excel Workbook Instructions 2. Using the Excel Workbook 2.3.2 Using Built-In Hyperlinks and Macros To assist in navigating the Excel™ workbook, you may need to switch on the “Web” toolbar. To switch on the “Web” toolbar, select “View”, “Toolbars” and “Web” from the command menu as shown in Figure 2.12. Figure 2.12 Select “Web” Toolbar 2-12 Air Emissions Inventory for the Greater Metropolitan Region in New South Wales 2. Using the Excel Workbook To select a table, left mouse button click the “Data Description” worksheet tab, move to the cell required and left mouse button click the built-in hyperlink. An example selection for Table 1.1 is shown in Figure 2.13. Figure 2.13 Select “Table 1.1” 2-13 Emissions to Area Report Analysis: Excel Workbook Instructions 2. Using the Excel Workbook To go back to the “Data Description” worksheet, left mouse button click the “back” web toolbar as shown in Figure 2.14. Figure 2.14 Go Back using “Web” Toolbar 2-14 Air Emissions Inventory for the Greater Metropolitan Region in New South Wales 2. Using the Excel Workbook To select a chart, left mouse button click the “Data Description” worksheet tab, either move to the cell required or left mouse button click the macro hyperlink. An example selection for Chart 1.1 is shown in Figure 2.15. Figure 2.15 Select “Chart 1.1” 2-15 Emissions to Area Report Analysis: Excel Workbook Instructions 2. Using the Excel Workbook To go back to the “Data Description” worksheet, left mouse button click the “Data Description” worksheet tab as shown in Figure 2.16. Figure 2.16 Go Back using “Data Description” Worksheet Tab 2.3.3 Using Worksheet Tabs Rather than using the in-built or macro hyperlinks to navigate the Excel™ workbook, you may choose to left mouse button click on any of the worksheet tabs instead to access the relevant information. 2-16 Air Emissions Inventory for the Greater Metropolitan Region in New South Wales 2. Using the Excel Workbook 2.4 Using and Interpreting Existing Pivot Table Reports 2.4.1 Example 1 – Using Pivot Table Reports Example 1 investigates the use of Table 7.1 in the Excel™ workbook. Table 7.1 contains an annual emissions pivot table report by LGA, module and activity during 2003 in kg/year. Start by navigating to the “Table 7.1” worksheet using any of the methods described previously as shown in Figure 2.17. Figure 2.17 Example 1 - Navigate to “Table 7.1” Worksheet The pivot table contains drop-down menus that allow you to make the following selections: Local Government Area (LGA) (e.g. Ashfield) Module_Name (i.e. Biogenic, Commercial, Domestic-Commercial, Industrial, Off-Road Mobile and On-Road Mobile) Activity (e.g. Automotive Fuel Retailing) Substance (e.g. CARBON MONOXIDE) 2-17 Emissions to Area Report Analysis: Excel Workbook Instructions 2. Using the Excel Workbook In Example 1, the following selections have been made using the drop-down menus: LGA - Ashfield Module_Name - All Activity - All Substance – TOTAL VOCS The steps required to do this are described below: Step 1 – Select the “LGA” drop-down menu, uncheck the “(Show All)” box and check the “Ashfield” box as shown in Figure 2.18 Figure 2.18 Example 1 - Select “LGA” Step 2 – Select the “Module_Name” drop-down menu – No selections are required because all are checked by default Step 3 – Select the “Activity” drop-down menu - No selections are required because all are checked by default 2-18 Air Emissions Inventory for the Greater Metropolitan Region in New South Wales 2. Using the Excel Workbook Step 4 - Select the “Substance” drop-down menu, uncheck the “(Show All)” box and check the “TOTAL VOCS” box as shown in Figure 2.19 Figure 2.19 Example 1 - Select “Substance” 2-19 Emissions to Area Report Analysis: Excel Workbook Instructions 2. Using the Excel Workbook After making these selections, the Example 1 pivot table report will look like that shown in Figure 2.20. Figure 2.20 Example 1 - Pivot Table Report You should note that Chart 7.1 is based on Table 7.1, so the information presented in the chart will also be modified according to these selections. Refer to Example 4 (Section 2.6.1), which shows the accompanying changes to the chart. You should exercise care when interpreting the results of the pivot table report. In Example 1 (Section 2.4.1), the value “GMR Total” is in fact the total for the selection being made. If all LGAs are selected, the TOTAL VOCS emissions would be 363,665,792 kg/year as shown in Figure 2.21, rather than 1,241,381 kg/year if Ashfield were selected as shown in Figure 2.20. 2-20 Air Emissions Inventory for the Greater Metropolitan Region in New South Wales 2. Using the Excel Workbook Figure 2.21 Example 1 - Pivot Table Report with all LGAs Selected 2-21 Emissions to Area Report Analysis: Excel Workbook Instructions 2. Using the Excel Workbook 2.4.2 Example 2 – Interpreting Pivot Table Reports Extra care should be exercised when interpreting the results of the pivot table reports that present emissions as a proportion of the total. Example 2 investigates the use of Table 7.2 in the Excel™ workbook. Table 7.2 contains the proportion of annual emissions pivot table report by LGA, module and activity during 2003 in %. Start by navigating to the “Table 7.2” worksheet using any of the methods described previously and make the selections from the drop-down menus like Example 1 as shown in Figure 2.22. Figure 2.22 Example 2 - Navigate to “Table 7.2” Worksheet 2-22 Air Emissions Inventory for the Greater Metropolitan Region in New South Wales 2. Using the Excel Workbook You will notice the Ashfield Total and GMR Total are both 100%, since only the Ashfield LGA has been selected as shown in Figure 2.22. All other proportions shown in the pivot table report are proportions of annual emissions in Ashfield LGA only. However, if all LGAs are selected, you will notice the Ashfield Total and GMR Total are 0.34 % and 100% respectively as shown in Figure 2.23. All other proportions shown in the pivot table report are proportions of annual emissions in all LGAs (i.e. GMR). Figure 2.23 Example 2 - Pivot Table Report with all LGAs Selected 2-23 Emissions to Area Report Analysis: Excel Workbook Instructions 2. Using the Excel Workbook 2.5 Creating New Pivot Table Reports 2.5.1 Example 3 – Creating Pivot Table Reports Example 3 describes the steps required to create a pivot table report. Specifically, Table 1.1 in the Excel™ workbook will be created from first principals. Table 1.1 contains the annual emissions pivot table report by region and module during 2003 in kg/year. The steps required to do this are described below: Step 1 – Navigate to the “2003 Annual Emissions” worksheet as shown in Figure 2.24 Figure 2.24 Example 3 – Navigate to “2003 Annual Emissions” Worksheet 2-24 Air Emissions Inventory for the Greater Metropolitan Region in New South Wales 2. Using the Excel Workbook Step 2 - Select “Data” and “PivotTable and PivotChart Report” from the command menu as shown in Figure 2.25 Figure 2.25 Example 3 – Select “Data” and “PivotTable and PivotChart Report” 2-25 Emissions to Area Report Analysis: Excel Workbook Instructions 2. Using the Excel Workbook Step 3 – Select the “Microsoft Office Excel list or database” and “PivotTable” radio buttons as shown in Figure 2.26 and then select the “Next” button. You may also select the “PivotChart Report (with PivotTable report)” radio button at this point and complete both tasks at the same time. However, the steps required for creating a pivot chart report alone from a pivot table are separately discussed in Section 2.7 Figure 2.26 Example 3 – Select “Microsoft Office Excel list or database” and “PivotTable” 2-26 Air Emissions Inventory for the Greater Metropolitan Region in New South Wales 2. Using the Excel Workbook Step 4 – Select the “Range” of data according to the prompt “Where is the data that you want to use” as shown in Figure 2.27 and then select the “Next” button Figure 2.27 Example 3 – Select “Range” 2-27 Emissions to Area Report Analysis: Excel Workbook Instructions 2. Using the Excel Workbook Step 5 – Select whether you would like to base the new pivot table report on an existing pivot table report or not. If the primary data source of both pivot tables is the same, it is preferable to select the “Yes” button so the Excel™ workbook will take up less disk space. In this example, the “No” button has been selected to simplify the number of steps as shown in Figure 2.28 Figure 2.28 Example 3 – Select “No” 2-28 Air Emissions Inventory for the Greater Metropolitan Region in New South Wales 2. Using the Excel Workbook Step 6 – Select the pivot table report “Layout” button as shown in Figure 2.29 Figure 2.29 Example 3 – Select “Layout” 2-29 Emissions to Area Report Analysis: Excel Workbook Instructions 2. Using the Excel Workbook Step 7 – Construct the pivot table report by dragging the field button on the right to the diagram on the left as shown in Figure 2.30 and Figure 2.31 Figure 2.30 Example 3 – Pivot Table Layout Wizard 2-30 Air Emissions Inventory for the Greater Metropolitan Region in New South Wales 2. Using the Excel Workbook Figure 2.31 Example 3 – Drag “Field Button” 2-31 Emissions to Area Report Analysis: Excel Workbook Instructions 2. Using the Excel Workbook Step 8 – Double left mouse button click on the kg/year “Data” field button and then select the “Options” button. In the “Summarise by:” menu, select “Sum” and in the “Show data as:” menu, select “Normal”, then select the “OK” button twice as shown in Figure 2.32 Figure 2.32 Example 3 – Select “PivotTable Field” 2-32 Air Emissions Inventory for the Greater Metropolitan Region in New South Wales 2. Using the Excel Workbook Step 9 - Select the pivot table report “Options” button as shown in Figure 2.33 Figure 2.33 Example 3 - Select “Options” 2-33 Emissions to Area Report Analysis: Excel Workbook Instructions 2. Using the Excel Workbook Step 10 – Uncheck the “Grand total for columns”, “Grand totals for rows” and Auto format table” boxes and select the “OK” button as shown in Figure 2.34 Figure 2.34 Example 3 – Uncheck “Format Options” 2-34 Air Emissions Inventory for the Greater Metropolitan Region in New South Wales 2. Using the Excel Workbook Step 11 – Select the “Finish” button as shown in Figure 2.35 Figure 2.35 Example 3 – Select “Finish” 2-35 Emissions to Area Report Analysis: Excel Workbook Instructions 2. Using the Excel Workbook Step 12 - The completed pivot table report, which corresponds with Table 1.1 in the Excel™ workbook is shown in Figure 2.36 Figure 2.36 Example 3 – Unformatted Pivot Table Report 2-36 Air Emissions Inventory for the Greater Metropolitan Region in New South Wales 2. Using the Excel Workbook Step 13 – Change the order of the regions with Sydney, Newcastle, Wollongong and Non Urban from first to last. Move to the cell containing “Sydney” and right mouse button click. Select “Order” and “Move to Beginning” from the drop-down menus. Select the order for all other regions using the same method as shown in Figure 2.37 Figure 2.37 Example 3 – Select “Order” 2-37 Emissions to Area Report Analysis: Excel Workbook Instructions 2. Using the Excel Workbook Step 14 – Select the entire pivot table report and then select the custom number format created for the Excel™ workbook. To do this, select “Format” and “Cells” from the command menu as shown in Figure 2.38 Figure 2.38 Example 3 - Select “Format” and “Cells” 2-38 Air Emissions Inventory for the Greater Metropolitan Region in New South Wales 2. Using the Excel Workbook Step 15 – Select the “Number” tab and the “Category:” “Custom” from the list. Scroll down to the end of the “Type:” list and select the format “[>100]#,##0;[<0.01]#.#0E#0;0.00” for emissions in kg/year or the format “[>0.01]0.00%;[<0.00001]0.000000%;0.0000%” for proportion of emissions in % as shown in Figure 2.39. You may create other custom number formats. Please refer to “Help” in the command menu for further assistance Figure 2.39 Example 3 – Select “Type” 2-39 Emissions to Area Report Analysis: Excel Workbook Instructions 2. Using the Excel Workbook Step 16 – Select the desired cell “Alignment”, “Font”, “Borders” and “Patterns” according to Step 14. The final pivot table report will look like that shown in Figure 2.40. Please refer to “Help” in the command menu for further assistance Figure 2.40 Example 3 – Formatted Pivot Table Report Step 17 – Make the desired selections from the “Region” (e.g. Sydney), “Module_Name” (e.g. (Show All)) and “Substance” (e.g. TOTAL VOCS) drop-down menus as described in Example 1 (Section 2.4.1) Step 18 – Copy the table from the Excel™ workbook, past into a Word™ document if required and format as shown in Table 2.1 Table 2.1 Example 3 – Formatted Word™ Table Emissions (kg/year) Substance Region Module_Name Sydney Biogenic Commercial Sydney Total 2-40 TOTAL VOCS 33,988,648 9,931,259 Domestic-Commercial 52,008,753 Industrial 13,989,467 Off-Road Mobile 4,796,985 On-Road Mobile 50,171,664 164,886,777 Air Emissions Inventory for the Greater Metropolitan Region in New South Wales 2. Using the Excel Workbook 2.6 Using and Interpreting Existing Pivot Chart Reports 2.6.1 Example 4 – Using Pivot Chart Reports Example 4 investigates the use of Chart 7.1 in the Excel™ workbook. Chart 7.1 contains an annual emissions pivot chart report by LGA, module and activity during 2003 in kg/year. Start by navigating to the “Chart 7.1” worksheet using any of the methods described previously as shown in Figure 2.41. Figure 2.41 Example 4 - Navigate to “Chart 7.1” Worksheet The pivot chart contains drop-down menus that allow you to make the following selections: Local Government Area (LGA) (e.g. Ashfield) Module_Name (i.e. Biogenic, Commercial, Domestic-Commercial, Industrial, Off-Road Mobile and On-Road Mobile) Activity (e.g. Automotive Fuel Retailing) Substance (e.g. CARBON MONOXIDE) 2-41 Emissions to Area Report Analysis: Excel Workbook Instructions 2. Using the Excel Workbook In Example 4, the following selections have been made using the drop-down menus: LGA - Ashfield Module_Name - All Activity - All Substance – TOTAL VOCS The steps required to do this are described below: Step 1 – Select the “LGA” drop-down menu, uncheck the “(Show All)” box and check the “Ashfield” box as shown in Figure 2.42 Figure 2.42 Example 4 - Select “LGA” Step 2 – Select the “Module_Name” drop-down menu – No selections are required because all are checked by default Step 3 – Select the “Activity” drop-down menu - No selections are required because all are checked by default 2-42 Air Emissions Inventory for the Greater Metropolitan Region in New South Wales 2. Using the Excel Workbook Step 4 - Select the “Substance” drop-down menu, uncheck the “(Show All)” box and check the “TOTAL VOCS” box as shown in Figure 2.43 Figure 2.43 Example 4 - Select “Substance” 2-43 Emissions to Area Report Analysis: Excel Workbook Instructions 2. Using the Excel Workbook After making these selections, the Example 4 pivot chart report will look like that shown in Figure 2.44. Figure 2.44 Example 4 - Pivot Chart Report You should note that Chart 7.1 is based on Table 7.1, so the information presented in the table will also be modified according to these selections. Refer to Example 1 (Section 2.4.1), which shows the accompanying changes to the table. 2-44 Air Emissions Inventory for the Greater Metropolitan Region in New South Wales 2. Using the Excel Workbook 2.6.2 Example 5 – Interpreting Pivot Chart Reports Extra care should be exercised when interpreting the results of the pivot chart reports that present emissions as a proportion of the total. Example 5 investigates the use of Chart 7.2 in the Excel™ workbook. Chart 7.2 contains the proportion of annual emissions pivot chart report by LGA, module and activity during 2003 in %. Start by navigating to the “Chart 7.2” worksheet using any of the methods described previously and make the selections from the drop-down menus like Example 4 as shown in Figure 2.45. Figure 2.45 Example 5 - Navigate to “Chart 7.2” Worksheet 2-45 Emissions to Area Report Analysis: Excel Workbook Instructions 2. Using the Excel Workbook You will notice the Ashfield Total is 100%, since only the Ashfield LGA has been selected as shown in Figure 2.45. All other proportions shown in the pivot chart report are proportions of annual emissions in Ashfield LGA only. However, if all LGAs are selected, you will notice the Ashfield Total is 0.34 % as shown in Figure 2.46. All other proportions shown in the pivot chart report are proportions of annual emissions in all LGAs (i.e. GMR). Figure 2.46 Example 5 - Pivot Chart Report with all LGAs Selected 2-46 Air Emissions Inventory for the Greater Metropolitan Region in New South Wales 2. Using the Excel Workbook 2.7 Creating New Pivot Chart Reports 2.7.1 Example 6 – Creating Pivot Chart Reports Example 6 describes the steps required to create a pivot chart report. Specifically, Chart 1.1 in the Excel™ workbook will be created from first principals. Chart 1.1 contains the annual emissions pivot chart report by region and module during 2003 in kg/year. The steps required to do this are described below: Step 1 – Navigate to the “Table 1.1” worksheet and select any cell within the pivot table report as shown in Figure 2.47 Figure 2.47 Example 6 - Navigate to “Table 1.1” Worksheet 2-47 Emissions to Area Report Analysis: Excel Workbook Instructions 2. Using the Excel Workbook Step 2 - Select “View”, “Toolbars” and “PivotTable” from the command menu as shown in Figure 2.48. The “PivotTable” toolbar will now appear Figure 2.48 Example 6 – Select “View”, “Toolbars” and “PivotTable” 2-48 Air Emissions Inventory for the Greater Metropolitan Region in New South Wales 2. Using the Excel Workbook Step 3 – Select the “Chart Wizard” from the “PivotTable” toolbar as shown in Figure 2.49 Figure 2.49 Example 6 – Select “Chart Wizard” 2-49 Emissions to Area Report Analysis: Excel Workbook Instructions 2. Using the Excel Workbook Step 4 - The completed pivot chart report, which corresponds with Chart 1.1 in the Excel™ workbook is shown in Figure 2.50 Figure 2.50 Example 6 – Pivot Chart Report with no Selections 2-50 Air Emissions Inventory for the Greater Metropolitan Region in New South Wales 2. Using the Excel Workbook Step 5 – From the drop-down menus in the pivot chart report, make the following selections: o “Substance” – “TOTAL VOCS” o “Region” – “Sydney” o “Module_Name” – “(Show All)” You will now notice all the original formatting has been lost as shown in Figure 2.51. The loss of pivot chart report formatting will occur every time a new series of selections is made from the drop-down menu in a pivot table or pivot chart and is a well-known Excel™ shortcoming. One of the easiest ways to easily reapply the desired chart format is to develop a “User-defined” “Custom Type” and save it. This format can then be reapplied time after time quite easily Figure 2.51 Example 6 – Pivot Chart Report with Selections 2-51 Emissions to Area Report Analysis: Excel Workbook Instructions 2. Using the Excel Workbook Step 6 – Select the pivot chart report, right mouse button click and then select “Chart Type” as shown in Figure 2.52 Figure 2.52 Example 6 - Select “Chart Type” 2-52 Air Emissions Inventory for the Greater Metropolitan Region in New South Wales 2. Using the Excel Workbook Step 7 – At Chart 1.1, select the “Custom Types” tab and the “User-defined” radio button and press the “Add” button as shown in Figure 2.53. Enter the “Name” as “Pivot Chart v1” and “Description” as “Apply to: Charts 1.1 & 2.1” and press the “OK” button twice as shown in Figure 2.54. At Charts 1.2, 3.1 and 3.2, follow the same procedure and create “Pivot Chart v2” and “Apply to: Charts 1.2 and 2.2”, “Pivot Chart v3” and “Apply to: Charts 3.1, 4.1, 5.1, 6.1 and 7.1” and “Pivot Chart v4” and “Apply to: Charts 3.2, 4.2, 5.2, 6.2 and 7.2”. Pivot Chart v1 to Pivot Chart v4 will now be available for you to apply time after time. You may create other custom chart formats. Please refer to “Help” in the command menu for further assistance Figure 2.53 Example 6 – Select “Add” 2-53 Emissions to Area Report Analysis: Excel Workbook Instructions 2. Using the Excel Workbook Figure 2.54 Example 6 – Enter “Name” and “Description” 2-54 Air Emissions Inventory for the Greater Metropolitan Region in New South Wales 2. Using the Excel Workbook Step 8 – Select the “Custom Types” tab and the “User-defined” radio button as shown in Figure 2.55. Scroll down to the end of the “Chart type” list and select “Pivot Chart v1” for Charts 1.1 and 2.1, “Pivot Chart v2” for Charts 1.2 and 2.2, “Pivot Chart v3” for Charts 3.1, 4.1, 5.1, 6.1 and 7.1 and “Pivot Chart v4” for Charts 3.2, 4.2, 5.2, 6.2 and 7.2 and then select the OK button as shown in Figure 2.56 Figure 2.55 Example 6 – Select “Custom Types” and “User-defined” 2-55 Emissions to Area Report Analysis: Excel Workbook Instructions 2. Using the Excel Workbook Figure 2.56 Example 6 – Select “Pivot Chart v1” 2-56 Air Emissions Inventory for the Greater Metropolitan Region in New South Wales 2. Using the Excel Workbook Step 9 – You may wish to change the scale on the value axis. To do this, select the left vertical axis of the plot area, right mouse button click and select “Format Axis” as shown in Figure 2.57. Select the “Scale” tab and under “Value (y) axis scale” and “Auto”, uncheck the “Major unit:” box and insert “5000000” and select the OK button as shown in Figure 2.58 Figure 2.57 Example 6 – Select “Format Axis” 2-57 Emissions to Area Report Analysis: Excel Workbook Instructions 2. Using the Excel Workbook Figure 2.58 Example 6 - Select “Scale” 2-58 Air Emissions Inventory for the Greater Metropolitan Region in New South Wales 2. Using the Excel Workbook Step 10 - The final pivot chart report will now look like that shown in Figure 2.59. Please refer to “Help” in the command menu for further assistance Figure 2.59 Example 6 – Formatted Pivot Chart Report 2-59 Emissions to Area Report Analysis: Excel Workbook Instructions 2. Using the Excel Workbook Step 11 –You may wish to hide the pivot chart field buttons. To do this, select any of the pivot chart field buttons, right mouse button click and then select “Hide PivotChart Field Buttons” as shown in Figure 2.60 Figure 2.60 Example 6 – “Hide PivotChart Field Buttons” 2-60 Air Emissions Inventory for the Greater Metropolitan Region in New South Wales 2. Using the Excel Workbook Step 12 – Copy the chart from the Excel™ workbook, past into a Word™ document if required and format as shown in Figure 2.61 55,000,000 50,000,000 45,000,000 Annual Emissions (kg/year) 40,000,000 35,000,000 30,000,000 TOTAL VOCS 25,000,000 20,000,000 15,000,000 10,000,000 5,000,000 0 Biogenic Commercial Domestic-Commercial Industrial Off-Road Mobile On-Road Mobile Sydney Region Figure 2.61 Example 6 – Formatted Word™ Chart 2-61 Air Emissions Inventory for the Greater Metropolitan Region in New South Wales 3. References 3 REFERENCES DEC (2005), Approved Methods For the Modelling and Assessment of Air Pollutants in New South Wales, New South Wales Department of Environment and Conservation, Sydney, Australia. http://www.environment.nsw.gov.au/resources/ammodelling05361.pdf DECC (2007a), Air Emissions Inventory for the Greater Metropolitan Region in NSW, Air pollution where does it come from?, Department of Environment and Climate Change NSW, Sydney, NSW 2000, Australia. http://www.environment.nsw.gov.au/resources/air/aeibroc07335.pdf DECC (2007b), Air Emissions Inventory for the Greater Metropolitan Region in NSW, Criteria Pollutant Emissions for all Sectors: Results, Department of Environment and Climate Change NSW, Sydney, NSW 2000, Australia. http://www.environment.nsw.gov.au/resources/air/tr1aei0712.pdf DECC (2007c), Air Emissions Inventory for the Greater Metropolitan Region in NSW, Anthropogenic Ozone Precursors and Particle Emissions in the Greater Metropolitan and Sydney Regions: Results, Department of Environment and Climate Change NSW, Sydney, NSW 2000, Australia. http://www.environment.nsw.gov.au/resources/air/tr2aei07317.pdf DECC (2007d), Air Emissions Inventory for the Greater Metropolitan Region in NSW, Biogenic Emissions Module: Results, Department of Environment and Climate Change NSW, Sydney, NSW 2000, Australia. http://www.environment.nsw.gov.au/resources/air/tr3aei077.pdf DECC (2007e), Air Emissions Inventory for the Greater Metropolitan Region in NSW, Commercial Emissions Module: Results, Department of Environment and Climate Change NSW, Sydney, NSW 2000, Australia. http://www.environment.nsw.gov.au/resources/air/tr4aei078.pdf DECC (2007f), Air Emissions Inventory for the Greater Metropolitan Region in NSW, DomesticCommercial Emissions Module: Results, Department of Environment and Climate Change NSW, Sydney, NSW 2000, Australia. http://www.environment.nsw.gov.au/resources/air/tr5aei079.pdf DECC (2007g), Air Emissions Inventory for the Greater Metropolitan Region in NSW, Industrial Emissions Module: Results, Department of Environment and Climate Change NSW, Sydney, NSW 2000, Australia. http://www.environment.nsw.gov.au/resources/air/tr6aei0710.pdf DECC (2007h), Air Emissions Inventory for the Greater Metropolitan Region in NSW, Off-Road Mobile Emissions Module: Results, Department of Environment and Climate Change NSW, Sydney, NSW 2000, Australia. http://www.environment.nsw.gov.au/resources/air/tr7aei0711.pdf DECC (2007i), Air Emissions Inventory for the Greater Metropolitan Region in NSW, On-Road Mobile Emissions Module: Results, Department of Environment and Climate Change NSW, Sydney, NSW 2000, Australia. http://www.environment.nsw.gov.au/resources/air/tr8aei0713.pdf DECC (2008), Air Emissions Inventory for the Greater Metropolitan Region in New South Wales – Emissions Data Management System (EDMS v1.0) User’s Manual, Department of Environment and Climate Change NSW, Sydney, NSW 2000, Australia. . http://www.environment.nsw.gov.au/resources/air/tr9aei08181.pdf 3-1 Emissions to Area Report Analysis: Excel Workbook Instructions 3. References ICSM (2002), Geocentric Datum of Australia Technical Manual Version 2.2, Intergovernmental Committee on Surveying and Mapping, GPO Box 378, Canberra, ACT 2601, Australia. http://www.icsm.gov.au/icsm/gda/gdatm/gdav2.2.pdf Microsoft (2008), Microsoft® SQL Server 2005™. web page last accessed on 17th March 2008. http://www.microsoft.com/sql/default.mspx NEPC (2000), National Environment Protection (National Pollutant Inventory) Measure – As varied 20 June 2000, Environment Protection & Heritage Council, Adelaide, Australia. http://www.ephc.gov.au/pdf/npi/npivar_measure0600.pdf NEPC (2003), National Environment Protection (Ambient Air Quality) Measure – as varied May 2003 Environment Protection & Heritage Council, Adelaide, Australia. http://www.ephc.gov.au/pdf/Air_Quality_NEPM/air_nepm_as_varied0503scaleplus.pdf NEPC (2004), National Environment Protection (Air Toxics) Measure, Environment Protection & Heritage Council, Adelaide, Australia. http://www.ephc.gov.au/pdf/Air_Toxics/FinalAirToxicsNEPM.pdf PCO (1998), Protection of the Environment Operations (General) Regulation 1998, New South Wales Parliamentary Counsel's Office, Sydney, Australia. http://www.legislation.nsw.gov.au/viewtop/inforce/subordleg+720+1998+first+0+N PCO (2005), Protection of the Environment Operations (Clean Air) Regulation 2002, New South Wales Parliamentary Counsel's Office, Sydney, Australia. http://www.legislation.nsw.gov.au/viewtop/inforce/subordleg+642+2002+first+0+N 3-2