1
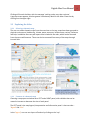
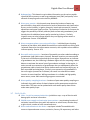
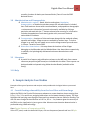
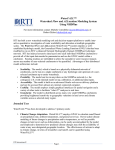
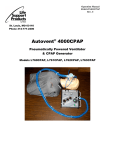
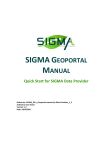
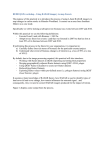
User Guide 2014 Water Resources Digital Atlas of the Wami and Ruvu River basins, Tanzania Digital Atlas User Manual 2 Contents 1. Objectives of the Digital Atlas ................................................................................................................... 4 2. Using the Digital Atlas ............................................................................................................................... 4 2.1 Installation: ......................................................................................................................................... 4 2.2 Launching the Atlas: ............................................................................................................................ 4 2.3 Exploring the Atlas: ............................................................................................................................. 5 2.3.1 Selecting a thematic map............................................................................................................. 5 2.3.2 Features of a thematic map ......................................................................................................... 5 3. Guide to the interpretation of maps and geospatial information ............................................................ 7 Atlas Menu structure: ............................................................................................................................... 7 3.1 File ................................................................................................................................................. 7 Save screenshot ............................................................................................................................ 7 Change language ........................................................................................................................... 7 Open popup window .................................................................................................................... 7 Exit................................................................................................................................................. 7 3.2 Landscape (Physical Features) ........................................................................................................... 7 Topography and Terrain Slope ...................................................................................................... 7 Geology and Soils .......................................................................................................................... 8 Surface Water Features ................................................................................................................ 9 Land cover ..................................................................................................................................... 9 3.3 Biodiversity/Forest Cover ................................................................................................................... 9 Forest reserves and national parks ............................................................................................... 9 Forest Cover Change ..................................................................................................................... 9 Mammals .................................................................................................................................... 10 Reptiles........................................................................................................................................ 10 Amphibians ................................................................................................................................. 10 Aquatic macroinvertebrates and fish ......................................................................................... 10 3.4 Climate .............................................................................................................................................. 10 Precipitation ................................................................................................................................ 10 Temperature ............................................................................................................................... 11 Weather and hydrology monitoring stations.............................................................................. 11 Evapotranspiration and land cover ............................................................................................. 11 3.5 Water resources ................................................................................................................................ 11 Surface water features -.............................................................................................................. 11 Digital Atlas User Manual 3 Hydrogeology- ............................................................................................................................. 12 Water user permits ..................................................................................................................... 12 Water treatment plants, reservoirs and bridges ........................................................................ 12 Borewells and reservoirs............................................................................................................. 12 Water quality sampling locations ............................................................................................... 12 3.6 Public Health ............................................................................................................................... 12 LGAs – Local Government Authorities ........................................................................................ 12 iWASH water supply and sanitation interventions ..................................................................... 12 Water and sanitation in the Basin .............................................................................................. 12 3.7 Administration and Demographics ............................................................................................. 13 Administrative regions ................................................................................................................ 13 Transportation ............................................................................................................................ 13 Water User Associations ............................................................................................................. 13 3.8 Literature .......................................................................................................................................... 13 3.9 Help ................................................................................................................................................... 13 4. Sample Analysis Case Studies ............................................................................................................. 13 Coastal flooding vulnerability from Sea Level Rise and Storm Surge ................................................. 13 River flow analysis and comparison .................................................................................................... 17 Basic Water Balance: Spatial assessment of rainfall, ET and runoff ....................................................... Evapotranspiration analysis with land vegetation cover .................................................................... 17 Borewells, aquifers and fault zones .................................................................................................... 17 Digital Atlas User Manual 4 1 Objectives of the Digital Atlas The atlas is intended as a gateway to information about the Wami, Ruvu and Coastal river basins (administratively known as the Wami/Ruvu Basin) from the perspective of water resource management. The geophysical setting of the basin, land cover, the various water resources and the linkages of water with human activities and the ecosystem are geospatially presented. The Atlas has a built-in library of information about the Wami/Ruvu Basin. The information in the Digital Atlas is presented in the form of user-selectable and clickable map layers, data analyses and interpretation as well as links to reports, publications and websites. A selection of reports and publications pertaining to the Wami/Ruvu Basin has been included under the Literature section for quick reference. A major advantage of the Digital Atlas over a printed atlas or a book atlas is that a user can zoom into a map for a detailed view at any scale. Specific features such as forest reserves or hydrological stations can be clicked on to obtain more information. Furthermore, the user can combine different layers of data, adjust visual styles (scale ranges, colours and symbols) and labels and create their own maps using the digital product very easily. These user-created maps can be saved in various image formats for presentations, reports and publications. 2 Using the Digital Atlas The Digital Atlas is a standalone installation on a computer. The atlas has been created using GeoPublisher, which is an open-source atlas-creation software developed at the University of Bonn, Germany. The Atlas runs on the Java platform, which can be bundled along with the atlas installation files for installation on any computer. An internet connection is not required to use the Atlas. 2.1 Installation: All the files, data and Java operating system of the Digital Atlas are contained in a folder called DISK. This folder (about 600 Mb) should be copied in its entirety into a location on the user’s computer; either the desktop or a directory of the user’s choice. Most of the space is taken up by the Digital Elevation Model (375 Mb) file and the Terrain Slope file (90Mb). 2.2 Launching the Atlas: On a Windows PC, open DISK folder and click on atlas.exe file; this also has an icon associated. The icon can be saved on the desktop for easy access. On a Macintosh, inside the DISK folder, navigate to the folder atlas_data and click on atlas_resources.jar Digital Atlas User Manual 5 Clicking will launch the Atlas, with the message ‘caching codes, may take a minute’. A pop up screen appears, that has general introductory detail on the Atlas. Close that by clicking x on the upper right. 2.3 Exploring the Atlas: 2.3.1 Selecting a thematic map The user can select thematic maps from the menu bar on the top; maps have been grouped as physical environment, biodiversity, climate, water resources, infrastructure, society, literature and help. In addition there are pdf reports also included in the atlas, which can be accessed from the menu tab literature. These can also be accessed from many of the maps through internal links. 1.1.1 Features of a thematic map Choosing a map opens a window has a LEFT and a RIGHT panel, with a divider that can be moved to increase or decrease the size of each panel. The LEFT panel is the map legend, interpretation and information panel. It has two tabs – ‘legend’ and ‘info’. In the ‘legend’, one can turn layers off and on by clicking on the ‘eye’. Digital Atlas User Manual 6 Clicking the ‘info’ tab brings descriptive information about the thematic map including links to pdfs in the atlas library as well as web resources. Layers also have their own information, available by clicking I on the layer bar. The RIGHT panel is the map panel. The toolbar on top has controls to zoom in and out, to pan and navigate on the map as well as an information icon. To look at information related to a particular map feature, such as a graph of river discharge at a hydrological monitoring station, clicking ‘I’ on the right side map panel changes the cursor into crosshairs. One can then click on any feature on the map (such as a river or station or district) for added information that pops up as a table. Some of the layers, such as village streets, have a whole lot of other information associated with those streets such as census data (male, female, total, number employed, age distribution etc). There are different ways to display them on a map, and the user can then right click on the layer bar, choose ‘STYLE’, and then choose different ways to display the data from the menu. EXAMPLE: let us choose the Monitoring Stations thematic map from Climate. Here one can display both perennial and seasonal rivers, then display different types of monitoring stations such as rainfall, hydrological, water quality, isotope, weather stations, by clicking the eye on each layer toolbar. One can also zoom on and then click ‘I’ (for information) on map panel (upper right), to change cursor from arrow tip to crosshairs, and then click on a station to get info for that station. There are also links to reports that have graphs and analysis of data from the basin. Digital Atlas User Manual 7 3 Guide to the interpretation of maps and geospatial information 3.1 Atlas Menu structure: On launching the Digital Atlas, the main menu (top) lists the following menu options: File Landscape Ecosystem Climate Water Resources Public Health Administration/Demographics Literature Help 3.2 File This menu option has the following sub-menu options: Save screenshot –save the map displayed on the screen in three ways – with legend and coordinates, with coordinates and just the map. Saved as a .png file (Portable Network Graphics) that is an image format compatible with all programs and operating systems. The saved image can be used in reports, publications and presentations. Change language – the Atlas has the capability to display information in several languages. However, at this time, all information is in English only. Kiswahili can be added in the future if desired. Open popup window – basic information including contact information for the Atlas. Open terms of use window Exit – to close the Digital Atlas Application 3.3 Landscape (Physical Features) Topography and Terrain Slope – this thematic map displays the topography of the WR Basin as generated from the 30m ASTER Digital Elevation Model (DEM), the most current DEM available as of 2014. Seven tiles have been mosaicked to generate the coverage over the basin. The DEM file is large (~375 Mb) and hence can take some time to open. Horizontal spatial resolution is 30 m and vertical resolution 20m. A layer showing cities/towns has been added to provide a meaningful location reference for the topo map; this layer can be turned on and off. Source: National Aeronautics and Space Administration (NASA) and Japan Space Research Organization (JSRO). The DEM is a raster image with elevation data for each pixel. The DEM layer can be displayed as a color-coded set of elevation ranges just like a typical Digital Atlas User Manual 8 topographic map. The user has the ability to define a range of elevation values as an elevation class and then assign a colour scheme for the set of elevation classes or assign individual colours to individual classes. This ability to create elevation classes and display them can come in useful for terrain analysis. For instance, in order to examine which regions along the coast are vulnerable to flooding from sea level rise and storm surges, one can create elevation classes such as 0-1 m, 1-2 m, 2-3 m and so on, assigning different colours to each range. By coloring 0-1 m in red, and 1-2 m in orange for instance, one can see which areas are prone to what level of flooding. For more information, refer Sample Case Studies. The other layer in this thematic map is the Terrain Slope map, that is generated from the DEM using the ArcGIS Slope function. It represents the angle of slope (or gradient) of a 30m * 30m pixel (same pixels as the DEM). The default colour scheme is green-yellow-orange-red along an increasing gradient of slope steepness, with slopes > 45 degrees shown in red. Steep slopes are more susceptible to soil erosion. The slope map identifies the regions in the basin with steeper slopes that can then be analyzed for soil erosion potential based upon the land cover, rainfall and soil type. High rainfall together with low forest cover (fragmented forests, thin forest canopy, forest cleared for agriculture) can result in high soil erosion. These regions thus identified can be targeted for soil conservation measures. Geology and Soils – the geology layer provides information on the dominant geology of the basin. This information is also used to determine aquifer characteristics. For example, the Dodoma region overlies granitic rock, with very little porosity, indicating low aquifer capacity. However the presence of geological faults in the region suggests higher groundwater yield and lateral flow. The soils map indicates the dominant soil types. The city/town layer has been added to provide a spatial location reference; this layer can be turned on and off. Source: Japan International Cooperation Agency (JICA). Digital Atlas User Manual 9 Surface Water Features – this thematic map features rivers, wetlands, lakes and reservoirs in the WR Basin. Each layer can be turned on or off for avoiding a crowded display. Seasonal rivers are those that dry up in the dry season, while perennial rivers have water flowing all through the year (in most years). Wetland systems along river networks are displayed; these wetlands include areas under rice cultivation. Reservoirs are shown colour-coded as per storage capacity. The majority of the reservoirs are located near the coast and in the agricultural areas, while there are very few reservoirs in the semiarid Dodoma region. There are also regions of high rainfall with few reservoirs. By clicking on the information button (i) on the upper right panel, the cursor turns to crosshairs that can then be clicked on a feature for more information. For instance, clicking on a borewell yields further information on its name, location, river and capacity. Source: JICA Land cover: land cover maps from 2001, 2004 and 2005 are included here. Forests are largely restricted to the Eastern Arcs mountains, while most of the lowland miombo woodlands have been deforested and converted to agriculture, savanna grazing areas or degraded lands. Forests being critical to rainfall storage and regulation in catchments, the continual shrinking of forest areas is a matter of extremely grave concern for the water security of WR basin and deserves action at all levels. Source: JICA (2001-2004), AFRICOVER (FAO 2005). 3.4 Biodiversity/Forest Cover Forest reserves and national parks – these are the areas with the lowest human impact (deforestation, mining, agriculture, roadbuilding, etc) and hence are expected to have the best water quality in streams and rivers. Biomonitoring of water quality in streams based upon the diversity of aquatic macroinvertebrates requires knowledge of the invertebrate diversity in pristine free-flowing streams as a reference or control, to which other streams are compared and the condition evaluated. These are also the areas that provide habitat to wildlife and plants in different degrees of protection / human disturbance. In addition, croplands with trees also provide varying degrees of habitat to a subset of the species of birds, small mammals, reptiles, amphibians and insects. However, shrinking and fragmentation of forest cover and increasing distance between wildlands and croplands suggests the likely loss of all species except generalists that can survive in disturbed habitats. This section includes maps of known sightings in the WR basin, taken from reports that are included in the Literature section of this Atlas. Source: various Forest Cover Change – these maps are based upon classification of Landsat satellite images of the WR Basin over 2000-2012 by Hansen et al 2013 and displayed using Google Earth Engine. The forest cover change layer shows the forest cover in the year 2000 in green, forest increase in blue and forest loss in red. The second map shows just the forest cover loss. Most of the deforestation Digital Atlas User Manual 10 over 2000-2012 has occurred in the lowland forests or miombo woodlands/savannahs between Morogoro and Dar es Salaam, primarily for extensive charcoal production. Relatively less deforestation has happened in the Eastern Arc mountains over this period, on account of reserved forests there, and areas outside the reserved forests were deforested before 2000. Even so, there is continued deforestation. Each red dot is at a 30 * 30 m scale. Mammals – ranges are shown for each mammal along with the IUCN population conservation status for the species. The user can change the display style from a range area to a point located at the centroid of the range, in the interests of decreasing the display overlap between species ranges. Zooming into an area of interest also reduces the overlap of polygons representing individual species ranges. Reptiles – Similar to mammals. Amphibians – of special relevance to water, since amphibians need functioning aquatic ecosystems to exist. Both water quality and flow regime are fundamental to maintaining the structure and function of an aquatic ecosystem. To get an idea of the relative sizes of ranges of each species, click on Charts Available on the upper right panel, that shows a graph of the area. Aquatic macroinvertebrates and fish – a survey was carried out in wet and dry seasons of 2007 and 2011 at six sites on the Wami river and 5 sites on the Ruvu (not shown presently). These six sites were chosen from the headwaters to close to the estuarine end, and hence represent different stages of the river. One can select either the aquatic invertebrate or the fish layer from the left side panel under LEGEND, then click on I on the upper right (information), navigate to a station and click on that to get information on the invertebrate families/orders or fish species observed at that site. Additional stream habitat (whether pools and riffles) is also presented. There is a paucity of data in general, and hence the Atlas presents whatever data that is available. High wildlife diversity in an area suggests the existence of good quality habitat. Hence such areas can provide locations for sampling water quality in relatively un-impacted pristine watersheds for both chemical parameters as well as aquatic macroinvertebrate-based biomonitoring. 3.5 Climate Precipitation – mean annual rainfall for the WR Basin is presented in an isohet form with legend showing the rainfall range of each zone. The highest annual rainfall is seen to occur in the Eastern Arcs mountains almost upto 2400 mm. Next is the coast region. The lowest rainfall is seen over the semi-arid western WR basin. The layer of Individual rainfall stations can be turned off and on, while selecting the information button and positioning the cursor over a rainfall station and clicking brings up a window with additional information of that station. Source: IRLC GIS Unit Digital Atlas User Manual 11 Temperature – maps present annual and quarterly (seasonal) temperature predictions for the WR basin by an ensemble of 16 General Circulation Models ( or Global Climate Models run at the SRES A2 high greenhouse gas emission scenario and downscaled to a 50km grid (more information in www.climatewizard.org as well as in the Climate Change Vulnerability report included in the Literature section of the Atlas). Weather and hydrology monitoring stations – this thematic map contains individual layers for weather, rainfall, hydrology (river stage/flow) and water quality stations. In addition, sampling points for a stable isotope study are also shown. Just like other maps, layers can be turned on and off to avoid overcrowded map displays, while selecting the information button and clicking on individual stations can yield more information relevant to that station. Looking at the locations of stations can suggest locations for more stations to yield a spatially homogenous collection of data for both rainfall and river level. Source: WRBWO Evapotranspiration and land cover – evapotranspiration (ET) is a very large and significant part of the water budget in a watershed. ET is driven by primarily net solar radiation and the availability of water, while othger meteoriological factors such as relative humidity, air temperature and windspeed also play a role. Finally, the type of vegetation (crop types, tree species) also adds a high degree of variation in ET fluxes. This map shows ET estimates obtained by the MODIS project that are satellite-borne estimates that have been compared with eddy flux measurements across a variety of eddy covariance tower stations. A graduated scale (in green) is used to display ET magnitudes. Data here refer to actual ET and not potential ET; hence the semi arid Dodoma region shows lower ET than the Eastern Arcs mountains, owing to high water limitation in the semi arid regions. However, if irrigation using groundwater increases in the region, so will the water availability and hence ET will be expected to increase. Also included here is a land use layer that can be overlaid with the ET layer. Source: www.modis.org for ET dataset and JICA for Land Use Map. 3.6 Water resources Surface water features - This map contains the river drainage and major wetlands in the Basin. Other elements include hydrological monitoring stations (stage and discharge in some cases), perennial & seasonal rivers, topographic elevation, towns, subcatchment and administrative jurisdiction boundaries. Digital Atlas User Manual 12 Hydrogeology- This thematic map includes information on the various aquifer types and fault structures as well as groundwater level (SWL) and quality in the network of sampling wells maintained by WRBWO. Water user permits – this thematic map shows the locations of water use permit holders, along with information on levels of abstraction and classification by use, such as industry, irrigation, domestic, hotels and commercial, livestock, aquaculture and water supply entities. The location of industries for instance can suggest the possibility of water pollution (both surface and groundwater), and thereby sites for additional water quality monitoring in future. Similarly, irrigation users can also indicate whether they are tapping surface water or groundwater. Source: JICA/WRBWO Water treatment plants, reservoirs and bridges – individual layers showing locations of the above, with added information on each available on clicking with I selected. Reservoirs are surface water reservoirs, with symbols colour coded to indicate capacity. Source: JICA Borewells and reservoirs – locations of borewells are colour coded according to groundwater yield (cubic meters /second). Borewell locations are concentrated in the semi-arid Dodoma region and the coast region. Borewells are an indicator of groundwater use; the clustering in Dodoma region calls for computing a water balance to estimate the natural rate of groundwater recharge in that region, in order to avoid over-extraction of groundwater that can subsequently lower the groundwater table to levels that lead to shallow wells and streams drying up, as well as possible land subsidence. Similarly, over-extraction of groundwater in the coast region (around Dar Es Salaam) can result in accelerated sea water intrusion in coastal aquifers. While groundwater is a reliable and high quality water source, water table monitoring programs are essential. Water quality sampling locations – locations of past water quality sampling are indicated, along with values of chemical water quality parameters sampled on those dates. This layer can be updated with more water quality data to then make water quality maps. 3.7 Public Health LGAs – Local Government Authorities jurisdiction map – map of districts with demographic and area information. iWASH water supply and sanitation interventions – map showing locations of sanitation interventions along with information on school name, whether boys or girls school, number of users served and so on. Water and sanitation in the Basin – map layers include %households with access to improved water sources, sanitation, literacy, life expectancy and infant Digital Atlas User Manual 13 mortality (number of deaths per thousand births). Data is from the 2002 National census. 3.8 Administration and Demographics Administrative regions – wards, districts and regions. Population demographics – a detailed census data map at the sub-ward level is included here. Sub-wards are shown with street boundaries, and population demographic + socioeconomic information from each sub-ward is available by clicking a particular sub-ward with the “i” button selected, after zooming in. Information includes the population of each ward, gender ratio, economic level and nationalities of residents. Transportation – locations of cities and towns along with the road and railway network and bridges. Village streets are available in another layer. To look at villages in an area, the user needs to turn on the village streets layer and zoom in. Source: Tanzania Census 2002. Water User Associations – this map shows the locations of the villages belonging to the Mkondoa and the Mkindo Water User Associations respectively. In addition, the hydrologically delineated catchment boundaries are also included. 3.9 Literature A partial list of reports and publications relevant to the WR basin from a water resources perspective (pdf format) are included with the Atlas. These reports can be downloaded and opened using Adobe Acrobat Reader (available online freely). 3.10 Help 4. Sample Analysis Case Studies Examples of the types of questions and analyses made possible with the Digital Atlas are presented here. 4.1 Coastal flooding vulnerability from Sea Level Rise and Storm Surge Adjust the DEM in the Physical Environment submenu to create elevation classes starting from 0-1 m, 1-2 m, 2-3 m and so on, assigning bold colours to the lowest elevation classes. This then highlights the low-lying areas along the coast and river estuaries that are liable for flooding. The user can even change the classification to 0-0.5 m, 0.5 m – 1 m; however given the accuracy of the DEM, such a visualization is just to get an idea. More accurate elevation determination is performed using LIDAR technology. Open Physical Features -> Topography and DEM In the LEFT panel, under the wrmosaic1 layer, click on the spanner/wrench tool icon Style Digital Atlas User Manual This opens the AtlasStyler window. Click on Add new 14 Digital Atlas User Manual 15 Select Colors for Value Ranges Under Define value ranges to be painted in different colors, Select a color scheme and opacity level. The Opacity level allows other layers (such as towns, for reference) to be seen in a layer. Digital Atlas User Manual 16 Click on Classify to specify the ranges of values that comprise each class. Colors are then specified for the classes for display. There are several methods of classifying data; some of which are: 1. Natural Breaks (Jenks) that automatically look for clustering in the data 2. Quartiles that group the bottom 25%, 25-50%, 50-75% and 75-100% 3. Manual where the user decides how to create the groups. Usually, manual mode is chosen for specifying elevation classes for instance. Natural Breaks is the default method in AtlasStyler. Digital Atlas User Manual 17 On the right side (Define value ranges to be painted in different colors, choose a color scheme as desired. Click on Classify, method – Manual, and decide how many classes are needed (usually 5-10 are adequate). Then click on each elevation class, decide upon a color and adjust the text for the legend label. One can put red for the elevation range closest to sea level, to easily identify the most vulnerable zones. 4.2 River flow analysis and comparison Clicking flow stations (hydrological monitoring stations) on the map with the ‘I’ button (crosshair cursor) will bring up the plots of the monthly river discharges averaged from 1950s to 2012 (WRBWO data). This allows comparison of the seasonal magnitudes of flow in different tributaries of the Wami and Ruvu river systems. 4.3 Evapotranspiration analysis with land vegetation cover Examining the evapotranspiration map indicates the highest annual ET occurring in the EA mountains. This is correlated with high incident rainfall and forest cover. One can switch between ET and land cover maps at the same spatial resolution to observe the connection between land cover and ET. 4.4 Borewells, aquifers and fault zones A map of borewell locations gives an idea of where groundwater use is concentrated. Monitoring wells are suggested in those areas, as well as in neighboring areas to monitor water table dynamics on a daily and seasonal basis. Digital Atlas User Manual 18 Acknowledgements Funding for the Digital Atlas has been provided by USAID under the GLOWS I-WASH program. The Atlas has been developed by Florida International University in collaboration with the WAMI RUVU BASIN WATER OFFICE (WRBWO). Data contained in the Digital Atlas has been provided by the Wami Ruvu Basin Water Office of the Ministry of Water, Tanzania, Japan International Cooperation Agency (JICA), National Aeronautics and Space Administration (NASA), FAO-AFRICOVER (land cover), University of Montana (MODIS 16 Evapotranspiration), Google Earth Engine/Hansen et al 2013 (Forest cover change) and ClimateWizard (precipitation and temperature projections). The Atlas has been created using the open source atlas development and publishing software GeoPublisher (www.geopublisher.org) developed by Stefan Tzeggai, Germany. Developers: Amartya Saha, Ph.D, Associate Scientist Global Water for Sustainability Program (GLOWS) Florida International University 3000 NE 151 st , AC1-271, Miami FL 33181 USA Mercy Asha Mohamed, Water Resources and GIS IWASH Tanzania Program PO Box 768, Morogoro, TANZANIA