1
Objective, quantitative forecasting can help almost any business substantially.
There is, in other words, value added for business.
The future is uncertain, and this uncertainty must be represented
quantitatively. Statistical forecasting represents uncertainty as a probability
distribution. Two kinds of information are needed to describe the distribution:
the point forecasts and the confidence limits.
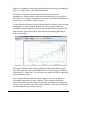
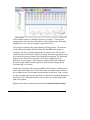
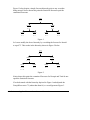
A point forecast is the mean value of the distribution of future values, and can
be thought of as a best estimate of the future value. Its upper and lower
confidence limits describe the spread of the distribution above and below the
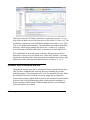
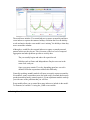
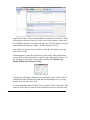
point forecast. Forecast Pro TRAC depicts this information graphically as
well as numerically.
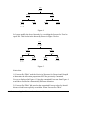
The upper confidence limit is often calibrated to the ninety-fifth percentile.
This means that the actual value should fall at or below the upper confidence
limit about 95% of the time. You can set the percentiles of both the upper and
lower confidence limits.
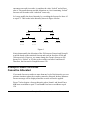
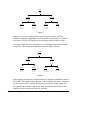
Let's illustrate this idea with an example. Suppose you were in charge of
forecasting widget sales for your company. If you wanted to determine
expected revenues for next month, you would be most interested in the point
forecast, since it is the mean value of the distribution. The point forecast gives
you the minimum expected forecast error.
12 A Quick Overview of Forecasting