1
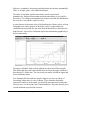
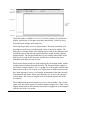
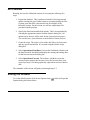
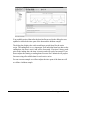
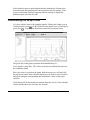
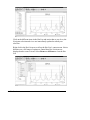
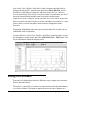
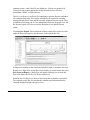
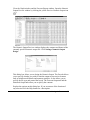
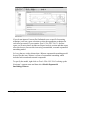
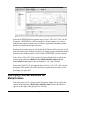
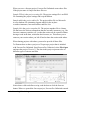
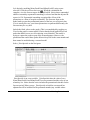
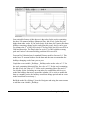
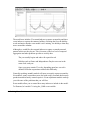
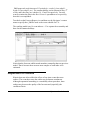
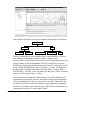
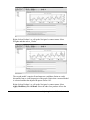
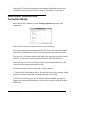
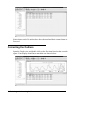
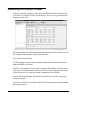
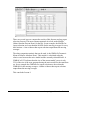
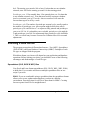
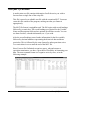
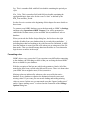
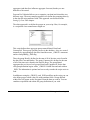
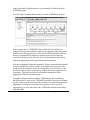
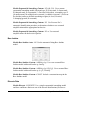
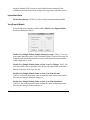
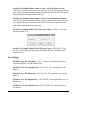
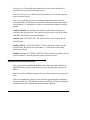
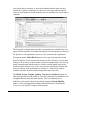
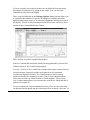
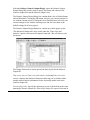
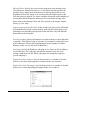
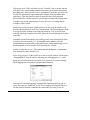
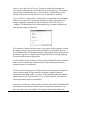
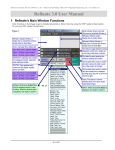
If the number of weeks in each period is consistent from year to year (i.e.,
period 1 always has 4 weeks, period 2 always has 4 weeks, period 3 always
has 5 weeks, etc.) then the variation due to the number of weeks in each
period will be captured as part of the seasonality and no special action is
required. In cases where the number of weeks in each period varies from year
to year (i.e., some years period 1 has 4 weeks other years it has 5) a weighting
transformation can be used to capture the variation due to how many weeks
are in each period.
The procedure is very straightforward. You construct a weighting variable
that classifies each period of the historical data and forecast period as
containing either 4 or 5 weeks. Forecast Pro Unlimited divides the historical
data by the weights. (This converts sales per period into sales per week per
period.) This deweighted series is forecasted. The forecasts are then
reweighted by multiplying by the corresponding weights.
The data for this exercise are contained in two Excel files. 4-4-5 Data.xls
contains five time series that were collected using twelve 4 or 5 week periods
per year. The number of weeks per period is not consistent from year to year.
4-4-5 Helper.xls contains the helper variable “_Weeks”.
Helper variables are either weighting variables or event variables. They are
identified by the use of a preceding or trailing underbar. They can either be
placed in the same data file as the series they are helping or placed in their
own separate file. In this example the helper variable _Weeks contains the
number of weeks in each period. It covers the historical span as well as the
forecast period.
Select Settings>Options and make sure that the data mode is set to Xls and
that the forecast horizon is set to 12. Create a script containing the two lines
4-4-5 Data
4-4-5 Helper
Read in the data and click the red Forecast icon to build the models. When the
calculations are complete, make sure that the Graph and Forecast Report
views are open and view the results for Product 1 (shown below). Notice that
a seasonal model is selected and that the adjusted R-square is 0.50.
70 Using Weighting Transformations