1
Int'l Conf. Software Eng. Research and Practice | SERP'15 |
109
Debugging Multi-Threaded Applications using Pin-Augmented GDB
(PGDB)
Nachiketa Chatterjee1 , Srijoni Majumdar2 , Shila Rani Sahoo2 , and Partha Pratim Das3
1 A. K. Choudhury School of Information Technology,University of Calcutta, Kolkata, West Bengal, India
2 School of Information Technology,Indian Institute of Technology, Kharagpur, West Bengal, India
3 Department of Computer Science and Engineering, Indian Institute of Technology, Kharagpur, West Bengal, India
Abstract— In contrast to single threaded applications, debugging multi-threaded applications is complex because of
the non-deterministic nature of concurrent programs. Multiple threads in concurrent programs introduce bugs like
datarace, deadlock and livelock. Popular debuggers like
GNU Debugger (GDB), Intel Debugger (IDB) and Microsoft
Visual Studio Debugger (MVSD) typically use static or
compile-time instrumentation and provide many features
to debug single threaded programs. However the features
dealing with debugging concurrency is limited. In this paper
we explore dynamic instrumentation using JIT (Just-InTime) compilation techniques for run-time behaviour using
dynamic instrumentation framework from Intel PIN [1].
Using PIN we augment GDB with support for datarace and
deadlock detection with automated breakpoint to GDB. We
call it PGDB or PIN-augmented GDB - a multi-threaded
debugging platform. We present here a prototype of PGDB
for detecting datarace and deadlock during the execution of
multi-threaded programs with the support of new commands
in PGDB.
Keywords: Multi-threaded debugging, datarace, deadlock,PGDB
or PIN-augmented GDB
1. Introduction
Debugging multi-threaded applications is complex because of the non-deterministic nature of concurrent programs leading to concurrency issues like race conditions and
deadlocks. Datarace occurs when two or more threads in
a program access the same memory location concurrently
without using any exclusive locks to serialize their accesses
and with atleast one access for write. Deadlock is a condition
in which two or more threads wait for each other to release
a shared resource before resuming their execution.
The classical approach to debugging single threaded applications (sequential programs) involves repeatedly stopping
the program, examining the state, and then either continuing
or re-executing to stop at an earlier point in execution.
Such debugging cycles help developers trace the sequential
execution paths well but unfortunately do not identify the
concurrency issues in multi-threaded programs.
Most popular debuggers like GNU Debugger (GDB)
[4], Intel Debugger (IDB) [5] and Microsoft Visual Studio
Debugger (MVSD) [6] provide many features to debug
single-threaded programs. However the features dealing with
debugging concurrency is limited (Table 1). Earlier Shi et
al [7] used PIN to extract different threaded behaviours of
applications by displaying the access / change history of a
shared variable, tracking locks held by threads and displaying information at the breakpoints but datarace or deadlock
was not detected. Also the method incurs huge overhead
for instrumentation. In this background our objective is to
augment the capabilities of existing debuggers with more
multi-threaded support to help debug concurrency issues.
A debugger typically uses static1 or compile-time instrumentation. However, we choose dynamic2 or runtime
instrumentation so that we can attach / detach debugging
support on-the-fly without changing compiled code.For dynamic instrumentation we use the PIN [3] framework from
Intel. Using PIN we augment GDB with support for datarace
and deadlock detection with automated breakpoint to GDB.
We call it PGDB or PIN-augmented GDB. Besides new GDB
commands for datarace and deadlock, we also support an
option to selectively enable/disable the detection mechanism
to reduce the overhead of dynamic instrumentation during
program execution.We have tested efficiency and accuracy
of PGDB by developing benchmark test cases.
Though the design of PGDB is agnostic to the platform,
the programming language or the multi-threading model,
our implementation here is based on GDB on Linux with
C/C++ language and pthreads [8] library for multi-threading
support.
This paper is organized as follows. In Section 2 we
outline the architecture of PGDB based on GDB, PIN and
their interconnection. The instrumentation mechanisms to
empower GDB detect concurrency issues like race condition
and deadlock are presented in Section 3 and the implementation aspects covering new GDB commands for concurrency
1 In Static Instrumentation the source code is instrumented during compilation and is used to identify the static program information.
2 In Dynamic Instrumentation the binary (executable) code is instrumented using JIT (Just-In-Time) compilation to collect run-time information.
110
Int'l Conf. Software Eng. Research and Practice | SERP'15 |
Table 1: Comparison of PGDB with Existing Debuggers
Feature/Debugger
Examining state of
existing threads
Thread
specific
breakpoints
Thread synchronizing breakpoints
Thread data sharing
events
Automatic notification of new threads
Logging Feature
Replay Feature
Datarace detection
Deadlock detection
Livelock detection
PGDB
GDB [4]
IDB [5]
MVSD [6]
×
×
×
×
×
×
×
×
×
×
×
×
×
×
×
×
×
×
- Additional Feature - Feature Present × -Feature Absent
support and enhancement of GDB GUI for user feedback
are discussed in Section 4. We present a sample debugging
session with PGDB in Section 5. The results debugging and
detection for a set of benchmark codes, designed specifically
to cover the corner cases of correctness of PGDB, are
discussed in Section 6. We conclude in Section 7 with
directions for future work.
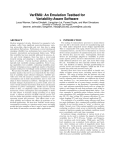
pthread_mutex_unlock() functions respectively. The
resulting architecture of PGDB is shown in Figure 1 A. To
use PGDB a developer needs to compile the source code in
debug mode to create a GDB-compatible binary. The binary
then executes in remote mode with PIN having custom
instrumentations (as pintools). Finally, GDB is started and
connects to PIN through remote port to debug and detect
concurrency issues. The developer controls the debugging
by issuing our new concurrency detection commands from
GDB.
2.1 Interconnection of GDB with Pin
GDB supports a remote mode where it can communicate
to the remote stub that understands GDB protocol via a
Serial or TCP/IP connection. In PGDB PIN connects to
GDB via its remote debugging protocol. The communication
with the debugger is two-way as shown in Figure 1 B. GDB
sends commands to PIN and PIN sends notifications back
whenever the program stops on intended breakpoints or terminates. Note that every program instruction that is executed
under the control of the debugger is still instrumented with
the PIN.
2. Architecture of PGDB
To augment GDB with the intended multi-threaded debugging features we need the following primitives:
• Control over memory accesses used by program to
identify memory instructions.
• Identification of read and write accesses to know the
purpose (reading or writing) of memory access by an
instruction.
• Control over thread granularity to find the thread ID
executing a given instruction and to notify when a
particular thread gets created or destroyed.
• Control over routine granularity to notify the start and
completion of a routine3 .
• Control over lock to notify when the locks of a sharedexclusive memory are acquired or released.
• Control over memory barrier to identify the user defined synchronization using memory barrier.
We use the dynamic instrumentation framework of
PIN4 to create pintools that extract the above primitives during the execution of an application under the
control of GDB. Since we use pthreads the events
of acquiring and releasing the locks are captured
from the invocations of pthread_mutex_lock() and
3A
function is referred to as routine by PIN.
[1] is a binary instrumentation framework on Linux or Windows.
A wide variety of program analysis tools, called Pintools [3], can be built
using PIN. PIN is a JIT compiler that can inject instrumentation routines
in instruction, basic block, routine or image level units. An instrumentation
routine is attached as a callback either before or after an instrumentation
unit. The design of these callbacks decide the behaviour of the pintool.
4 PIN
(a)
(b)
Fig. 1: (A) The Basic Architecture of PGDB (B) Interconnection of GDB with Pin via Remote Debugging Protocol
2.2 Breakpoint Propagation to GDB
PIN provides an API to generate breakpoint in GDB to
stop during program execution. When the Data Race Monitor
pintool identifies a potential Datarace or the Deadlock Detection pintool finds a deadlock event, a suitable breakpoint
is generated from within the respective pintool and is passed
on to the GDB console to stop the program execution. This
carries the thread ID and message for GDB console.
3. Design of PGDB
In PGDB we augment GDB with features to detect the
race condition and deadlock. These features may be turned
on or off dynamically during the execution of an application
under debug. We instrument RecordLockBefore()
and RecordLockAfter() before and after the
calls
to
pthread_mutex_lock()
respectively.
Further we instrument RecordUnLockAfter() after
Int'l Conf. Software Eng. Research and Practice | SERP'15 |
calls to pthread_mutex_unlock().
instrumentations implement these features:
Following
3.1 Data Race (Detection) Monitor
PIN provides APIs to identify memory accesses and to
detect if the thread holds a lock on it or not during the
access. Thus, to detect datarace we first identify the sharedexclusive memory locations and then monitor these locations
for accesses with or without lock by a thread.
111
exists in MemTracker we have the following situation:
– Existing Access type is READ or WRITE: This
is a case of WRITE-after-READ or WRITE-afterWRITE. Hence this memory location should be
marked as a shared-exclusive memory if the thread
IDs are different.
Instrumentation Policy
To identify whether or not a memory location is
shared among multiple threads, we maintain a hash table MemTracker where the key-field is a (32- or 64bit) memory address and the value-field is a memory region structure containing the Thread ID and the Access
type (READ/WRITE). We perform image instrumentation
to get the address range of the main executable image
as loaded into memory and shared library images to filter out memory accesses for the main executable only as
thread-local and read-only memory accesses do not induce
dataraces.We instrument every instruction belonging to the
main executable image and shared library images. Identifying memory locations is performed in two analysis routines
namely RecordMemRead() andRecordMemWrite()
before Load and Store instructions respectively. We use
thread IDs assigned by PIN for thread identification within
analysis routine
• RecordMemRead Routine is called before the execution of a Load instruction to analyse read accesses
from memory. The memory address, thread ID and
context are passed to this routine. When a memory
address is accessed for the first time a memory region
structure is populated with READ and is added to the
MemTracker. For subsequent accesses for a memory
location for which a memory region structure already
exists in MemTracker we have the following situations:
– Existing Access type is READ: This is a case of
READ-after-READ and there is no datarace.
– Existing Access type is WRITE: This is a case
of READ-after-WRITE. There is no action (and
no race) if the thread IDs are same. If the thread
IDs are different, this memory location should be
marked as a shared-exclusive memory.
• RecordMemWrite Routine is called before the execution of a Store instruction to analyse write accesses
to memory. The memory address, thread ID and context
are passed to this routine. When a memory address
is accessed for the first time a memory region structure is populated with WRITE and is added to the
MemTracker. For subsequent accesses for a memory
location for which a memory region structure already
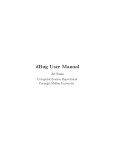
(a)
(b)
Fig. 2: (A) Race Detection (B) Identification of Safe / Unsafe
Access
We maintain a boolean variable flag (initialized to false)
for each thread for race detection (Figure 2 B). When
RecordLockAfter() is called, say, by Thread 1, we
enter the critical section and set flag for Thread 1 as
true. Later when RecordUnlockAfter() is called, we
know that the thread has left the critical section and we
reset the flag for Thread 1. Hence any access to a sharedexclusive memory location is a safe access while flag is
true. Otherwise it is unsafe.A memory location if marked as
shared-exclusive and has an unsafe access is a potential for
datarace invoking the breakpoint.
The above characterization of safety, however, changes
when users employ barriers for explicit synchronization. We
enumerate different cases of safety with and without barriers
in Table 2 and use them to formulate the following analysis
strategy for exploring datarace in the presence of barriers.
• BarrierDetect Routine is called before every call
of pthread_barrier_wait() to track the memory barriers. The MemTracker is now extended with
additional fields to store the barrier variable associated
with a thread and the order of the occurrence (Before /
After) of variables relative to the barrier. And if there
is no barrier at all then these fields will be NULL.
– When we encounter a variable X in a thread
before crossing a barrier, we insert a new
row in Memtracker as {<Mem_Addr>,
<Thread_ID>, <Access_type>, <No>,
<NULL>}. Now we have two possibilities either
we cross a barrier after this variable or the barrier
is not at all available.
∗ if variable occurs before a barrier then
during crossing the barrier named, say
112
Int'l Conf. Software Eng. Research and Practice | SERP'15 |
BAR_VAR, the pthread_barrier_wait()
callback will update the above row
in
Memtracker
as
{<Mem_Addr>,
<Thread_ID>, <Access_type>,
<BAR_VAR>, <Before>}.
∗ if there is no barrier at all then the row in
Memtracker will remain unchanged.
– If we have already crossed a barrier, say
BAR_VAR, before accessing the variable then
we insert {<Mem_Addr>, <Thread_ID>,
<Access_type>, <BAR_VAR>, <After>}
in Memtracker.
Here BAR_VAR will be the barrier variable name to deal
with multiple barriers. If the memory access in two
there is a cycle in the RAG. Thus, we can detect deadlock
by building the RAG (Figure 4 C).
Instrumentation Policy
To construct a RAG we identify the waiting and acquired
edges as follows:
•
•
•
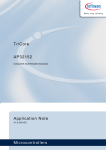
(a)
(b)
Fig. 3: (A) No Race Due to Barrier (B) Updating Memtracker
A waiting edge from thread t to resource (mutex) r is added to the RAG when t is blocked in
pthread_mutex_lock(&r) routine because some
other thread holds the lock on the mutex r. This is done
in RecordLockBefore().
An acquired edge from thread t to resource
(mutex) r is added to the RAG when t acquires the lock on the mutex r by completing
pthread_mutex_lock(&r). While an acquired
edge is added the existing waiting edge is removed.
This is done in RecordLockAfter().
An acquired edge is removed from the RAG
when thread t releases mutex r by completing
pthread_mutex_unlock(&r). This is done in
RecordUnLockAfter().
(a)
threads appear before and after the barrier respectively
(or vice-versa) like in Figure 3 A we can exclude this
condition from potential data-race factors. Then we
can formulate the additional logic for any variable X
appearing in threads T1 and T2 before or after a barrier
as cases 3, 4 and 5 of the Table 2.
If (((Occurrence of
AND
(Occurrence of
OR
((Occurrence of
AND
(Occurrence of
then NO DATA RACE.
X in T1 is before barrier)
X in T2 is after barrier))
(b)
X in T2 is before barrier)
X in T1 is after barrier)))
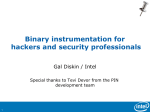
3.2 Deadlock (Detection) Monitor
To detect deadlock we use a Resource Allocation Graph
(RAG). An RAG is a directed bipartite graph with two types
of nodes and two types of edges. A RAG represents a thread
by a Thread Node and a resource by a Resource Node. If
a thread t owns (holds a lock on) a resource r, we draw
an Acquired Edge(Figure 4 B) from r to t. If a thread t
is blocked on a resource r, we draw a Waiting Edge(Figure
4 A) from t to r. Clearly, there is deadlock if and only if
(c)
Fig. 4: (A) Waiting edge in RAG (B) Acquired edge in RAG
(C) Deadlock detection by RAG
Once the RAG is constructed we detect deadlocks by finding
cycles in it and the deadlock breakpoint is invoked.
Int'l Conf. Software Eng. Research and Practice | SERP'15 |
4. Implementation of PGDB
We have implemented the above design over GDB to
create PGDB. For this we have added a set of new commands
to GDB (Section 4.1). The users can use these command as
input to PGDB to control the debugging of concurrency. Further we have enhanced the GUI mode of GDB (Section 4.2)
to output debugging information back to the user.
4.1 PGDB Commands
To use the detection monitors from PGDB, we have
designed the following simple commands that the developer
can issue to PIN through PGDB:
• monitor help: Display all customized commands to
debug concurrency issues.
• datarace detection on: Start the detection of sharedexclusive memory access (datarace).
• datarace detection off: Stop the detection of sharedexclusive memory access (datarace).
• datarace detection status: Shows whether the detection of datarace is ON or OFF.
• deadlock detection on: Start the detection of deadlock.
• deadlock detection off: Stop the detection of deadlock.
• deadlock detection status: Shows whether the detection of deadlock is ON or OFF.
4.2 Enhancement of GUI Mode of GDB
We have enhanced the support of graphical framework of
GDB and built the infrastructure to generate breakpoints by
our profilers. Among all existing graphical gdb in the market,
we have chosen DDD for this purpose which is a well-known
graphical gdb with clean and simple interface. Once DDD
layer comes on top of our PGDB, whenever a breakpoint is
generated by our profiler, it needs to be propagated to the
GUI layer from GDB so as to highlight the cause of the
detection by profiler in the source code of the application.
This is done very interactively using a cursor pointing the
exact line causing the detection of deadlock, datarace.
To integrate our new features with GDB, we designed a
shell script to automatically establish the connection between
PIN and GDB, and instantiate DDD irrespective of the
system architecture on which it is running.Higher level steps
are given below:
• Instantiate PIN with the designed Pintool or Profiler
• Start DDD interface which will run the GDB engine in
the background
• Establish remote connection between GDB and PIN, as
the application to be debugged will be running in PIN
which is outside GDB
• Open a separate source window of DDD displaying the
source code of test application
• Open a separate data window where variable values will
be shown while debugging
• Open the GDB command window to input the custom
commands and run the program
113
5. Sample Debugging Session in PGDB
We present example debugging in PGDB implementation.
5.1 Data Race Breakpoint Feature
Consider the following code being executed by Thread 1.
Suppose Thread 2 increments shared variable x without a
lock. Hence the value of y is not deterministic due to race.
if (x == 5) // The "Check"
{ y = x * 2; // If another thread changed x
// in between "if (x == 5)" and "y = x * 2";
// y will not be equal to 10.}
PGDB identifies the race and halts the program with a
breakpoint. When Thread 1 reads the value of x, it is
registered as a READ operation in MemTracker and when
Thread 2 increments its value, the race condition is detected
(Figure 2 A).
5.2 Deadlock Detection Breakpoint Feature
An example of deadlock is shown below where two
threads, Thread 1 and Thread 2, invoke transfer() as
shown:
void transfer(Account from_account,
Account to_account, double amount) {
pthread_mutex_lock(&from_account);
pthread_mutex_lock(&to_account);
from_account.withdraw(amount);
to_account.deposit(amount);
pthread_mutex_unlock(&to_account);
pthread_mutex_unlock(&from_account);
}
Thread 1: transfer(account#1, account#2, 1000);
Thread 2: transfer(account#2, account#1, 500);
As Thread 1 starts executing transfer() it holds lock
on account#1 and is suspended as it waits for lock
on account#2. Meanwhile Thread 2 acquires lock on
account#2 and waits indefinitely for Thread 1 to release
account#1. Deadlock results. A cycle in this RAG (Figure
4 C) implies deadlock.
6. Test Result
The benchmark test suite for test datarace and deadlock
are demonstrated in Sections 6.1 and 6.2 respectively. The
behaviour and performance on the benchmarks have been
presented in Sections 6.3 and 6.4.
6.1 Correctness for Datarace
The following scenarios are needed to test the correctness.
• Benign Datarace can occur when:
– One shared variable-two threads: 2 threads T1 and T2 share a variable
x with 2 different modes Read(R) or Write(W).
T2:
T1:
B1 x = x +1;
A1 x = x +1;
B2 printf("x=%d\n",x);
A2 printf("x=%d\n",x);
Datarace is detected in T2 at line B1 and in T1 at line B1 for the
execution sequence A1, B1, A2, B2 and B1, A1, A2, B2 respectively.
– Two shared variables-two threads: 2 threads T1 and T2 share 2 variables
x and y with 2 different modes Read (R) or Write (W).
T2:
T1:
B1 y = x +1;
A1 x = y +1;
B2 printf("y=%d\n",y);
A2 printf("x=%d\n",x);
114
Int'l Conf. Software Eng. Research and Practice | SERP'15 |
T2:
T1:
Datarace is detected in T2 at line B1 and in T1 at line B1 for the
execution sequence A1, B1, A2, B2 and B1, A1, A2, B2 respectively.
– Datarace in only one thread: T1 and T2 share 2 variables x and y with
2 different modes Read (R) or Write (W).
T2:
T1:
B1 pthread_mutex_lock
A1 pthread_mutex_lock
(&mutex);
(&mutex);
B2 y = x +1;
A2 x = y +1;
B3 pthread_mutex_unlock
A3 pthread_mutex_unlock
(&mutex);
(&mutex);
A4 x++;
Datarace is detected in T1 at line A4 for the execution sequence A1,
A2, A3, B1, B2, A4, B3.
– Datarace in two threads: 2 threads T1 and T2 share 2 variables x and
y with 2 different modes Read (R) or Write (W).
T2:
T1:
B1 y = x +1;
A1 x = y +1;
B2 x = y;
A2 y = x;
B3 printf("y=%d\n",y);
A3 printf("x=%d\n",x);
A1 x=(int*)
malloc(2*sizeof(int));
A2 x[0] = 1;
There exists a Fatal Datarace but it is not detected due to execution of
sleep (10) by T2 for the execution sequence B1, B2, A1, A2, B3.
6.2 Correctness for Deadlock
Since PGDB works on dynamic analysis, there are cases
of deadlock which get overlooked:
• Deadlock detected for the following case:
T1 and T2 share 2 variables x, y with 2 different modes Read(R) or Write(W)
with locking variables mutex1, mutex2.
T1:
A1 pthread_mutex_lock(&mutex1);
A2 pthread_mutex_lock(&mutex2);
A3 x = y+1;
A4 pthread_mutex_unlock(&mutex2);
A5 pthread_mutex_unlock(&mutex1);
T2:
B1 pthread_mutex_lock(&mutex2);
B2 pthread_mutex_lock(&mutex1);
B3 y = x+1;
B4 pthread_mutex_unlock(&mutex1);
B5 pthread_mutex_unlock(&mutex2);
Deadlock is detected in T2 at line B2 and datarace is also detected in T1 at line
A2 for the execution sequence A1, B1, A2, B2, B3, B4, A3, A4, A5, A5 and
for sequence A1, B1, B2, A2, A3, A4, A5, B3, B4, B5 respectively. Though
potential deadlock exists in the application, no deadlock occurred and hence
not detected by PGDB for execution sequence A1, A2, B1, A3, A4, A5, B2,
B3, B4, B5.
Datarace is detected in T2 at line B1 and in T1 at line A2 for the
execution sequence A1, B1, A2, A3, B2, B3. Another is detected in T1
at line A1 and in T2 at line B3 for the execution sequence B1, B2, A1,
A2, B3, A3.
•
Fatal Datarace can occur when:
– Case 1: 2 threads T1 and T2 share 2 variables x and y with 2 different
modes Read (R) or Write (W).
T2:
T1:
B1 x[1]=1;
A1 x=(int*)
B2 free(x);
malloc(2*sizeof(int));
A2 x[0] = 1;
Datarace is detected in T1 at line A2 for the execution sequence A1,
B1, A2, B2. Also segmentation fault at A2.
– Case 2: 2 threads T1 and T2 share 2 variables x and y with 2 different
modes Read (R) or Write (W).
T2:
T1:
B1 x++;
A1 x++;
B2 if(x == 0){
A2 if(x == 0){
B3 free(obj);
A3 free(obj);
B4 }
A4 }
B5 x--;
A5 x--;
Datarace is detected in T2 at line B1 and in T1 at line A2 for the
execution sequence A1:1, B1, A1:2, A2, A3, B2, B3, B4, A4, A5, B5
and Crash will happen at B3. Here A1:1 is "compute x+1" and A1:2 is
"assign to x".
– Case 3: 2 threads T1 and T2 share a variable x with in Write (W) mode.
T2:
T1:
B1 x=3;
A1 x = x+4;
Datarace is detected in T2 at line B1 for the execution sequence A1:1,
B1, A1:2 where A1:1 is "compute x+1" and A1:2 is "assign to x".
•
Benign/Fatal Datarace can occur when:
– Case 1: 2 threads T1 and T2 share 2 variables x and y with 2 different
modes Read (R) or Write (W).
T2:
T1:
B1 x=y-1;
A1 if ( x<y ) {
A2 z = x+4;
A3 y = z;
A4 }
A5 z++;
A6 printf("x=%d",x);
Datarace is not detected even though there is potential datarace in the
program for the execution sequence B1, A1 , A2, A3, A4, A5, A6.
– Case 2: 2 threads T1 and T2 share 2 variables x and y with 2 different
modes Read (R) or Write (W).
T2:
T1:
B1 x=y-1;
A1 if ( y<0 ) {
A2 sleep(10);
A3 y = x+4;
A4 }
A5 y++;
A6 printf("x=%d",x);
Datarace detected due to execution of sleep(10) by T1 as there is potential
datarace in the program for the execution sequence A1, A2, B1, A3, A4,
A5, A6.
– Case 3: 2 threads T1 and T2 share variable x with 2 different modes
Read (R) or Write (W).
B1 x[1]=1;
B2 sleep(10);
B3 free(x);
6.3 Benchmark Testing
To test the behaviour, accuracy and efficiency of PGDB,
we have used (with modification) a set of benchmarks of
popular dataraces detected by Google’s Thread-Sanitizer
Tool5 .
•
•
•
•
•
•
•
•
•
Case 1: No Datarace condition with one thread. Benchmark has only one
thread and does not have datarace. The result will be negative.
Case 2: No Datarace condition with synchronization. Benchmark has two
threads accessing one global shared variable which is synchronized with proper
locking mechanism to prevent datarace. Thus the result will be negative.
Case 3: Datarace condition with synchronized and non-synchronized shared
variables. Benchmark has two threads with two global shared variables. One
global is accessed using locks while the other is accessed without locks. So
access to one of them will lead to datarace. One datarace is reported.
Case 4: Datarace leading to crash due to write to freed memory or double
freeing. Benchmark has two threads accessing a dynamically allocated memory
location which is freed based on a reference count and a non-synchronized
access to this reference count will lead to being freed more than once hence
leading to program crash. Reported in real time applications like Chrome,
SQLite etc.
Case 5: Datarace on Boolean flag used for thread synchronization. Benchmark
has two threads and the synchronization between these two threads is done
using a boolean variable which is shared between the threads and due to out
of order execution in latest architectures leads to unexpected results. Datarace
will be reported on the shared Boolean flag.
Case 6: No Datarace condition by adding memory barriers for in-order
instruction execution. This benchmark consists of two threads with two shared
variables using memory barriers which enforces ordering of memory access for
shared data synchronization to solve unexpected results caused due to out of
order instruction execution. Result of PGDB should be negative.
Case 7: Datarace condition due to improper usage of memory barrier instruction. This benchmark consists of two threads with two shared variables. The
access to these shared data is not synchronized due to usage of memory barrier
instructions at improper places leading to datarace. Reported by PGDB.
Case 8: Datarace condition due to Initializing objects without synchronization.
Benchmark has two threads trying to initialize an object by dynamically
allocating memory. Since the allocation is done without any synchronization,
it might lead to memory leaks. Should be detected by our PGDB.
Case 9: Datarace on free. This benchmark has two threads where one thread
dynamically allocates memory in the heap whereas the other thread frees this
5 https://code.google.com/p/thread-sanitizer/wiki/PopularDataRaces
Int'l Conf. Software Eng. Research and Practice | SERP'15 |
Thread 1
#
1
void* func1() { x = 1;
pthread_barrier_wait(&bar);}
void* func1() { x = 1;
pthread_barrier_wait(&bar);}
void* func1() { x = 1;
pthread_barrier_wait(&bar);}
2
3
4
void* func1() {
pthread_barrier_wait(&bar);
x = 1; }
void* func1() { x = 1;
pthread_barrier_wait(&bar);}
5
6
void* func1() { x = 1;
pthread_barrier_wait(&bar); }
void* function1() {
pthread_barrier_wait(&bar);
x = 1; }
7
•
•
•
Table 2: Different Scenarios of Barrier
Thread 2
void* func2() { x++;
pthread_barrier_wait(&bar); }
void* func2() { x++;
pthread_barrier_wait(&bar);}
void* func2() {
pthread_barrier_wait(&bar);
y=x;}
void* func2() { y = x;
pthread_barrier_wait(&bar);}
void* func2() {
pthread_barrier_wait(&bar);
y = x; }
void* func2() { y = x;
pthread_barrier_wait(&bar); }
void* func2() {
pthread_barrier_wait(&bar);
y = x; }
area causing a crash due to datarace. So, the result of PGDB should be positive
with reporting of datarace.
Case 10: Datarace on exit. This benchmark has two threads created by the
main program which are accessing a shared global object where before both
the threads end, the main program exits thereby making the shared object
unavailable to both of them. Should be detected and reported by PGDB.
Case 11: Datarace on mutex. consists of two threads that are synchronized
by locking or unlocking a shared mutex and any change in mutex value or its
destruction by one thread will affect the other thread still in execution leading
to datarace of the mutex. This datarace should be reported by PGDB.
Case 12: Datarace on file descriptor. consists of two threads that are accessing
the same file descriptor for read/write purpose without any synchronisation
leading to data being written on a wrong file or socket causing leaking of
sensitive data into an untrusted network connection in real time. Reported by
PGDB.
Table 3: PGDB Output for Datarace
Benchmark Case
Case 1
Case 2
Case 3
Case 4
Case 5
Case 6
Case 7
Case 8
Case 9
Case 10
Case 11
Case 12
Expected Output
No Datarace
No Datarace
Datarace Exists
Datarace Exists
Datarace Exists
Datarace Exists
Datarace Exists
Datarace Exists
Datarace Exists
No Datarace
Datarace Exists
Datarace Exists
115
PGDB Output
×
×
×
- Data Race detected × -Data Race not detected
6.4 Performance Testing
The user can selectively turn on or off the instrumentation to increase performance. While instrumentation adds
considerable overhead on the execution time, we find that
with PGDB’s selective instrumentation it can be significantly
reduced.
7. Conclusion and Future Work
We have presented strategies to dynamically instrument
multi-threaded programs (written in C/C++ using pthreads
library) using PIN and to integrate the same with GDB
(on Linux) to debug for dataraces and deadlocks, if any.
Thread 3
NA
void* func3() {
x = 2; }
NA
NA
void* func3() {
x = 2; }
NA
void* func3() {
x = 2; }
Potential
of
Datarace between
(T1 & T2)
(T1 & T2) or (T2 &
T3) or (T1 & T3)
None
None
(T1 & T3) or (T2 &
T3)
(T1 & T2)
(T1 & T2) or (T2 &
T3) or (T1 & T3)
The support has been implemented with new commands in
PGDB (Table 1). Going forward we would like to support
livelock detection in PGDB, extend the augmentations for
Microsoft Visual Studio Debugger [6] on Windows, and
support other thread libraries / models like Windows threads
[11], Intel TBB [9] and Boost [10]. We would also like to
improve the performance of the pintools to make PGDB
more effective.
References
[1] Chi-Keung Luk, Robert Cohn, Robert Muth, Harish Patil, Artur
Klauser, Geoff Lowney, Steven Wallace, Vijay Janapa Reddi, and Kim
Hazelwood. Pin: Building Customized Program Analysis Tools with
Dynamic Instrumentation in PLDI ’05 Proceedings of the 2005 ACM
SIGPLAN Conference on Programming Language Design and Implementation (Chicago, IL, USA, June 12 - 15, 2005). ACM SIGPLAN
Notices, Volume 40 Issue 6, June 2005, Pages 190-200.
[2] Moshe (Maury) Bach, Mark Charney, Robert Cohn, Elena
Demikhovsky, Tevi Devor, Kim Hazelwood, Aamer Jaleel, ChiKeung Luk, Gail Lyons, Harish Patil, and Ady Tal. Analyzing Parallel
Programs with PIN, Journal Computer, Volume 43, Issue 3, March
2010, Pages 34-41.
[3] PIN User Manual: http://www.pintool.org
[4] GDB: The GNU Project Debugger: http://www.gnu.org/software/gdb
[5] IDB: Intel Debugger: http://software.intel.com/en-us/articles/idb-linux
[6] Debugging in Visual Studio: http://msdn.microsoft.com/enus/library/vstudio/sc65sadd.aspx
[7] Xiaoming Shi, Venkatesh Karthik Srinivasan, Madhu Ramanathan,
and Yiqing Yang. PinDB: A PIN-based Debugger for Multi-threaded
Programming, http://pages.cs.wisc.edu/ madhurm/pindb/pindb.pdf.
[8] pthreads (POSIX Threads): https://computing.llnl.gov/tutorials/pthreads/
[9] Intel
TBB
(Thread
Building
Blocks):
http://threadingbuildingblocks.org/
[10] Boost Threads: http://www.boost.org/
[11] Windows
Threads:
http://msdn.microsoft.com/enus/library/windows/desktop/ms684847(v=vs.85).aspx