1
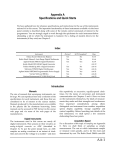
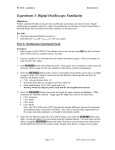
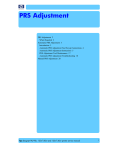
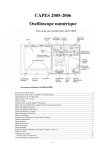
Exp. 4, USE OF BASIC ELECTRONIC MEASURING INSTRUMENTS, Part III
PURPOSE:
•
•
•
•
•
To become familiar with more of the instruments in the laboratory.
To become aware of operating limitations of input and output devices.
To understand the influence of instruments on circuits (Loading effect)
To understand and be able to measure the internal impedance of function generator and oscilloscope.
To understand the impact of interference signals and shielding on current and voltage readings.
This experiment relates to the following learning objectives of the course
1. Ability to interconnect equipment and devices such as multimeter, counters, and oscilloscope to achieve
required results.
2. Ability to relate practical laboratory results with lecture theory.
3. Ability to analyze and evaluate data.
LAB EQUIPMENT
-
Decade Resistance Boxes
Agilent E3640A DC Power Supply
Agilent 34410A Digital Multimeter/Timer/Counter
Agilent 33120A Function Generator (FG)
Agilent 54621A Oscilloscope1
Triplett 630 Analog Multimeter
STUDENT PROVIDED EQUIPMENT:
2 BNC to double-banana leads
6 Banana-to-banana leads
Experiment Sections:
1)
2)
3)
4)
Internal Impedance of the Function Generator and Oscilloscope
Loading Effects
Interference Signals
Ground Loops
Section 1) Internal Impedance of the Function Generator and the Oscilloscope
Overview of the influence of instruments on circuits (Loading effect) 1
Any instrument which accepts input signals will require both a voltage and a current to allow it to detect a
signal. This is because every signal must convey some energy/power—except the trivial case of the signal “0
volts.” When an input voltage is applied to, say, an oscilloscope, it must also draw a small current to allow it to
recognize that a signal has arrived. The amount of current required by an instrument depends upon how it has
been designed and built. The better an instrument (e.g., a scope or a multimeter) is, the smaller the current it
needs to register a given voltage or current, i.e., the higher its input resistance.
1
Partially adopted and edited in part from “Internal Impedance of Instruments,” courtesy of NJIT ECE department
1
In the previous experiments, we built circuits and made measurements by attaching instruments (a multimeter or
a scope) to various circuit points. In analyzing the circuits’ performance, we neglected the instruments’ presence
assuming that they have no influence on current and voltage distributions. Such an assumption is valid only for
"ideal" instruments but may be quite reasonable also for actual instruments in most practical cases. There are
situations, however, where the presence of an instrument attached to a circuit alters its performance to the point
where the measurement is meaningless, and other methods of circuit evaluation are needed. For instance, if a
voltmeter connected across a circuit element draws a current comparable to the current flowing through that
element, it can change the current and voltage distribution in the rest of the circuit. An ideal voltmeter does not
draw any current, a good voltmeter very little. Modern digital voltmeters approximate the ideal case in this
respect.
An instrument, such as a digital or analog voltmeter, may be represented by an equivalent circuit consisting of an
ideal meter and its internal resistance. More generally, we should consider internal impedance, which besides
resistance may have a capacitive or inductive component. For example, the capacitive component of the scope
input impedance plays a role in high-frequency measurements.
Another class of instruments in which internal resistance (ignoring the frequency dependence for now) plays an
important role is represented by power supplies. A voltage supply, such as a battery or power supply can be
represented as an ideal voltage source and a series resistance (output resistance). In an ideal voltage source, this
resistance is zero; there is no voltage drop across it, and the output voltage is independent of the amount of the
current drawn. The Agilent function generator is an output device with an output resistance of 50Ω. To account
for the loading effect, the function generator has a “High Z” and “50Ω” setting for output termination as
described in the figure below.
Source:
http://www.hit.bme.hu/~papay/edu/Acrobat/HP33120A.pdf
In this section, the internal resistance of basic instruments used in the laboratory will be measured and
situations where their internal resistance plays an important role will be explored. The lesson is worth
remembering whenever external instruments are connected to an electronic circuit. We will measure the
input impedance for our most important instrument, the oscilloscope, in this laboratory experiment. For now, we
ignore the frequency dependence of the oscilloscope’s impedance. The complex impedance of the oscilloscope
requires knowledge of RC-circuits response, which you may not have covered in lecture yet.
2
Internal impedance of the Function
Generator and the Oscilloscope.
The input impedance of an oscilloscope is
a complex quantity which can be
represented by a resistance in parallel with
a capacitance between the scope input
terminals and ground. The impedance is
thus frequency dependent. To compensate
for this frequency dependence, scope
probes are used. The circuit representing
an oscilloscope and probe is shown in the
figure.
The circuit representing an oscilloscope with a probe
RS -scope internal resistance, CS -scope internal capacitance,
CC - cable capacitance, RP - probe resistance, CP - probe
capacitance
For DC measurements only, we can consider the scope’s input impedance as being resistive. For AC
measurement, we must consider the scope’s input impedance since it contains an internal capacitive component
(frequency dependent). Note that the capacitance of the scope cable adds to the internal shunt capacitance of the
scope input. The scope probe eliminates the effects of this capacitance by compensating it with another
capacitance (scope probe capacitance). The probe capacitance is chosen so that the measurement is independent
of frequency. Thus, assuming the probe has effectively eliminated the frequency dependence of the scope, we
can obtain the scope internal resistance instead of its internal impedance via the same simple technique we use to
find the internal impedance of a multimeter.
Note: throughout this experiment, set the Agilent multimeter to “autorange” on the AC scale
a) Place the FG output termination to “HIGH Z” (Menu -> SYS -> 1. OUT TERM -> HIGH Z, then enter); this
will allow the FG reading to reflect the multimeter reading for the open circuit voltage measurement.
Configure the FG to supply a 4.0 Vrms sine wave @ 400 Hz with 0V DC offset. Measure and record the
output with the multimeter.
b) Connect the FG outputs to a decade box resistor (with a 1-Ω/step resolution) as shown below.
Function
Generator
BNC-to-Banana
Leads
Banana-t-Banana
Leads
Decade
Box
RInt
+
-
Multimeter
Ri
3
c) Adjust the resistance dials on the decade box until the output voltage of the FG, as measured by the Agilent
multimeter, at the terminals of the decade box, is one half of the FG’s original voltage setting.
d) Disconnect the decade box. Measure the resistance of the decade box and record this value.
e) Record the resistance of the BNC-to-banana cable, then subtract it from your resistance measure in part d
(which includes the resistance of the banana-to-banana cables) leads and subtract them from the measured
resistance of the decade box. This gives the internal resistance (output resistance) of the Function Generator.
Explain why.
f) Obtain the internal resistance of
the Agilent scope by setting up
the circuit shown. Note that for
DC signals, the internal
capacitance of the scope
behaves as an open. For this
experiment, do not use the
scope probes. Otherwise the
internal resistance of the probes
(9 MΩ) would have to be
included in the circuit and hence
you would not be able to obtain
the scope’s internal resistance as
described here.
Agilent E3640A DC
Power Supply
Decade Resistor
Box (100 kΩ Range)
Agilent 54621A
Oscilloscope
Ro ≈50Ω
+
-
4V
14
PF
Ri
Use BNC-to-banana leads instead of scope probes. For your calculation, use the nominal value of the
Agilent DC power supply output impedance (Ro ≈50Ω ) (Note that the output impedance of the power supply
could be found as was done for the function generator). To find the scope’s internal resistance Ri, select the
resistance of the decade box which causes the voltage as observed on the scope to drop to 1/2 of the voltage
measured directly (without the decade box). For DC measurement using scope, you can use its “Quick
Meas” and “Average” setting. If necessary, use two decade boxes in series (with different ranges) to obtain
precise readings. Make sure to use the oscilloscope for the two DC measurements (with and without the
resistor) and do not forget to subtract the 50Ω output resistance of the power supply from the decade box
reading to determine the scope’s internal resistance. Record the measured internal resistance of the scope.
Also, since the type of input coupling to the oscilloscope matters here, state which one (AC or DC) you
used.
Note: In addition to using Quick Measure > Averaging—which calculate the average of each scope trace—
press Acquire > Averaging and set # Avgs to its maximum, thereby averaging over several traces. As you
will see, this will eliminate the random fluctuations from the signal, leaving mainly the DC output of the
supply. Note that each time you change the resistance of the decade box, you should retrigger the scope (by
pressing Run/Stop twice) to restart the trace-averaging process
Questions: Section 1
1) Use the FG user’s manual to determine the internal impedance specification. Does this value agree with
your measured value? Calculate a percent difference between the two values.
2) Once again, explain the possible consequences of setting the voltage before or after connecting the supply to
the circuit in terms of the internal impedance of the input device. A circuit diagram would help here.
4
3) Explain why the scope’s internal resistance is equal to the decade box reading, minus the DC source output
resistance, when the voltage drops to half the original value. Neglect the resistance the meter leads in this
question.
4) Compare the measured value of the internal resistance of the scope with the manufacturer’s nominal value.
Record the percent difference.
Section 2) Loading Effects
a) Use the same FG output as Section 1, 3.0 Vrms sine wave @ 400 Hz with 0V DC offset.
Agilent 33120A
Agilent 34401A
Triplett 630
RS
+
VS
+
-
VL
RL
-
FG
Multimeter
Fig. 1 Equivalent Circuit for Section 2 Parts (b), and (c).
b) With the Agilent Multimeter, measure and record both the DC and AC values of the waveform. Note when
you measure an AC signal with zero DC offset, the digital reading of the Agilent multimeter (set to DC)
fluctuates around zero.
c) Using the Triplett 630, measure and record both the DC and AC values of the waveform. Be sure to zero the
Triplett analog meter before using it. Also, for all AC measurements with Triplett meter in this section, use
the 12 V scale. (You will see why the choice of scale is significant in the Questions)
d) Set the decade box resistance to 10kΩ. Place it in series with the FG and the Agilent multimeter (set on the
AC voltage scale). Record the voltage reading in your lab notebook. Note: This is not the usual way to use
a voltmeter.
e) Repeat d) using the Triplett 630
Agilent 33120A
RS
Agilent 34401A
Triplett 630
10kΩ
+
VS
+
-
VL
RL
FG
Multimeter
Fig. 2 Equivalent Circuit for Section 2 Parts (d) and (e).
5
Questions: Section 2
1) From step b), what was the DC offset of the waveform that you measured? How could you account for any
value other than zero?
2) Regarding the AC measurement made in this section: Note in parts b and c, the values obtained from both
the Agilent and Triplett meters were close to the source voltage; whereas in parts d and e, the Agilent value
was accurate but the Triplett value was not. This result is due to the much larger input resistance of the
Agilent meter. The first measurement made by the Triplett meter was (fairly) accurate because its input
resistance is much larger than the 50Ω internal resistance of the function generator; but, the second Triplett
measurement was not accurate because the meter does not have an input resistance much larger than the 10
kΩ resistor. For this measurement, calculate what the Triplett meter should have read and compare it to
what the meter actually did read. (For this purpose, you need to use the specified internal impedance of the
Triplett meter. Note that the internal resistance of the Triplett is specified in Ω/volt, and hence varies
depending on the scale you use—e.g., a 12-volt scale will have four times more internal resistance than the
3-volt scale.) How does this percent difference compare to the accuracy of the meter?
Note: You should have three different circuits [ 2), 3), and 4) ] along with four sets of calculations [ two for 2),
and one each for 3) and 4) ] for this section.
Section 3) Interference Signals and Shielding
Capacitive, inductive, radio frequency and ground loops interferences 2
When taking measurements, in particular of low-level signals, you will notice that the signal often includes a lot
of noise. This is usually due to interference from electric and magnetic sources which are present in the
laboratory or in nearby spaces, and the fact that the noise amplitude is comparable to the small signal amplitude.
This can include interference from fluorescent lights, switching power supplies, motors, a radio transmitter, or
even faulty grounding (ground-loop interference). Here are a few precautions that can be taken to reduce the
effects of interference.
-
Capacitive interference is the result of wires at different voltages placed in close proximity to each other.
When the voltage changes in one wire, a voltage can be induced in the neighboring one through
capacitive coupling. Examples are wires coming from equipment such as function generators and
oscillators, and wires from an outlet (60 Hz). The higher the frequency of the interfering source, the
larger the interference will be. Another source of capacitive interference is fluorescent lamps. The best
way to prevent capacitive interference is to use shielded or coaxial cable. The shield around the cable
is usually connected to ground and protects the inner signal-carrying conductor from the interference.
-
Inductive interference is the result of time varying currents in a conductor such as coils. It is not always
easy to prevent this type of interference. If possible, one should work a distance away from such
sources or shield the source with a ferromagnetic shield. Also, maintaining an appreciable distance
between large current carrying wires and small-signal carrying wires, and positioning current carrying
wires perpendicular to one another typically reduces inductive interference.
-
Radio frequency (RF) interference is the result of radio transmitters and arcing in motors. To reduce the
interference, one can shield the low-power signal carrying wire with a conducting shield connected to
ground.
2
Partially adopted and edited from “Signal Interference and Shielding.” Courtesy of University of Pennsylvania ESE
department
6
-
Ground loop interference is the result of voltage differences which often exists in the ground plane to
which the circuits are connected. This can be eliminated by connecting all ground points in the circuit
to a single earth ground.
Another good practice to reduce interference is to use short lengths for small signal lines and to keep their
positions fixed. If necessary, bond the wires to the chassis (or to the lab bench for his experiment).
Experimental procedure
a) Connect two test leads together at one end, and plug the other ends into the multimeter to form a complete
loop.
b) Move the loop around slowly, rotating its axis to find the maximum and minimum steady state voltages.
Record these values. Note: keep your wire loop fully open (i.e., approximately circular) while changing its
orientation. Turn on the oscilloscope and then drape the leads over and across this instrument; record the
maximum value of the voltage induced in the leads.
c) Twist the leads together over the entire length with about one crossover every three inches. Repeat the
measurement in the part b.
d) Leaving the test leads twisted, open the ends and connect them to the terminals of a decade box. Set the
resistance successively to 0 Ω, 100 Ω, 1 kΩ, 10 kΩ and 100 kΩ. At each resistance setting, touch the
decade box with your finger and record the steady state voltage observed. Note that you should press hard
when making contact with your finger.
Section 4) Ground Loops
a) Disconnect the multimeter leads from the decade resistance box and short them together (leads still twisted).
Record the voltage displayed on the multimeter.
b) Disconnect and untwist the leads, then connect the positive terminal of the multimeter to the ground terminal
of the FG. Note that the negative terminal of the multimeter and the positive terminal of the FG are left
open. Record the voltage. Turn off the FG; does this change the value of the voltage measured? If so,
record it.
Questions: Section 4
1) Any increase in voltage from step a) to step b) is caused by noise picked up in the ground loop. Draw a
diagram of the effective circuit used in part b) which clearly shows the ground loop that exists. Explain how
unwanted voltages are induced.
7