1
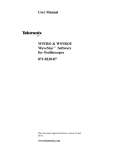
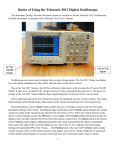
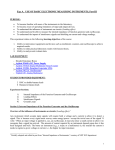
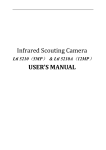
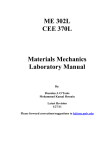
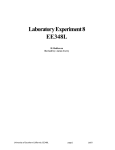
EE 3010 - Laboratory
Experiment 3
Experiment 3: Digital Oscilloscope Familiarity
Objectives:
Today's experiment builds on any previous oscilloscope experiences you may have had. Digital
oscilloscopes are popular today for a variety of good reasons, not the least of which is their ability to
hold and display data associated with either a periodic or one-time event.
Pre Lab:
•
•
Read and understand Hambley Section 5.1
Determine the VPeak and VPeak-Peak of a 120 VRMS signal
Part A: Oscilloscope Functional Check
Procedure:
1. Open to page 5 of the TDS-210 User Manual (red cover), turn the scope ON (top left), and allow
time for the self test to complete (about 5 seconds).
2. Connect a probe to CH-1 and make the test contacts described on page 5 of the user manual (we
only will test CH-1 today).
3. Push AUTOSET button and validate the probe. If the square wave is imperfect, contact your lab
instructor. Refer to page 6 of the user manual for information on probe compensation.
4. Select the CH-1 Menu button (left at center). A description of the display screen area is available
on page 10 of the User Manual. Record on the Data Sheet the following data read from the
bottom of the display screen:
• CH-1 volts per division (Item 11)
• Horizontal Time Base in seconds per division (Item 10)
• Probe amplification (if not 10X, toggle until it is)
Warning: Whenever using the probes, verify that the 10X magnification is selected.
5. Select the MEASURE button (top center) and toggle the upper submenu until Source = CH-1
(submenus are vertically stacked). Toggle again for Type and record on the Data Sheet:
• CH-1 Frequency
• CH-1 Period
• CH-1 Mean
• CH-1 Pk-Pk
Note: The CH-1 Pk-Pk value (VPP) provides the absolute difference between the maximum
and minimum peaks of the entire waveform. This value is not necessarily representative of
the steady state peak amplitude, so it should be interpreted sensibly.
6. Open the User Manual to page 20 so you follow along as you select the ACQUIRE button (top
right), viewing the display in several modes using the submenu buttons. For each mode, note the
effects of toggling RUN/STOP button (top right). Describe in your lab report your observations
and the differences between the acquire modes: Sample, Peak Detect, Average, and Averages.
Page 1 of 7
R.M. Laurie, G.E. Archer
EE 3010 - Laboratory
Experiment 3
Part B: Waveform Generator
Procedure:
1. Power up the HP-33120A waveform generator.
2. Develop experience setting the output frequency. Many options are available, such as:
FREQ ~
ENTER NUMBER
1500
ENTER
---> 1.500 kHz
---> 4.700 kHz
Describe in your lab report the function of the arrow keys for this step.
3. Now rotate the knob a few clicks:
----> 7.700 kHz
Try these combinations:
----> 7.670kHz
ENTER NUMBER
10
----> 10.000MHz
ENTER NUMBER
10
----> 10.000kHz
Describe in your lab report the function of the arrow keys for this step.
In the future, set frequencies as you best see fit.
4. Now practice setting output amplitudes.
AMPL
ENTER NUMBER
110
----> MAX VALUE
----> 10 VPP or 20 VPP
(either is acceptable)
Explain in your lab report what happened?
ENTER NUMBER
110 SHIFT
----> 110 mV RMS ~
Describe in your lab report the effect SHIFT
Page 2 of 7
had on the units display?
R.M. Laurie, G.E. Archer
EE 3010 - Laboratory
Experiment 3
5. Next select the square wave button,
SHIFT ENTER
, followed by
----> D: SYS MENU
(as needed)
ENTER
----> HIGH Z
----> EXITING
NOTE: We should take this step whenever our circuit has an impedance
exceeding several hundred Ohms.
6. Using any method, set:
AMPL 200 mv PP
FREQ
1.100 kHz
Part C: Signal Measurements
Procedure:
1. For this part you will use the HP33120A waveform generator as an AC Voltage Source. Use any
method described in Part B to set the HP33120A for a sinusoidal output ~ with amplitude 1.2
VRMS and frequency of 60Hz. This signal is a scaled down representative of standard AC power
available at most household outlets, which has an amplitude of 120 VRMS at a frequency of 60Hz
2. Configure the Fluke 45 as an Ohmmeter and measure the resistance of the 1000Ω resistor. Record
this value in the data sheet.
3. You will use the Fluke 45 as an AC Voltmeter by pushing the V~ button. All readings will now
be in VRMS.
4. Configure the Kiethley multimeter as an AC Ammeter by pushing the ACI button in and set the
meter to Auto Range.
5. Construct the circuit described by Figure 1. Do Not connect the positive lead of the HP33120A
until you have verified the other circuit connections are wired correctly. Make certain that the
Ammeter is connected in SERIES and the Voltmeter is connected in PARALLEL. Note the common
ground connection is simply one conductive path referenced at zero volts. Use banana leads to
connect the components, but X10 probes to measure the voltage directly across the 1000Ω resistor.
In connecting the probes, use common sense precautions to avoid breaking the delicate arms.
Alligator clips from probes must be connected to the common ground.
6. Record values on the data sheet for AC Volts and AC Current measured with the multimeters.
Page 3 of 7
R.M. Laurie, G.E. Archer
EE 3010 - Laboratory
Experiment 3
Figure 1
7. Push AUTOSET to generate a display. If the display is excessively noisy, the problem is usually
sloppy leads, so try to remedy these first. If changing leads doesn't correct a problem, ask for help.
Verify you are using X10 probe settings (CHANNEL MENU buttons). Experiment with the volts
per division and seconds per division knobs on the oscilloscope to properly display the voltage
waveform. Adjust the waveform position using the position knobs. Record values on the data sheet
for the CH1 volts per division and seconds per division.
8. Push the MEASURE button of the oscilloscope and repeatedly the CH1 softkey. Record measured
values on the data sheet values for Frequency, Period, VMean, VP-P, and VRMS. Describe in your lab
report your observations and comment on whether these values agree with what is expected.
9. Reconfigure the circuit as shown in Figure 2 by replacing the 1000Ω resistor with a 6.8µF capacitor
in series with a 6.8KΩ resistor. Connect the X10 CH1 Probe to the Ammeter side of the 6.8KΩ
resistor and the the X10 CH2 Probe to the 8.2µF capacitor. Both alligator clips of the X10 probes
should be connected to the ground side of the 8.2µF capacitor.
10. Push AUTOSET to generate a display. If the display is excessively noisy, the problem is usually
sloppy leads, so try to remedy these first. If changing leads doesn't correct a problem, ask for help.
Verify both channels are using X10 probe settings (CHANNEL MENU buttons). Experiment with
the volts per division and seconds per division knobs on the oscilloscope to properly display the
voltage waveform.
11. Go to the PC and start the WaveStar Application. This Program allows you to acquire the display of
the digital oscilloscope. Print your display and include it with your lab report. Describe in your lab
report your observations and comment on whether these values agree with what is expected.
What are the observed phase angle and frequency differences between CH1 and CH2?
12. Ask your lab instructor to verify your results. Then disconnect your equipment and neatly return
items to their original locations.
Page 4 of 7
R.M. Laurie, G.E. Archer
EE 3010 - Laboratory
Experiment 3
Figure 2
Page 5 of 7
R.M. Laurie, G.E. Archer
EE 3010 - Laboratory
Experiment 3
Data Sheet
Prelab:
VPeak __________
VPeak-Peak_________________
Part A: Oscilloscope Functional Check
CH-1 volts per division ___________________
Horizontal seconds per division ____________
Probe amplification ______________________ (if not 10X, toggle until it is).
CH-1 Frequency ___________
CH-1 Period ______________
CH-1 Mean _______________
CH-1 P-P _________________
Part C: Signal Measurements
Measured Resistance ______________
Measured Voltage ________________
Measured Current ________________
Frequency _______________________
Period___________________________
VMean ___________________________
VP-P _____________________________
VRMS __________________________
Your Name_____________________________
Partner Name___________________________
Lab Instructor___________________________ Date______________
Page 6 of 7
R.M. Laurie, G.E. Archer
EE 3010 - Laboratory
Experiment 3
Discussion guide for Experiment 3
Part A:
Proc. 6: Describe your observations and compare the difference between the acquire modes:
Sample:
Peak Detect:
Average:
Averages:
Part B:
Proc. 2, 3: Describe the function of the arrow keys when seting the output frequency.
∧,∨ :
<, >:
Proc. 4: Show the result when setting the output amplitudes using the following keys, and explain why.
Enter number 110 ∧ :
why?
Enter number 110 shift ∧ :
Enter number 110 shift
∨:
Describe the effect SHIFT had on the units display.
Enter number 110 ∨
, explain why the result is 7.07/3.53 VRMS?
Part C:
Proc. 7: Record values for the CH1 volts per division and seconds per division.
volt/div:
sec/div:
Proc.8: Describe your observations and comment on whether these values agree with what you expected.
Proc. 11: Print the display acquired from the oscilloscope. Describe your observations and comment on
whether these values agree with what you expected.
Phase angle difference between CH1 and CH2:
Frequency difference between CH1 and CH2:
Comments:
Page 7 of 7
R.M. Laurie, G.E. Archer