1
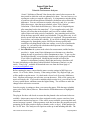
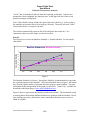
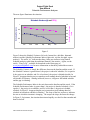
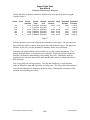
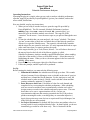
Project Flight Deck
User Manual
Schedule Performance Analyzer
Operating Instructions
Operating the plug in is simple: when you are ready to analyze schedule performance,
open the .mpp file provided by ProjectFlightDeck, go into your schedule, and run the
macro called, SchPerfAna.
Here are detailed, step-by-step instructions:
1. When you are ready to run the Analyzer, open the .mpp file provided by
ProjectFlightDeck. The file is named, Schedule Performance Analyzer
mmddyy.mpp, where mm = numerical month, dd = numerical day, yy =
numerical year on which the module was released. The .mpp file is the
“container” for the macro. Leave the macro open as you proceed through the next
steps.
2. Go into the schedule that you want analyzed—the “target” schedule. The phrase
“go into” means either go back into a schedule that you had already opened (reactivate it) or open the schedule anew. The sequence with which the container
and the target files are opened is irrelevant. It is only important that both are open
at the same time when you want to produce the report.
3. In the target schedule, go to Tools, Macro, Macros. You will observe that one of
the macros listed on the left side of the Macros window is called,
Schedule Performance Analyzer mmddyy.mpp!PFDSchPerfAna, where mmddyy
is the date of the module’s release, as described in step 1. Select that macro by
highlighting the name. When you do so, the name appears in the box under the
heading, Macro name: .
4. Press the Run key on the upper right side of the Macro window.
5. Follow the prompts, and the report will be produced.
Set Up
Before running the Analyzer you must take the following steps:
1. Maintain the Schedule: the schedule must be kept up-to-date. This sounds
obvious, but many Project Managers create a schedule at the start of a project
and then leave it untouched for the duration. For the Analyzer to work, the
schedule must be taken seriously. Ideally, track work that is done and that
remains; minimally, maintain % Complete.
2. Enter Resources and Costs: Calculation of value for work planned and
completed is key to assessing the schedule performance. Most scheduling
tools use resources and their costs to automatically calculate such values.
Assign resources to tasks in the schedule and enter resource rates. The rates
do not have to be exact—approximations will do. (In fact, our
experimentation indicates that entering a nominal rate like $100 per hour
produces meaningful results, even though they are somewhat imprecise.)
Again, these points may seem obvious to experienced Project Managers, but
in the field, they are often omitted.
3. Set Project Parameters: By default, MS Project does not attribute value in a
current period for work completed ahead of time. In plain English, you do not
immediately get credit for work done early. This is consistent with the
PFD User Manual Schedule Analyzer
1
©2007
ProjectFlightDeck
Project Flight Deck
User Manual
Schedule Performance Analyzer
“classic” definition of Earned Value because the earned value accrues to the
time period in which the work was planned to be done. You can, however, set
a parameter so that you earn the value early. It is important to note that doing
so conflicts with advanced Earned Schedule calculations such as Schedule
Adherence. You may still want to earn the value early, and, if so, you must
follow these steps: open the target schedule, select Tools, Options,
Calculation. Check mark the box that says, “Move end of completed parts
after status date back to the status date”. If you complete tasks early, MS
Project will reflect that in the schedule, and you will be credited with the
value of that work in the period of completion. Any remaining work will be
left in the future period in which it was scheduled. If it gets done early, it will
also be moved back into the period when it is completed. The parameter must
be set before you baseline the schedule. If you decide to change the parameter
setting part-way through the project, MS Project does not go back and
recalculate everything based on the new settings, even if you re-baseline the
project. So, you end up with calculations that represent a mix of settings,
leading to inconsistent results.
4. Set a Baseline: the system needs a basis for measurement, and the baseline
provides it. Again, many Project Managers are reluctant to set a baseline,
perhaps because it represents a visible commitment to dates. To get over the
psychological hurdle, set a preliminary baseline early in the project and then
re-set it later for publication. Modifying the baseline will affect the
Anlayzer’s calculations, but that is better than not having a baseline at all.
For more information on the theory behind Schedule Performance Analysis, see the
article, “Time Is Up”, available for download at no cost from the Home page of
www.projectflightdeck.com .
Before running the macro, ensure that the macro security settings in MS Project are
correct. Go to Tools, Macro, Security. If the setting is either Very High or High, you
will be unable to run the macro. So, check mark a lower level of security (Medium or
Low). Medium will prompt you each time you run the macro. With a Low setting, the
macro will simply run. If you need to maintain a high security level, you will have to set
it lower, run the macro, and then restore the higher setting. You will have to make the
change before each macro execution.
Once the security is settings are done, you can run the macro. With the target schedule
open, select Tools, Macro, Macros. Ensure that the PFDSchAna macro is highlighted.
Press Run.
The plug in first does edit checks to ensure that the planned value and earned value are
available—that means resources have been assigned to tasks, resource rates have been
entered, and a baseline has been set. If the values are not available, processing halts and
an error message is posted. If the preparatory work has been done, the program proceeds,
prompting for the time periods to analyze (months, weeks, or days). It then prompts for
the “As Of” date. The Analyzer will report on results up to and including that date. The
PFD User Manual Schedule Analyzer
2
©2007
ProjectFlightDeck
Project Flight Deck
User Manual
Schedule Performance Analyzer
“As Of” date is normally the date on which the reporting period ends. Once the two
prompts have been completed, the Analyzer runs. In the upper left line of the screen,
progress messages are displayed.
Note: if the schedule is large and the time period selected is small (e.g., weeks or days),
the standard version takes about 10 seconds per 100 tasks. The newly released “Turbo”
version takes about 1 second per 100 tasks.
The Analyzer automatically opens an Excel file and places the results in it. For
comments on how to use the output, see the next section.
Practice
The first step is to review the Baseline Schedule vs. Earned Schedule. See the sample
chart below.
Baseline Schedule vs. Earned Schedule
Cumulative Months
7
6
5
4
3
2
1
0
Jan
Feb
Mar
Apr
May
Jun
Figure 1
The Baseline Schedule (in Figure 1, the top line, dark blue, diamond markers) represents
the expected progress on the schedule. The Earned Schedule line (in Figure 1, the bottom
line, hot pink, square markers) represents the actual progress on the schedule. For more
information on the interpretation of the graph, see the article, “Time Is Up”, available for
download on the Home page of www.projectflightdeck.com .
Figure 1 shows a gap between the baseline and the actual results. The fact that the actual
is tracking below the baseline indicates that there are problems with the schedule. Had it
been tracking on or above the baseline, that would indicate that the project was on or
ahead of schedule.
PFD User Manual Schedule Analyzer
3
©2007
ProjectFlightDeck
Project Flight Deck
User Manual
Schedule Performance Analyzer
The next figure illuminates the situation.
Schedule Variance(t) and SPI(t)
1.2
1
0.5
0.8
0
0.6
0.4
-0.5
0.2
-1
0
Jan
Feb
Mar
Apr
May
Schedule Performance
Index
Schedule Variance
1
Jun
Figure 2
Figure 2 shows the Schedule Variance (left scale, bottom line, dark blue, diamond
markers) and the Schedule Performance Index (right scale, top line, hot pink, square
markers). The suffix “(t)” indicates that these values are measures using Earned
Schedule analysis, rather than the traditional Earned Value metrics. Again, see the
article, “Time Is Up”, available for download on the Home page of
www.projectflightdeck.com for more information on the theory behind the measures.
The Schedule Variance is simply the difference between the baseline and the actual. If
the Schedule Variance is greater than 0, the project is ahead of schedule; if it is equal to
0, the project is on schedule, and if it is less than 0, the project is behind schedule. In
Figure 2, it appears that the project started out well running ahead of schedule in Jan and
on schedule in February. Starting in March, however, it began to fall behind schedule
and the gap is widening.
The Schedule Performance Index is the ratio between the baseline and the actual. If the
Schedule Performance Index is greater than 1, the project is ahead of schedule; if it is
equal to 1, the project is on schedule, and if it is less than 1, the project is behind
schedule. In Figure 2, it appears that the project started out well running ahead of
schedule in Jan and on schedule in February. The slope of the line, moreover, indicates
the rate at which the situation is changing. The steeper the slope, the faster the change.
In Figure 2, for instance, the situation deteriorated rapidly over the first three months and
then leveled off.
PFD User Manual Schedule Analyzer
4
©2007
ProjectFlightDeck
Project Flight Deck
User Manual
Schedule Performance Analyzer
Finally, the table of numbers sometimes tells the story more precisely than the graphs.
Consider Figure 3.
Period
Count
Jan
Feb
Mar
Apr
May
Jun
1
2
3
4
5
6
Earned
Schedule
1.074
2
2.801
3.675
4.309
4.872
Earned
Value
$192,000
$312,000
$390,144
$496,000
$584,000
$668,800
Planned
Cost
$182,400
$312,000
$409,600
$537,600
$688,000
$832,000
Schedule
Variance
0.074
0
-0.199
-0.325
-0.691
-1.128
SPI(t)
1.074
1
0.934
0.919
0.862
0.812
Estimated
Duration
5.586
6
6.427
6.531
6.963
7.389
Estimated
End Date
1-Jun-07
1-Jul-07
1-Jul-07
1-Jul-07
1-Jul-07
1-Aug-07
Figure 3
After the numbers leveled off in March, they started to worsen again. The projected end
date reflects the shift as it moves from June to July and finally to August. The projected
end date, by the way, uses the Schedule Performance Index in its calculation.
In practice, the graphs and the numerical table act as early warning instruments. They
portray the performance, or lack thereof, on a schedule. Experienced Project Managers
often have an intuitive understanding of how things are going. Quantitative analysis
supplements the intuition and provides hard data that they can use to inform and express
their intuitions.
This is especially true on large projects. The size and complexity of such schedules
makes it difficult to grasp and explain the overall picture. The Project Schedule Analyzer
assists Project Managers in identifying problems early, evaluating the seriousness of the
situation, and explaining it to others.
PFD User Manual Schedule Analyzer
5
©2007
ProjectFlightDeck